Where to Buy Property Investments in Salisbury: Yields of 4.3%
Salisbury's gross rental yields range from 3.3% to 4.3% across postcodes with rental data, with SP2 delivering the highest returns. Average sold prices in Wiltshire sit 13.9% above the England average, and the local authority's population grew 8.4% to 510,333 between the 2011 and 2021 censuses.
Wiltshire's average sold price of £332,483 places Salisbury in a different bracket to most buy-to-let locations covered on this site. That is £40,618 above the England average and £31,257 above the South West regional average. The data below covers 5 postcodes from SP1 to SP5, with rental data available for 4 of them. SP3 (Tisbury, Dinton) returns no rental or yield figures due to low listing volumes in this rural postcode.
This guide covers all 5 Salisbury postcodes under the Wiltshire unitary authority (ONS code E06000054). Salisbury is a city in the South West of England, centred on the medieval cathedral where the Rivers Avon, Nadder, Ebble, Bourne, and Wylye meet. The postcodes extend from the city centre (SP1) through Amesbury and the Salisbury Plain military corridor (SP4) to rural villages south towards the New Forest (SP5). Investors comparing options in the region may also consider Swindon, Bath, or Bournemouth. Browse all our South West location guides.
Article updated: March 2026
Salisbury Buy-to-Let Market Overview 2026
Salisbury's Wiltshire postcodes sit above the England average for sold prices, with a two-tier split between affordable city postcodes (SP1, SP2) and premium rural areas (SP3, SP5) that shapes the buy-to-let picture.
- Average sold price: £332,483 (13.9% above England's £291,865)
- Asking price range: £331,928 (SP2) to £542,293 (SP5)
- Rental yields: 3.3% (SP5) to 4.3% (SP2) across postcodes with rental data
- Rental income: Monthly rents from £1,173 (SP1) to £1,509 (SP5)
- Price per sq ft: Sold prices from £329/sq ft (SP4) to £390/sq ft (SP5)
- Market activity: Sales ranging from 9 per month (SP3) to 38 per month (SP2)
- Deposit requirements: 30% deposits range from £99,578 (SP2) to £162,688 (SP5)
- Affordability ratios: Property prices from 8.8 to 14.3 times Salisbury's median annual salary of £37,811
Contents

-
by Robert Jones, Founder of Property Investments UK
With two decades in UK property, Rob has been investing in buy-to-let since 2005, and uses property data to develop tools for property market analysis.

Property Data Sources
Our location guide relies on diverse, authoritative datasets including:
- HM Land Registry UK House Price Index
- Ministry of Housing, Communities and Local Government
- Ordnance Survey Data Hub
- Propertydata.co.uk
We update our property data quarterly to ensure accuracy. Last update: March 2026. All data is presented as provided by our sources without adjustments or amendments.
Why Invest in Salisbury?
Salisbury is in the local authority of Wiltshire, who's population reached 510,333 at the 2021 Census, an increase of 8.4% from 470,981 in 2011. This growth rate is above the England average of 6.6% and reflects sustained demand across the Wiltshire unitary authority area. The population figure covers the full local authority, which includes the city of Salisbury alongside market towns such as Amesbury, Wilton, and Tidworth, as well as extensive rural areas across Salisbury Plain.
Salisbury's economy draws on a mix of military, heritage tourism, and professional services. The Salisbury Plain military presence generates consistent rental demand across SP4, where the Army Basing Programme brought 4,300 service personnel and their families to the area. The city centre functions as a regional hub for south Wiltshire, with Salisbury District Hospital and the Cathedral Close attracting both workers and visitors. Salisbury does not have a university campus, so the rental market here runs on professional and military tenants rather than the student cycle. Agriculture and food production remain significant employers across the rural postcodes.
Salisbury Economic Summary
- Population: 510,333 (2021 Census). Growth of 8.4% from 2011.
- Median annual salary: £37,811 (local), £37,544 (South West), £39,125 (Great Britain)
- Employment rate: 83.1% (local)
- Unemployment rate: 2.6% (local)
- Key employment sectors: Military and defence, healthcare, heritage tourism, agriculture, professional services
Source: ONS Census 2021, Nomis Labour Market Profile (ASHE 2025)
Regeneration and Investment in Salisbury
Public investment in Salisbury is concentrated on flood resilience and city centre modernisation. Three projects totalling over £45 million are either complete or underway.
- Salisbury River Park (Phase 1 complete, £27 million+): A joint project between the Environment Agency and Wiltshire Council, this scheme reduced flood risk to over 350 homes and businesses while creating 13 hectares of public open space through the city centre. Phase 1 completed in late 2024 with further phases planned as funding becomes available. Details at GOV.UK.
- Future High Streets Fund (Underway, £9.4 million): Salisbury received £9,355,731 from the government's Future High Streets Fund to transform the station forecourt and improve Fisherton Street, the main pedestrian route from the railway station to the city centre. The Fisherton Gateway scheme is complete, with Fisherton Street improvements continuing. Details at John Glen MP.
- Wilton Gate Housing (Under construction, 640 homes): Vistry Group and Aster Group are delivering 640 new homes off Netherhampton Road, including 148 affordable homes. The development includes a new primary school, 21 hectares of public open space, and over £14.5 million in community contributions towards education and healthcare. Details at Aster Group.

Salisbury Property Market Analysis
When was the last house price crash in Salisbury?
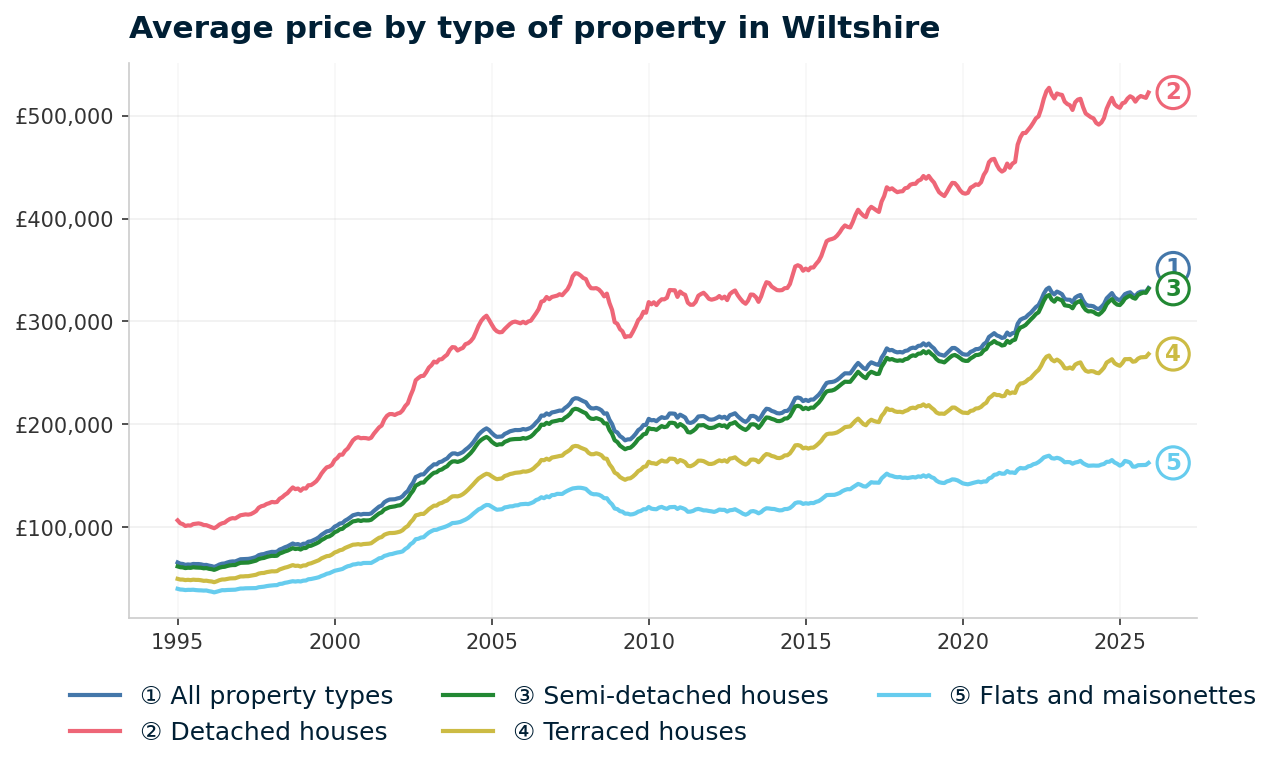
Salisbury sits within the Wiltshire unitary authority, so all sold property prices from HM Land Registry are available at this level. House prices in Wiltshire have risen 405.3% since January 1995, from £65,798 to £332,483.
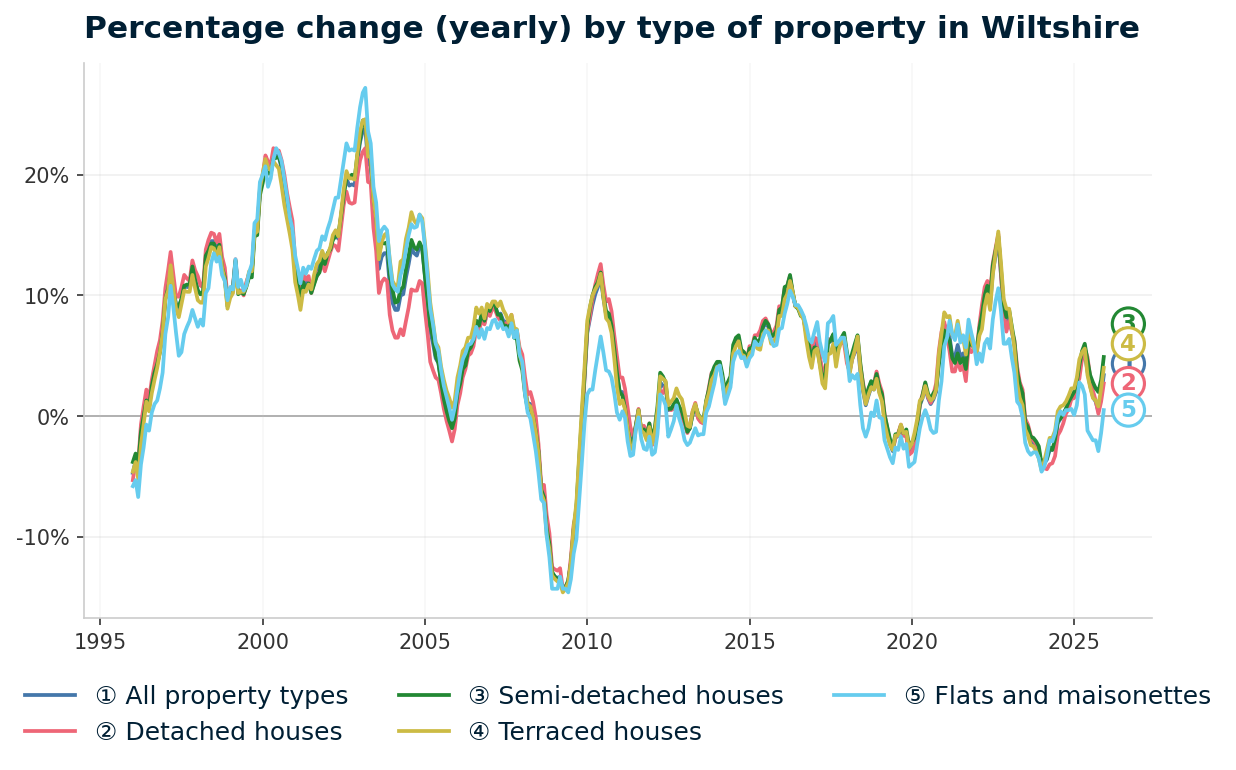
Wiltshire house prices peaked at £225,427 in September 2007 before falling 18.2% to a trough of £184,443 by April 2009. That decline matched the England average of 18.2% exactly, while the South West region fell slightly further at 19.4%. The worst annual change reading hit -14.4% in April 2009.
The crash played out evenly across property types in Wiltshire. The worst annual change readings in April 2009 were -14.3% for detached houses, -14.3% for semi-detached houses, -14.6% for terraced houses, and -14.3% for flats. There was no single property type that bore the brunt of the correction.
Here is how Wiltshire house prices have moved through each market cycle since 1995:
- 1995-2007 (The Boom): Prices started at £65,798 in January 1995 and rose to the September 2007 peak of £225,427. That is a 242.6% increase over 12 years, driven by low interest rates, expanding mortgage availability, and Wiltshire's appeal as a commuter belt for Bath, Bristol, and London via the railway.
- 2008-2009 (The Financial Crisis): Prices fell 18.2% from peak to trough. The worst annual change of -14.4% was recorded in April 2009. England declined by the same 18.2%, while the South West fell 19.4%. Wiltshire tracked the national correction with no local amplification or cushion.
- 2010-2013 (Stagnation): Prices stabilised around £206,000 by December 2010 and moved sideways. The recovery was slow, with Wiltshire's mix of rural property and military housing limiting speculative activity.
- 2014-2016 (Recovery): Prices passed the pre-crash peak in October 2014 at £226,070, meaning the recovery took roughly 5 years from the trough. By December 2015, prices had reached £241,747.
- 2017-2019 (Steady growth): Consistent gains driven by continued London outmigration and the completion of Army Basing Programme housing around Salisbury Plain.
- 2020-2022 (Pandemic surge): Prices accelerated from £267,763 in March 2020 to £326,278 by December 2022. That is a 21.9% increase in under three years, fuelled by the stamp duty holiday and the "race for space" into rural and semi-rural Wiltshire.
- 2023 (Rate shock): Prices pulled back to £316,658 by December 2023, a 2.9% correction from the 2022 peak as higher mortgage rates cooled demand.
- 2024-2025 (Current): Prices recovered to £332,483 by December 2025, up 3.4% year-on-year from £321,660 in December 2024. Wiltshire has pushed through to new highs.
Long-term growth summary:
- 5 years (2020-2025): 16.0% growth (£286,661 to £332,483)
- 10 years (2015-2025): 37.5% growth (£241,747 to £332,483)
- 15 years (2010-2025): 61.1% growth (£206,402 to £332,483)
- 20 years (2005-2025): 70.9% growth (£194,535 to £332,483)
- 30 years (1995-2025): 405.3% growth (£65,798 to £332,483)
The 2008-2009 correction followed a 12-year boom that saw Wiltshire prices triple. The current market sits at £332,483 after a brief 2023 pause, with annual growth of 3.4%. Today's lending standards are stricter than the pre-2007 era, and the stamp duty surcharge on second homes adds a cost for buy-to-let investors that did not exist during the boom.
Source: HM Land Registry House Price Index for Wiltshire, January 1995 to December 2025.
Thinking of Buying?
We have off-market investment properties averaging 8%+ annual yield.
View Property DealsSold House Prices in Salisbury
The average sold price in Wiltshire reached £332,483 in December 2025, sitting 13.9% above the England average of £291,865. This positions Salisbury's local authority as a premium market by national standards. The South West regional average is £301,226, placing Wiltshire 10.4% above its own region.
The picture changes sharply by property type. Flats in Wiltshire average £162,523, which is 25.9% below the England average of £219,340. This is the only property type where Wiltshire undercuts the national figure, and it reflects the limited flat stock in a predominantly rural local authority. Detached houses, by contrast, command a 10.8% premium over England.
| Property Type | Wiltshire Average | England Average | Difference |
|---|---|---|---|
| Detached houses | £522,427 | £471,667 | +10.8% |
| Semi-detached houses | £331,760 | £289,135 | +14.7% |
| Terraced houses | £268,349 | £244,830 | +9.6% |
| Flats and maisonettes | £162,523 | £219,340 | -25.9% |
| All property types | £332,483 | £291,865 | +13.9% |
Detached houses in Wiltshire average £522,427, a 10.8% premium over the England figure of £471,667. This reflects Wiltshire's housing mix: the rural postcodes (SP3, SP5) are dominated by larger detached properties on bigger plots, pushing the average up. Detached houses account for a larger share of transactions in Wiltshire than in most urban local authorities.
Semi-detached houses show the largest premium at 14.7%, averaging £331,760 against England's £289,135. This is the property type most commonly found in Salisbury city itself and the market towns. For buy-to-let investors, the semi-detached segment sits closest to the Wiltshire average and represents the typical stock available in SP1 and SP2.
Terraced houses at £268,349 sit 9.6% above England's £244,830. Terraced stock is concentrated in the city centre (SP1) and the older parts of Wilton and Amesbury. This is the most accessible house type for investors entering the Salisbury market. Investors looking for renovation property for sale may find older terraced houses in these areas.
Flats and maisonettes are the outlier at £162,523, sitting 25.9% below England's £219,340. Wiltshire has limited purpose-built flat stock compared to cities with university populations or large town centre developments. The low flat average makes this the one property type where Salisbury pricing works in an investor's favour against the national benchmark.
Property Data Sources
Our location guide relies on diverse, authoritative datasets including:
- HM Land Registry UK House Price Index
- Ministry of Housing, Communities and Local Government
- Ordnance Survey Data Hub
- Propertydata.co.uk
We update our property data quarterly to ensure accuracy. Last update: March 2026. All data is presented as provided by our sources without adjustments or amendments.
Price Per Square Foot in Salisbury
Sold prices per square foot across Salisbury's postcodes range from £329 in SP4 to £390 in SP5. The spread of £61 per square foot between cheapest and most expensive is relatively narrow. Unlike many locations where one postcode dominates, Salisbury's price-per-square-foot data is compressed, with most postcodes falling between £329 and £364.
| Rank | Area | Price per sq ft |
|---|---|---|
| 1 | SP4 (Amesbury, Durrington) | £329 |
| 2 | SP2 (Bemerton, Wilton) | £334 |
| 3 | SP1 (City Centre) | £354 |
| 4 | SP3 (Tisbury, Dinton) | £364 |
| 5 | SP5 (Downton, Alderbury) | £390 |
SP4 (Amesbury, Durrington) is the cheapest per square foot at £329, based on 506 transactions. This is the Salisbury Plain corridor, where newer military-related housing and the market town of Amesbury provide relatively uniform stock. SP2 follows closely at £334, making the western side of Salisbury and Wilton competitive on a per-square-foot basis.
SP5 (Downton, Alderbury) commands the highest price per square foot at £390. This rural postcode borders the New Forest and attracts premium pricing. The gap between SP5 and SP4 is £61 per square foot. On a typical 900 sq ft property, that translates to a £54,900 price difference driven purely by location rather than build quality.
For Sale Asking Prices in Salisbury
Asking prices provide a forward-looking view of where sellers and agents are pricing houses for sale in Salisbury. The mean asking price across all 5 Salisbury postcodes is £403,588. This is higher than the Land Registry sold price average of £332,483 because asking prices include currently listed stock, which skews towards the aspirational end of the market.
The two cheapest postcodes by asking price are SP2 (£331,928) and SP1 (£334,602). These are the urban postcodes closest to the city centre where buy-to-let properties are most commonly listed. SP5 at £542,293 is over £210,000 more expensive than SP2.
| Rank | Area | Asking Price |
|---|---|---|
| 1 | SP2 (Bemerton, Wilton) | £331,928 |
| 2 | SP1 (City Centre) | £334,602 |
| 3 | SP4 (Amesbury, Durrington) | £358,843 |
| 4 | SP3 (Tisbury, Dinton) | £450,273 |
| 5 | SP5 (Downton, Alderbury) | £542,293 |
SP2 and SP1 are separated by just £2,674 in asking price, forming a distinct affordable tier. Both postcodes sit below the Wiltshire sold price average of £332,483. SP4 at £358,843 occupies a middle ground, while SP3 and SP5 push into the £450,000-£542,000 range where yields compress and tenant pools narrow.
Investors looking for below market value properties in Salisbury are most likely to find them in SP1 and SP2, where asking prices are lowest and sales volumes are highest.

House Price Growth in Salisbury
Five-year growth across Salisbury's postcodes ranges from 2.4% in SP1 to 17.9% in SP2. That is a wide spread for neighbouring postcodes and reveals how differently parts of the same city have performed since 2021. SP2 has outpaced every other Salisbury postcode by a significant margin over the 5-year period.
| Area | 1 Year | 3 Years | 5 Years |
|---|---|---|---|
| SP2 (Bemerton, Wilton) | 3.3% | 2.5% | 17.9% |
| SP3 (Tisbury, Dinton) | -4.6% | -6.4% | 11.6% |
| SP4 (Amesbury, Durrington) | 2.8% | -0.4% | 11.1% |
| SP5 (Downton, Alderbury) | -4.6% | -8.6% | 7.2% |
| SP1 (City Centre) | 4.0% | -1.0% | 2.4% |
SP2 leads on 5-year growth at 17.9%, with 1-year growth of 3.3% and 3-year growth of 2.5%. It is the only Salisbury postcode showing positive figures across all three time periods. This is also the postcode with the highest sales volume (38 per month) and the highest yield (4.3%), making it the most active part of the Salisbury market.
SP3 and SP5 show negative 1-year and 3-year growth despite positive 5-year figures. Both rural postcodes returned -4.6% over the past year. Low transaction volumes in SP3 (9 sales per month) make growth figures more volatile. SP5's -8.6% over 3 years represents the largest correction in the Salisbury area, likely reflecting a pullback from pandemic-era premiums on rural properties.
SP1 posted the strongest 1-year growth at 4.0% but the weakest 5-year growth at just 2.4%. The city centre has recovered in the short term after a 3-year dip of -1.0%, but its 5-year performance trails every other postcode. City centre pricing tends to be more stable but with lower peaks and shallower troughs.
Monthly Property Sales in Salisbury
Combined monthly sales across all 5 Salisbury postcodes total 118 transactions per month. SP2 generates the highest volume at 38 sales per month, followed by SP1 and SP4 at 26 each. SP3 records just 9 sales per month, the lowest in the area.
| Area | Sales per Month | Turnover | Asking Price |
|---|---|---|---|
| SP2 (Bemerton, Wilton) | 38 | 27% | £331,928 |
| SP1 (City Centre) | 26 | 36% | £334,602 |
| SP4 (Amesbury, Durrington) | 26 | 41% | £358,843 |
| SP5 (Downton, Alderbury) | 19 | 32% | £542,293 |
| SP3 (Tisbury, Dinton) | 9 | 24% | £450,273 |
SP4 has the highest turnover rate at 41%, meaning properties in the Amesbury and Durrington area change hands more frequently. This is consistent with military housing patterns around Salisbury Plain, where service families rotate on posting cycles. For landlords, higher turnover can mean more frequent void periods but also a steady stream of incoming tenants.
SP3 records the lowest sales volume (9 per month) and the lowest turnover (24%). This is a rural postcode with a small housing stock. The combination of low volume and no rental data makes SP3 difficult to evaluate as a buy-to-let postcode from the available data alone.
Property Data Sources
Our location guide relies on diverse, authoritative datasets including:
- HM Land Registry UK House Price Index
- Ministry of Housing, Communities and Local Government
- Ordnance Survey Data Hub
- Propertydata.co.uk
We update our property data quarterly to ensure accuracy. Last update: March 2026. All data is presented as provided by our sources without adjustments or amendments.

Salisbury Rental Market Analysis
For investors weighing up whether rental property is a worthwhile investment in Salisbury, the data below breaks down average monthly rents and gross rental yields across the area's postcodes.
Four of Salisbury's 5 postcodes have sufficient rental data to calculate yields. SP3 (Tisbury, Dinton) has no rental data due to insufficient listings in this rural postcode. If you are looking to build a property portfolio in the South West, Salisbury's combination of military-driven demand and cathedral city employment provides a distinctive tenant base.
Average Rent & Gross Rental Yields in Salisbury
Gross rental yields in Salisbury range from 3.3% in SP5 to 4.3% in SP2. That 1-percentage-point spread is narrow compared to most locations on this site, and it reflects the premium pricing across all Salisbury postcodes. Higher property prices compress yields even where rents are above average.
SP5 records the highest rent at £1,509 per month but the lowest yield at 3.3%, because its asking price of £542,293 is the highest in the area. SP2 achieves the top yield by combining moderate rent (£1,183) with the lowest asking price (£331,928).
| Area | Average Monthly Rent | Asking Price | Gross Yield |
|---|---|---|---|
| SP2 (Bemerton, Wilton) | £1,183 | £331,928 | 4.3% |
| SP1 (City Centre) | £1,173 | £334,602 | 4.2% |
| SP4 (Amesbury, Durrington) | £1,261 | £358,843 | 4.2% |
| SP5 (Downton, Alderbury) | £1,509 | £542,293 | 3.3% |
| SP3 (Tisbury, Dinton) | Not enough data | £450,273 | Not enough data |
SP2 and SP1 are separated by just 0.1 percentage points in yield (4.3% vs 4.2%) and £10 per month in rent. These two postcodes cover the core of Salisbury city and the town of Wilton. They are effectively interchangeable on yield terms, with the decision between them coming down to property type and specific streets rather than postcode-level differences.
SP4 matches SP1 at 4.2% yield but achieves it with higher rent (£1,261) and a higher asking price (£358,843). The military presence around Amesbury and Durrington supports rental demand in this postcode, with service families and MOD contractors forming a significant part of the tenant pool.
SP5's 3.3% yield is the lowest in Salisbury and reflects the postcode's premium pricing. At £542,293, SP5's asking price is £210,365 more than SP2's. The rent of £1,509 is the highest in the area, but it does not close the gap created by the price premium. Investors in SP5 are paying for capital value in a New Forest-adjacent location rather than rental income.
Is Salisbury Rent High?
How much of a tenant's salary goes on rent in Salisbury? Rents across the area's postcodes consume between 37.2% and 47.9% of gross monthly income. The median gross weekly salary in Salisbury is £727.10, which equates to £3,151 per month or £37,811 per year. This is above the South West regional median of £722.00 per week and below the Great Britain median of £752.40 per week. Data from the Nomis Labour Market Profile (ASHE 2025).
SP1 and SP2 sit in the 37-38% range. SP5 pushes to 47.9%, which limits the tenant pool to higher earners or dual-income households.
| Rank | Area | Rent as % of Income |
|---|---|---|
| 1 | SP5 (Downton, Alderbury) | 47.9% |
| 2 | SP4 (Amesbury, Durrington) | 40.0% |
| 3 | SP2 (Bemerton, Wilton) | 37.5% |
| 4 | SP1 (City Centre) | 37.2% |
| - | SP3 (Tisbury, Dinton) | Not enough data |
SP1 and SP2 are the most affordable postcodes for tenants, with rents taking 37.2% and 37.5% of gross income respectively. These figures are above the traditional 30-35% affordability threshold but are comparable to many South West locations where rental demand outstrips supply.
SP5's rent-to-income ratio of 47.9% is the highest in the Salisbury area. At £1,509 per month against a local median monthly salary of £3,151, nearly half of gross income goes to rent. This ratio typically limits the tenant pool to higher earners or dual-income households.
Thinking of Buying?
We have off-market investment properties averaging 8%+ annual yield.
View Property DealsAre House Prices High? Price-to-Earnings Ratios
The England price-to-earnings benchmark sits at 7.5x (£291,865 divided by the Great Britain median salary of £39,125). Every Salisbury postcode exceeds this, with ratios ranging from 8.8x in SP1 and SP2 to 14.3x in SP5. This is based on the Nomis Labour Market Profile for Salisbury showing the median gross annual income for Salisbury residents is £37,811.
| Rank | Area | Price-to-Earnings Ratio |
|---|---|---|
| 1 | SP2 (Bemerton, Wilton) | 8.8x |
| 2 | SP1 (City Centre) | 8.8x |
| 3 | SP4 (Amesbury, Durrington) | 9.5x |
| 4 | SP3 (Tisbury, Dinton) | 11.9x |
| 5 | SP5 (Downton, Alderbury) | 14.3x |
SP2 and SP1 both sit at 8.8x earnings, the lowest ratios in Salisbury. These are the postcodes where property prices are most accessible relative to local salaries. At 8.8x, they still exceed the England benchmark of 7.5x, but the gap is smaller than in the rural postcodes.
SP5 at 14.3x is almost double the national benchmark. A property at SP5's average asking price of £542,293 would require nearly 14.5 years of gross salary. This level of price-to-earnings sits in the territory of prime commuter belt locations, where buyers are typically not dependent on local salaries alone. Investors exploring creative financing options can read our guide on how to buy a buy-to-let property with no deposit.
Deposit Requirements in Salisbury
An investor with £100,000 in capital can cover the 30% deposit on a property in SP2 (£99,578) or SP1 (£100,381). The same deposit falls £62,000 short of SP5's requirement of £162,688. That gap illustrates the two-tier pricing structure across Salisbury's postcodes.
These deposits are calculated at 30%, which is the standard requirement for most buy-to-let mortgages. Factor in buy-to-let costs including stamp duty, legal fees, and any refurbishment on top of the deposit figure.
| Rank | Area | 30% Deposit Required |
|---|---|---|
| 1 | SP2 (Bemerton, Wilton) | £99,578 |
| 2 | SP1 (City Centre) | £100,381 |
| 3 | SP4 (Amesbury, Durrington) | £107,653 |
| 4 | SP3 (Tisbury, Dinton) | £135,082 |
| 5 | SP5 (Downton, Alderbury) | £162,688 |
SP2 and SP1 require deposits under £101,000, forming the entry level for Salisbury buy-to-let. The £803 difference between the two deposits is marginal. SP4 at £107,653 is roughly £8,000 more, placing it in a similar bracket for investors with capital in the £100,000-£110,000 range.
SP5 requires a 30% deposit of £162,688. At this level, an investor could purchase two properties in some northern English cities for the same deposit outlay. The deposit requirement is a direct function of SP5's premium pricing, and it narrows the pool of investors who can enter this postcode. Investors looking for lower entry points may also consider repossessed houses for sale, which occasionally appear below the asking price averages shown above.
What the Salisbury Data Tells Buy-to-Let Investors
SP2 (Bemerton, Wilton) leads Salisbury on yield (4.3%), 5-year growth (17.9%), and sales volume (38 per month). It is the only postcode showing positive growth across all three time periods. A 30% deposit of £99,578 buys exposure to a postcode that also records the lowest asking price in the area. SP1 (City Centre) at 4.2% yield and SP4 (Amesbury, Durrington) at 4.2% yield are close alternatives with different tenant profiles. SP1 draws on hospital and city centre workers, while SP4's demand connects to the military presence across Salisbury Plain.
Growth data splits sharply between the urban and rural postcodes. SP1, SP2, and SP4 all show positive 1-year growth (2.8% to 4.0%). SP3 and SP5 both returned -4.6% over the past year. SP5 also shows the weakest 3-year figure at -8.6%, indicating that pandemic-era premiums on rural properties have corrected more in Wiltshire's premium postcodes than in its affordable ones.
SP3 (Tisbury, Dinton) has no rental data, low sales volume (9 per month), and negative recent growth. SP5 (Downton, Alderbury) returns a yield of 3.3% with negative 1-year and 3-year growth. Both postcodes are priced above £450,000. The data for these rural postcodes contrasts with the three urban postcodes where yields sit between 4.2% and 4.3%.
Salisbury falls within the Wiltshire Council area. Investors should check whether any selective licensing schemes apply to their target postcode. Wiltshire does not currently operate a borough-wide scheme, but individual licensing requirements can change. Investors considering Salisbury may also want to explore available investment properties and off-market properties in the area.
How Salisbury Compares
Salisbury's mean asking price of £403,588 places it between Exeter (£387,814) and Bath (£450,726) in the South West hierarchy. Among the five comparison locations below, Salisbury has the lowest top yield at 4.3%. Swindon and Bournemouth both sit below Salisbury on price while offering higher yields.
| Location | Mean Asking Price | Mean Monthly Rent | Top Gross Yield |
|---|---|---|---|
| Swindon | £332,719 | £1,145 | 5.3% |
| Bournemouth | £355,164 | £1,408 | 7.7% |
| Bristol | £372,904 | £1,777 | 8.2% |
| Exeter | £387,814 | £1,284 | 5.6% |
| Salisbury | £403,588 | £1,282 | 4.3% |
| Bath | £450,726 | £1,782 | 5.8% |
Salisbury's mean monthly rent of £1,282 is similar to Exeter's £1,284 but with a higher mean asking price. This combination produces the lowest top yield in the comparison table. Bristol and Bath generate higher rents (£1,777 and £1,782) alongside their higher asking prices, pushing their yields above Salisbury's. Bournemouth at £355,164 with a 7.7% top yield and Bristol at £372,904 with 8.2% both offer higher yields at lower prices than Salisbury.
Salisbury's buy-to-let profile differs from these comparison locations. It is a smaller market with lower sales volumes and a more constrained yield ceiling. Investors drawn to the area are typically factoring in the quality of the tenant base and the stability of military and public sector employment rather than headline yield figures. For a broader view of South West options, see our guide to the best buy-to-let locations across the UK. Investors comparing Wiltshire more broadly can read our Wiltshire buy-to-let guide.
Frequently Asked Questions
Is Salisbury a city?
Salisbury received city status in 2009. The city's population within the immediate urban area is significantly smaller than the 510,333 figure used in this guide, which covers the full Wiltshire unitary authority. Salisbury Cathedral, which dates to 1258, houses the best-preserved of the four surviving original copies of the Magna Carta. The city centre is compact enough that most amenities are within walking distance of the Cathedral Close.
Is Salisbury a nice place to live?
Salisbury's employment rate is 83.1%, above the Great Britain average, with unemployment at 2.6%. The city is surrounded by areas of outstanding natural beauty, with Cranborne Chase AONB to the south and the North Wessex Downs AONB to the north. Average asking prices range from £331,928 in SP2 to £542,293 in SP5, reflecting the split between the accessible city postcodes and the premium rural areas. The median annual salary is £37,811, above the South West regional median. Direct rail services connect Salisbury to London Waterloo in around 90 minutes.
What is the population of Salisbury?
510,333 at the 2021 Census, an increase of 39,352 (8.4%) from 470,981 in 2011. This figure covers the full Wiltshire unitary authority, including Salisbury city alongside all other settlements within the boundary such as Devizes, Trowbridge, and Chippenham. The city of Salisbury itself has a smaller population, but Land Registry and Nomis data is reported at the unitary authority level.
How does Salisbury compare to Swindon for buy-to-let?
Swindon's mean asking price is £332,719 with a top yield of 5.3%, compared to Salisbury's £403,588 and 4.3%. Salisbury's SP2 at £331,928 is priced similarly to Swindon's average, but Swindon's rental market is larger with more postcode-level diversity. Both locations sit within the Wiltshire area, but they serve different tenant demographics.
Are there new builds in Salisbury?
Wilton Gate, off Netherhampton Road in SP2, is delivering 640 new homes including 148 affordable units, a new primary school, and 21 hectares of open space. Persimmon Homes' St Peter's Place development on the eastern edge of the city also includes new houses for sale across a range of sizes. New build properties in Salisbury typically carry a premium over the existing stock averages shown in this guide. SP2's current mean asking price is £331,928 across all property types.
Does Salisbury have a university?
Salisbury does not have a full university campus. The University of Southampton has a small presence at Salisbury District Hospital for clinical placements, and Arts University Bournemouth is within commuting distance. The absence of a large student population means the rental market is driven by working professionals, military families, and public sector employees rather than the seasonal student cycle seen in university cities. For investors interested in student markets, see our guide to purpose-built student accommodation.