

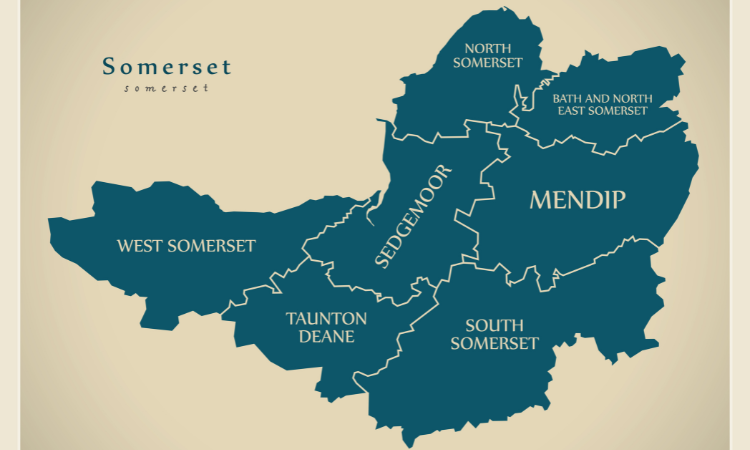
Somerset sits in the South West of England, a rural county running from the Bristol Channel coast at Weston-super-Mare across the Mendip and Quantock hills down to the Dorset and Devon borders. Its average sold home costs £278,634, which is 3.9% under the England average of £289,946. That is a shallower discount than most people expect from a farming-and-tourism county, and it hides a wide spread: gross rental yields reach 5.4% around Bridgwater while the honey-stone villages near Bath and the Bristol fringe run past £500,000.
The gap between where the yield is and where the price is defines Somerset for a landlord. The working towns on the M5 and the A303 give you the returns. The lifestyle postcodes give you the capital values and the scenery, and they cost you the yield to get them. A 30% deposit on the county average sold price comes to £83,590, and that single figure buys you a very different property in Bridgwater than it does in Wedmore.
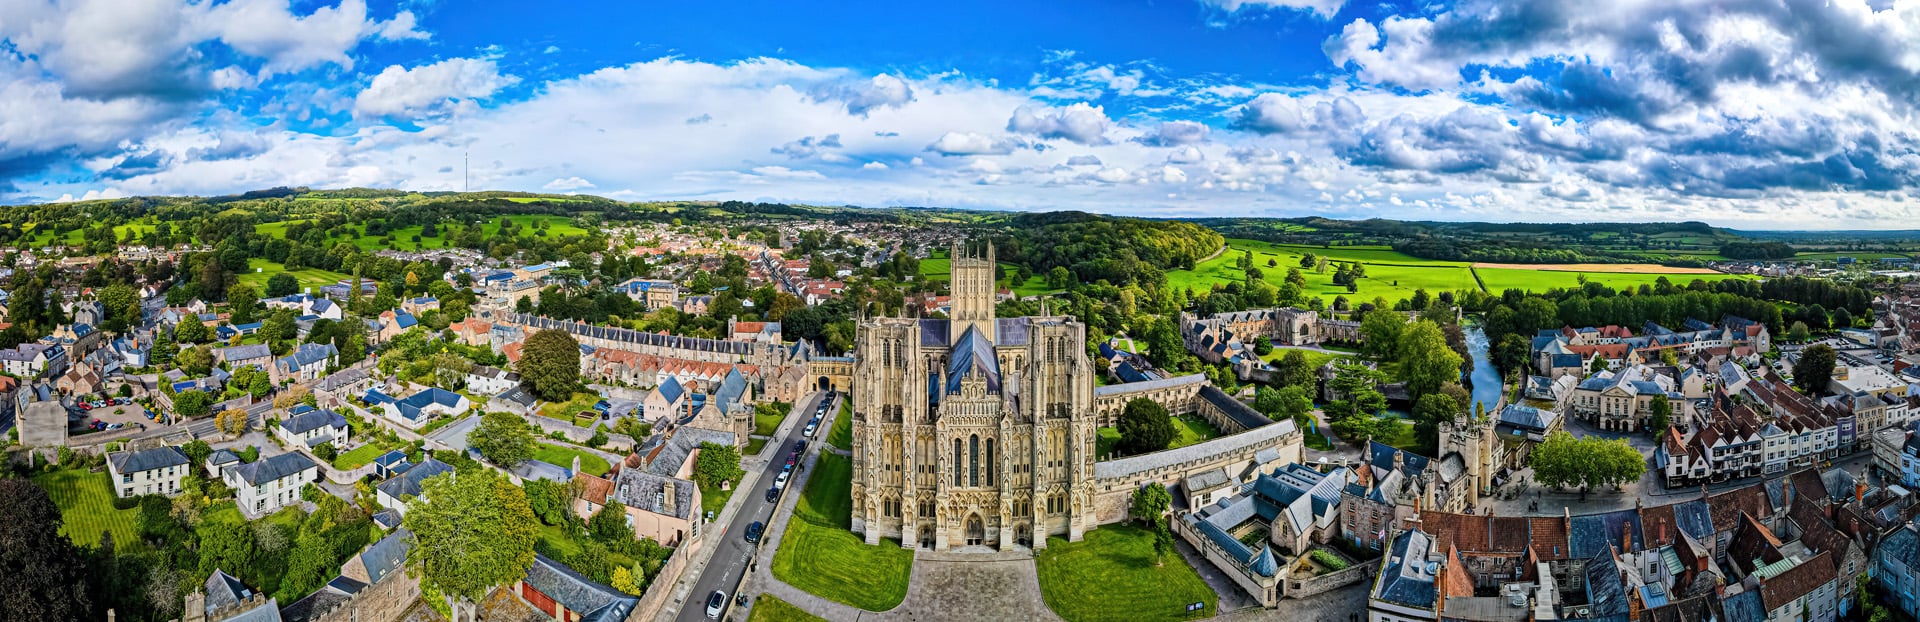
This guide pulls the county-level market data together and then routes you into the two Somerset town guides we hold in depth. Wells, England's smallest city, and Bath, the UNESCO World Heritage city on the county's north-eastern edge, each carry their own postcode analysis. Start with the town cards below, then read the county picture underneath them.
Article updated: July 2026
Explore Somerset town guides
Compare local yields and sold prices across Somerset's town guides before the county market analysis.

The Somerset property market
Somerset's price history from the HM Land Registry House Price Index runs monthly from January 1995 to March 2026. In that window the county has been through one deep crash, a recovery that dragged on for the best part of a decade, a pandemic-era surge, and a rate-driven wobble that it is still working through.
The starting figure in January 1995 was £51,663. Prices climbed steadily through the late nineties and then ran hard through the 2000s, topping out at £195,718 in September 2007. When the financial crisis hit, Somerset lost 17.5% of its value, bottoming out at £161,559 in May 2009. The worst single reading was an annual fall of 15.3% in that same month. Every property type dropped at roughly the same rate, so this was a market-wide repricing rather than one segment cracking.
What sets Somerset apart from the commuter counties is how long the climb back took. Prices did not clear the September 2007 peak again until September 2015, so a buyer at the top of the last cycle waited eight years just to be whole on paper. There is no London ripple pulling this market up quickly, and no single dominant employer to spark a fast rebound. The recovery was slow because the underlying economy is broad and steady rather than fast-moving.
Then the pandemic changed the pace. The space, the broadband upgrades and the relative affordability that had held Somerset back suddenly became the exact things relocating city buyers wanted. Prices jumped from £229,019 in March 2020 to an all-time high of £289,366 in November 2022. Higher interest rates cooled that off, and the county has drifted back to £278,634 as of March 2026, still 3.7% below its 2022 peak but 42.4% above the pre-crash high of 2007. Over the last five years the county is up 13.9%, and over the full thirty years it has risen 439.3%.
The property-type spread tells the affordability story in one line. A detached house in Somerset averages £452,948, while a flat averages £134,247. That is a 3.4-times gap between the top and bottom of the market, which is a wide stretch even by rural standards. The flat number is held down by how thin the apartment market is here. Somerset is a county of houses. What flats exist cluster in Taunton, Bridgwater and Weston-super-Mare, and demand for flat living outside those towns is limited, so the segment trades well below the national apartment average.
- All property types
- Detached
- Semi-detached
- Terraced
- Flats
Source: HM Land Registry House Price Index
| Year | All property types | Detached | Semi-detached | Terraced | Flats |
|---|---|---|---|---|---|
| 1995-01 | £51,663 | £86,127 | £50,549 | £40,873 | £31,467 |
| 1995-02 | £52,103 | £86,031 | £51,254 | £41,377 | £31,753 |
| 1995-03 | £52,226 | £85,879 | £51,432 | £41,594 | £31,823 |
| 1995-04 | £52,929 | £86,536 | £52,250 | £42,252 | £32,328 |
| 1995-05 | £53,155 | £87,006 | £52,458 | £42,399 | £32,466 |
| 1995-06 | £53,268 | £87,333 | £52,573 | £42,380 | £32,642 |
| 1995-07 | £52,740 | £86,887 | £52,003 | £41,891 | £32,097 |
| 1995-08 | £52,253 | £86,536 | £51,462 | £41,436 | £31,568 |
| 1995-09 | £52,235 | £86,797 | £51,407 | £41,401 | £31,333 |
| 1995-10 | £52,344 | £87,148 | £51,595 | £41,323 | £31,470 |
| 1995-11 | £52,152 | £86,746 | £51,456 | £41,094 | £31,556 |
| 1995-12 | £51,494 | £85,475 | £50,888 | £40,563 | £31,234 |
| 1996-01 | £50,856 | £84,327 | £50,263 | £40,129 | £30,759 |
| 1996-02 | £51,171 | £84,613 | £50,639 | £40,489 | £30,883 |
| 1996-03 | £51,145 | £84,868 | £50,639 | £40,398 | £30,644 |
| 1996-04 | £52,067 | £86,279 | £51,511 | £41,219 | £31,212 |
| 1996-05 | £51,971 | £86,280 | £51,310 | £41,167 | £31,065 |
| 1996-06 | £52,457 | £87,045 | £51,717 | £41,579 | £31,519 |
| 1996-07 | £52,661 | £87,614 | £52,007 | £41,619 | £31,426 |
| 1996-08 | £53,247 | £89,081 | £52,512 | £41,974 | £31,495 |
| 1996-09 | £53,602 | £89,975 | £52,806 | £42,213 | £31,479 |
| 1996-10 | £53,344 | £89,801 | £52,481 | £41,950 | £31,266 |
| 1996-11 | £53,463 | £89,817 | £52,682 | £42,027 | £31,480 |
| 1996-12 | £53,618 | £89,931 | £52,917 | £42,175 | £31,523 |
| 1997-01 | £54,051 | £90,504 | £53,321 | £42,644 | £31,687 |
| 1997-02 | £54,352 | £91,161 | £53,585 | £42,839 | £31,853 |
| 1997-03 | £55,333 | £92,805 | £54,439 | £43,672 | £32,481 |
| 1997-04 | £55,958 | £93,719 | £55,127 | £44,166 | £32,878 |
| 1997-05 | £56,460 | £94,346 | £55,729 | £44,651 | £32,973 |
| 1997-06 | £56,741 | £95,188 | £56,045 | £44,756 | £32,862 |
| 1997-07 | £57,223 | £96,331 | £56,465 | £45,104 | £32,878 |
| 1997-08 | £58,210 | £98,516 | £57,360 | £45,751 | £33,271 |
| 1997-09 | £58,656 | £99,346 | £57,841 | £46,074 | £33,408 |
| 1997-10 | £59,189 | £100,373 | £58,413 | £46,397 | £33,731 |
| 1997-11 | £59,194 | £100,326 | £58,449 | £46,399 | £33,750 |
| 1997-12 | £59,492 | £100,829 | £58,834 | £46,568 | £33,926 |
| 1998-01 | £60,031 | £101,912 | £59,270 | £47,004 | £34,160 |
| 1998-02 | £60,419 | £102,391 | £59,671 | £47,307 | £34,601 |
| 1998-03 | £60,910 | £103,063 | £60,108 | £47,793 | £34,908 |
| 1998-04 | £60,706 | £102,622 | £59,945 | £47,643 | £34,815 |
| 1998-05 | £61,380 | £103,777 | £60,549 | £48,286 | £34,972 |
| 1998-06 | £61,807 | £104,747 | £60,862 | £48,559 | £35,274 |
| 1998-07 | £62,993 | £106,852 | £62,037 | £49,477 | £35,846 |
| 1998-08 | £63,876 | £108,717 | £62,851 | £50,096 | £36,172 |
| 1998-09 | £64,182 | £109,460 | £63,123 | £50,306 | £36,177 |
| 1998-10 | £63,885 | £108,870 | £62,858 | £50,033 | £36,197 |
| 1998-11 | £63,574 | £108,563 | £62,592 | £49,602 | £36,184 |
| 1998-12 | £63,639 | £108,511 | £62,747 | £49,608 | £36,393 |
| 1999-01 | £63,752 | £108,810 | £62,850 | £49,657 | £36,441 |
| 1999-02 | £64,276 | £109,448 | £63,426 | £50,122 | £36,815 |
| 1999-03 | £64,399 | £109,563 | £63,549 | £50,239 | £36,958 |
| 1999-04 | £65,096 | £110,389 | £64,221 | £50,944 | £37,395 |
| 1999-05 | £65,400 | £110,688 | £64,487 | £51,328 | £37,476 |
| 1999-06 | £66,773 | £113,008 | £65,744 | £52,513 | £38,116 |
| 1999-07 | £68,191 | £115,996 | £66,965 | £53,533 | £38,710 |
| 1999-08 | £69,395 | £118,416 | £68,004 | £54,416 | £39,335 |
| 1999-09 | £70,969 | £121,722 | £69,422 | £55,449 | £40,225 |
| 1999-10 | £72,220 | £123,953 | £70,766 | £56,243 | £41,165 |
| 1999-11 | £72,966 | £125,068 | £71,576 | £56,807 | £41,734 |
| 1999-12 | £73,662 | £125,759 | £72,349 | £57,422 | £42,458 |
| 2000-01 | £74,352 | £127,123 | £72,993 | £57,960 | £42,648 |
| 2000-02 | £75,128 | £128,600 | £73,653 | £58,572 | £43,001 |
| 2000-03 | £75,887 | £130,101 | £74,491 | £59,119 | £43,050 |
| 2000-04 | £77,040 | £131,505 | £75,562 | £60,227 | £43,906 |
| 2000-05 | £79,390 | £135,442 | £77,979 | £61,988 | £45,348 |
| 2000-06 | £80,661 | £137,539 | £79,250 | £62,936 | £46,238 |
| 2000-07 | £81,979 | £140,738 | £80,621 | £63,595 | £46,756 |
| 2000-08 | £82,410 | £142,096 | £81,064 | £63,649 | £47,009 |
| 2000-09 | £83,651 | £145,130 | £82,087 | £64,341 | £47,726 |
| 2000-10 | £84,606 | £146,555 | £83,139 | £65,002 | £48,542 |
| 2000-11 | £84,752 | £147,028 | £83,198 | £65,033 | £48,730 |
| 2000-12 | £83,998 | £145,069 | £82,516 | £64,614 | £48,521 |
| 2001-01 | £83,020 | £143,281 | £81,408 | £63,961 | £48,044 |
| 2001-02 | £82,778 | £142,297 | £81,253 | £63,944 | £47,951 |
| 2001-03 | £84,183 | £144,746 | £82,736 | £64,979 | £48,680 |
| 2001-04 | £85,811 | £147,600 | £84,247 | £66,290 | £49,574 |
| 2001-05 | £88,020 | £151,260 | £86,369 | £68,062 | £50,914 |
| 2001-06 | £89,225 | £153,003 | £87,500 | £69,070 | £51,882 |
| 2001-07 | £90,850 | £155,796 | £89,183 | £70,281 | £52,785 |
| 2001-08 | £91,913 | £157,950 | £90,088 | £71,061 | £53,385 |
| 2001-09 | £92,881 | £160,457 | £90,843 | £71,650 | £53,754 |
| 2001-10 | £94,525 | £163,266 | £92,486 | £72,821 | £54,942 |
| 2001-11 | £96,148 | £165,958 | £94,292 | £73,878 | £56,156 |
| 2001-12 | £97,254 | £167,140 | £95,574 | £74,717 | £57,326 |
| 2002-01 | £96,799 | £166,361 | £95,134 | £74,311 | £57,201 |
| 2002-02 | £97,509 | £167,277 | £95,635 | £75,112 | £57,626 |
| 2002-03 | £99,273 | £169,804 | £97,439 | £76,696 | £58,498 |
| 2002-04 | £102,088 | £173,950 | £100,120 | £79,076 | £60,523 |
| 2002-05 | £104,442 | £177,406 | £102,655 | £80,955 | £62,009 |
| 2002-06 | £107,570 | £182,558 | £105,527 | £83,490 | £64,127 |
| 2002-07 | £110,869 | £188,476 | £108,768 | £86,056 | £65,697 |
| 2002-08 | £115,119 | £196,023 | £112,778 | £89,308 | £68,250 |
| 2002-09 | £117,778 | £201,215 | £115,551 | £91,086 | £69,509 |
| 2002-10 | £120,488 | £205,521 | £118,423 | £93,059 | £71,447 |
| 2002-11 | £122,208 | £208,703 | £120,069 | £94,221 | £72,720 |
| 2002-12 | £124,415 | £211,505 | £122,374 | £95,995 | £74,751 |
| 2003-01 | £125,985 | £214,002 | £123,613 | £97,439 | £75,812 |
| 2003-02 | £126,817 | £214,302 | £124,782 | £98,287 | £76,430 |
| 2003-03 | £128,873 | £217,568 | £126,792 | £100,028 | £77,527 |
| 2003-04 | £129,431 | £217,346 | £127,721 | £100,591 | £78,215 |
| 2003-05 | £131,935 | £221,024 | £130,310 | £102,745 | £79,575 |
| 2003-06 | £133,105 | £222,801 | £131,381 | £103,720 | £80,483 |
| 2003-07 | £135,857 | £227,305 | £134,267 | £105,870 | £81,940 |
| 2003-08 | £137,023 | £229,255 | £135,247 | £106,798 | £82,910 |
| 2003-09 | £138,601 | £231,615 | £136,907 | £108,208 | £83,511 |
| 2003-10 | £140,113 | £233,715 | £138,153 | £109,658 | £84,656 |
| 2003-11 | £141,367 | £235,423 | £139,527 | £110,715 | £85,426 |
| 2003-12 | £142,530 | £235,825 | £140,775 | £112,043 | £86,698 |
| 2004-01 | £144,656 | £239,008 | £142,962 | £113,804 | £87,996 |
| 2004-02 | £145,576 | £239,210 | £143,768 | £114,961 | £89,048 |
| 2004-03 | £148,829 | £244,286 | £146,712 | £117,650 | £91,314 |
| 2004-04 | £150,051 | £244,269 | £148,062 | £119,262 | £92,408 |
| 2004-05 | £154,199 | £249,584 | £152,210 | £123,090 | £95,136 |
| 2004-06 | £155,326 | £250,092 | £153,581 | £124,451 | £95,747 |
| 2004-07 | £159,574 | £257,058 | £157,936 | £127,743 | £98,259 |
| 2004-08 | £160,970 | £259,647 | £159,379 | £128,795 | £98,832 |
| 2004-09 | £163,816 | £265,120 | £162,110 | £130,756 | £100,524 |
| 2004-10 | £164,981 | £266,823 | £163,016 | £131,760 | £101,616 |
| 2004-11 | £165,940 | £267,826 | £163,719 | £132,602 | £102,943 |
| 2004-12 | £164,729 | £264,037 | £162,368 | £132,267 | £102,872 |
| 2005-01 | £163,228 | £260,891 | £160,493 | £131,339 | £102,654 |
| 2005-02 | £162,911 | £259,642 | £160,289 | £131,267 | £102,585 |
| 2005-03 | £164,466 | £261,980 | £161,878 | £132,570 | £103,438 |
| 2005-04 | £164,653 | £260,863 | £162,386 | £133,175 | £103,339 |
| 2005-05 | £164,754 | £261,036 | £162,247 | £133,324 | £103,587 |
| 2005-06 | £165,267 | £260,840 | £162,719 | £134,077 | £104,105 |
| 2005-07 | £166,730 | £263,614 | £164,153 | £135,212 | £104,746 |
| 2005-08 | £168,358 | £266,383 | £165,551 | £136,788 | £105,350 |
| 2005-09 | £167,993 | £266,451 | £164,966 | £136,413 | £105,046 |
| 2005-10 | £167,850 | £265,974 | £164,518 | £136,461 | £105,262 |
| 2005-11 | £166,468 | £263,002 | £163,316 | £135,344 | £104,838 |
| 2005-12 | £166,641 | £262,394 | £163,327 | £135,749 | £105,374 |
| 2006-01 | £165,805 | £261,109 | £162,481 | £135,133 | £104,719 |
| 2006-02 | £166,201 | £261,278 | £162,723 | £135,619 | £105,155 |
| 2006-03 | £166,283 | £261,764 | £162,925 | £135,594 | £104,877 |
| 2006-04 | £167,931 | £263,857 | £164,676 | £137,022 | £105,990 |
| 2006-05 | £170,499 | £267,903 | £167,265 | £139,192 | £107,373 |
| 2006-06 | £172,993 | £271,305 | £169,839 | £141,389 | £108,896 |
| 2006-07 | £175,709 | £275,548 | £172,329 | £143,930 | £110,245 |
| 2006-08 | £178,898 | £281,196 | £175,488 | £146,591 | £111,613 |
| 2006-09 | £180,349 | £284,508 | £176,946 | £147,674 | £111,869 |
| 2006-10 | £181,788 | £286,937 | £178,270 | £148,633 | £113,146 |
| 2006-11 | £181,666 | £286,488 | £178,248 | £148,581 | £113,063 |
| 2006-12 | £182,667 | £286,826 | £179,010 | £149,710 | £114,351 |
| 2007-01 | £183,254 | £287,730 | £179,638 | £150,286 | £114,494 |
| 2007-02 | £183,268 | £287,113 | £179,474 | £150,358 | £115,068 |
| 2007-03 | £185,878 | £291,172 | £182,132 | £152,644 | £116,385 |
| 2007-04 | £187,176 | £292,759 | £183,346 | £154,105 | £116,960 |
| 2007-05 | £190,332 | £297,088 | £186,282 | £156,937 | £119,183 |
| 2007-06 | £190,595 | £297,571 | £186,324 | £157,197 | £119,447 |
| 2007-07 | £193,039 | £302,085 | £188,615 | £158,954 | £120,975 |
| 2007-08 | £194,517 | £305,935 | £190,105 | £160,230 | £120,606 |
| 2007-09 | £195,718 | £309,020 | £191,261 | £160,912 | £120,969 |
| 2007-10 | £194,887 | £307,472 | £190,257 | £160,296 | £120,725 |
| 2007-11 | £195,312 | £308,256 | £190,465 | £160,310 | £121,654 |
| 2007-12 | £194,334 | £306,438 | £189,325 | £159,444 | £121,547 |
| 2008-01 | £195,507 | £308,865 | £190,364 | £160,087 | £122,472 |
| 2008-02 | £191,264 | £301,771 | £186,304 | £156,621 | £120,023 |
| 2008-03 | £190,988 | £300,827 | £186,432 | £156,713 | £119,277 |
| 2008-04 | £189,042 | £297,271 | £184,677 | £155,424 | £117,772 |
| 2008-05 | £190,796 | £299,392 | £186,671 | £157,248 | £118,412 |
| 2008-06 | £189,450 | £297,646 | £185,206 | £155,925 | £117,812 |
| 2008-07 | £186,014 | £292,623 | £182,194 | £152,924 | £115,261 |
| 2008-08 | £183,408 | £289,780 | £179,363 | £150,281 | £113,778 |
| 2008-09 | £179,559 | £285,148 | £175,440 | £146,828 | £110,884 |
| 2008-10 | £177,123 | £281,403 | £172,882 | £144,708 | £109,701 |
| 2008-11 | £173,568 | £275,326 | £169,585 | £141,818 | £107,640 |
| 2008-12 | £168,566 | £265,987 | £164,813 | £138,245 | £104,684 |
| 2009-01 | £165,852 | £262,346 | £161,949 | £135,805 | £103,078 |
| 2009-02 | £163,367 | £258,864 | £159,385 | £133,650 | £101,563 |
| 2009-03 | £164,247 | £261,045 | £160,137 | £133,920 | £102,358 |
| 2009-04 | £161,644 | £255,652 | £157,927 | £132,328 | £100,532 |
| 2009-05 | £161,559 | £255,296 | £158,115 | £132,612 | £99,548 |
| 2009-06 | £162,336 | £256,194 | £159,072 | £133,654 | £99,235 |
| 2009-07 | £165,653 | £262,550 | £162,379 | £136,277 | £100,100 |
| 2009-08 | £168,195 | £266,950 | £165,002 | £138,444 | £100,853 |
| 2009-09 | £170,457 | £271,114 | £167,280 | £140,210 | £101,665 |
| 2009-10 | £172,349 | £274,171 | £169,227 | £141,808 | £102,515 |
| 2009-11 | £172,215 | £274,534 | £168,572 | £141,747 | £102,497 |
| 2009-12 | £172,494 | £273,948 | £169,003 | £142,364 | £102,789 |
| 2010-01 | £173,447 | £276,236 | £169,975 | £143,211 | £102,325 |
| 2010-02 | £174,223 | £277,822 | £171,493 | £143,579 | £101,814 |
| 2010-03 | £174,146 | £278,950 | £171,318 | £143,177 | £101,215 |
| 2010-04 | £173,744 | £277,947 | £171,079 | £142,778 | £101,303 |
| 2010-05 | £174,303 | £278,726 | £171,335 | £143,406 | £101,832 |
| 2010-06 | £175,911 | £281,008 | £173,117 | £144,938 | £102,391 |
| 2010-07 | £176,246 | £282,544 | £173,329 | £145,120 | £101,827 |
| 2010-08 | £177,560 | £285,316 | £175,093 | £145,941 | £101,712 |
| 2010-09 | £177,473 | £286,453 | £174,952 | £145,513 | £101,021 |
| 2010-10 | £177,764 | £286,834 | £175,358 | £145,583 | £101,455 |
| 2010-11 | £176,918 | £285,777 | £174,112 | £144,773 | £101,437 |
| 2010-12 | £176,593 | £284,777 | £173,863 | £144,589 | £101,518 |
| 2011-01 | £175,337 | £283,237 | £172,400 | £143,524 | £100,646 |
| 2011-02 | £173,396 | £279,980 | £170,294 | £142,032 | £99,778 |
| 2011-03 | £171,662 | £278,093 | £168,166 | £140,454 | £98,716 |
| 2011-04 | £172,226 | £278,594 | £168,690 | £140,990 | £99,369 |
| 2011-05 | £173,290 | £279,881 | £169,933 | £141,892 | £100,085 |
| 2011-06 | £173,488 | £279,445 | £170,648 | £141,973 | £100,379 |
| 2011-07 | £174,533 | £280,648 | £171,708 | £142,936 | £101,232 |
| 2011-08 | £175,701 | £283,155 | £173,129 | £143,901 | £100,792 |
| 2011-09 | £175,176 | £283,295 | £172,479 | £143,373 | £99,834 |
| 2011-10 | £173,646 | £281,901 | £171,241 | £141,752 | £98,148 |
| 2011-11 | £173,350 | £281,478 | £170,837 | £141,232 | £98,673 |
| 2011-12 | £172,820 | £280,192 | £170,441 | £140,723 | £98,793 |
| 2012-01 | £171,190 | £277,554 | £168,906 | £139,366 | £97,803 |
| 2012-02 | £168,210 | £272,555 | £165,934 | £137,281 | £95,636 |
| 2012-03 | £168,625 | £272,162 | £166,502 | £138,125 | £95,860 |
| 2012-04 | £170,007 | £274,096 | £167,789 | £139,368 | £96,888 |
| 2012-05 | £170,849 | £275,034 | £168,828 | £140,054 | £97,561 |
| 2012-06 | £171,534 | £276,806 | £169,263 | £140,612 | £97,514 |
| 2012-07 | £172,115 | £277,761 | £169,681 | £141,250 | £97,702 |
| 2012-08 | £173,366 | £279,895 | £170,878 | £142,581 | £97,628 |
| 2012-09 | £174,871 | £282,586 | £172,386 | £143,728 | £98,322 |
| 2012-10 | £175,714 | £283,880 | £173,387 | £144,409 | £98,629 |
| 2012-11 | £175,042 | £282,851 | £172,661 | £143,745 | £98,536 |
| 2012-12 | £172,495 | £278,900 | £170,180 | £141,695 | £96,755 |
| 2013-01 | £171,417 | £277,015 | £169,436 | £140,773 | £95,896 |
| 2013-02 | £171,776 | £277,577 | £169,776 | £141,063 | £96,129 |
| 2013-03 | £173,108 | £279,540 | £171,151 | £142,083 | £97,155 |
| 2013-04 | £173,688 | £280,553 | £171,409 | £142,692 | £97,572 |
| 2013-05 | £173,795 | £280,341 | £171,570 | £142,849 | £97,847 |
| 2013-06 | £174,045 | £280,470 | £171,934 | £143,234 | £97,723 |
| 2013-07 | £174,835 | £281,339 | £172,764 | £144,094 | £98,094 |
| 2013-08 | £176,418 | £284,504 | £174,400 | £145,277 | £98,406 |
| 2013-09 | £177,478 | £286,800 | £175,255 | £146,020 | £98,899 |
| 2013-10 | £177,634 | £287,989 | £175,497 | £145,808 | £98,521 |
| 2013-11 | £177,484 | £287,673 | £175,480 | £145,601 | £98,515 |
| 2013-12 | £178,111 | £288,049 | £176,416 | £146,065 | £99,249 |
| 2014-01 | £177,822 | £287,307 | £175,996 | £145,843 | £99,578 |
| 2014-02 | £178,062 | £288,161 | £176,115 | £145,946 | £99,636 |
| 2014-03 | £178,426 | £288,969 | £176,554 | £146,244 | £99,497 |
| 2014-04 | £181,067 | £293,010 | £179,291 | £148,596 | £100,691 |
| 2014-05 | £182,317 | £294,393 | £180,546 | £149,908 | £101,437 |
| 2014-06 | £183,909 | £296,970 | £182,158 | £151,239 | £102,234 |
| 2014-07 | £184,961 | £298,627 | £183,367 | £152,194 | £102,490 |
| 2014-08 | £187,302 | £302,930 | £185,683 | £154,020 | £103,487 |
| 2014-09 | £188,515 | £305,000 | £186,715 | £155,108 | £104,101 |
| 2014-10 | £187,764 | £303,918 | £185,796 | £154,292 | £104,139 |
| 2014-11 | £186,172 | £301,352 | £184,363 | £152,847 | £103,321 |
| 2014-12 | £185,134 | £299,974 | £183,397 | £151,704 | £102,921 |
| 2015-01 | £186,565 | £302,438 | £184,923 | £152,773 | £103,637 |
| 2015-02 | £187,113 | £303,451 | £185,377 | £153,122 | £104,107 |
| 2015-03 | £187,478 | £304,475 | £185,814 | £153,168 | £104,277 |
| 2015-04 | £187,009 | £303,983 | £185,329 | £152,764 | £103,802 |
| 2015-05 | £188,678 | £306,525 | £187,152 | £154,105 | £104,718 |
| 2015-06 | £190,669 | £309,199 | £189,339 | £156,068 | £105,429 |
| 2015-07 | £192,408 | £311,942 | £191,301 | £157,476 | £106,177 |
| 2015-08 | £194,914 | £316,361 | £193,772 | £159,563 | £107,145 |
| 2015-09 | £196,132 | £319,422 | £194,649 | £160,213 | £107,855 |
| 2015-10 | £196,081 | £319,344 | £194,576 | £160,201 | £107,794 |
| 2015-11 | £195,743 | £319,048 | £194,373 | £159,712 | £107,589 |
| 2015-12 | £196,209 | £319,863 | £195,027 | £160,019 | £107,668 |
| 2016-01 | £197,938 | £322,981 | £197,072 | £161,170 | £108,379 |
| 2016-02 | £198,922 | £324,606 | £197,677 | £161,999 | £109,362 |
| 2016-03 | £199,533 | £325,646 | £197,902 | £162,491 | £110,201 |
| 2016-04 | £200,765 | £327,282 | £198,670 | £163,865 | £111,152 |
| 2016-05 | £200,365 | £325,371 | £198,519 | £163,966 | £111,038 |
| 2016-06 | £202,312 | £328,106 | £200,688 | £165,832 | £111,667 |
| 2016-07 | £202,922 | £329,039 | £201,471 | £166,293 | £111,896 |
| 2016-08 | £205,744 | £334,183 | £204,218 | £168,445 | £113,256 |
| 2016-09 | £206,311 | £335,163 | £205,014 | £168,676 | £113,653 |
| 2016-10 | £207,075 | £337,133 | £205,796 | £168,691 | £114,518 |
| 2016-11 | £207,271 | £338,767 | £206,131 | £168,089 | £114,614 |
| 2016-12 | £207,151 | £338,934 | £205,784 | £167,859 | £114,762 |
| 2017-01 | £208,720 | £341,817 | £207,282 | £169,198 | £115,251 |
| 2017-02 | £208,174 | £340,269 | £206,282 | £168,998 | £115,712 |
| 2017-03 | £209,697 | £343,219 | £207,794 | £169,937 | £116,681 |
| 2017-04 | £210,363 | £344,158 | £208,266 | £170,416 | £117,566 |
| 2017-05 | £212,396 | £346,747 | £210,762 | £172,085 | £118,738 |
| 2017-06 | £213,845 | £348,183 | £212,100 | £173,667 | £119,757 |
| 2017-07 | £215,059 | £349,545 | £213,649 | £174,690 | £120,504 |
| 2017-08 | £217,058 | £353,333 | £215,221 | £176,533 | £121,202 |
| 2017-09 | £218,088 | £355,714 | £216,267 | £177,156 | £121,492 |
| 2017-10 | £219,439 | £358,517 | £217,704 | £178,219 | £121,604 |
| 2017-11 | £220,611 | £360,593 | £219,285 | £178,898 | £122,092 |
| 2017-12 | £220,672 | £360,353 | £219,726 | £178,962 | £121,924 |
| 2018-01 | £220,205 | £359,540 | £219,422 | £178,500 | £121,670 |
| 2018-02 | £220,745 | £360,956 | £219,996 | £178,923 | £121,441 |
| 2018-03 | £220,423 | £360,554 | £219,736 | £178,819 | £120,774 |
| 2018-04 | £221,742 | £362,601 | £220,982 | £180,252 | £120,983 |
| 2018-05 | £220,827 | £361,121 | £220,207 | £179,714 | £119,876 |
| 2018-06 | £222,448 | £363,564 | £222,146 | £180,886 | £120,822 |
| 2018-07 | £223,448 | £365,897 | £223,058 | £181,492 | £121,183 |
| 2018-08 | £226,113 | £369,745 | £225,910 | £183,809 | £122,594 |
| 2018-09 | £227,179 | £372,219 | £226,911 | £184,605 | £122,661 |
| 2018-10 | £227,206 | £372,041 | £227,226 | £184,506 | £122,744 |
| 2018-11 | £226,787 | £372,173 | £226,734 | £183,907 | £122,302 |
| 2018-12 | £226,883 | £372,075 | £226,856 | £183,875 | £122,794 |
| 2019-01 | £225,510 | £370,279 | £225,468 | £182,584 | £121,965 |
| 2019-02 | £225,228 | £369,974 | £225,316 | £182,145 | £121,907 |
| 2019-03 | £222,830 | £366,258 | £223,099 | £180,277 | £120,024 |
| 2019-04 | £223,363 | £366,463 | £223,669 | £181,187 | £120,063 |
| 2019-05 | £222,360 | £364,009 | £222,743 | £180,882 | £119,305 |
| 2019-06 | £225,071 | £368,067 | £225,239 | £183,373 | £120,908 |
| 2019-07 | £226,649 | £370,299 | £226,760 | £184,802 | £121,926 |
| 2019-08 | £229,082 | £375,149 | £228,949 | £186,716 | £122,811 |
| 2019-09 | £229,790 | £376,284 | £229,433 | £187,448 | £123,230 |
| 2019-10 | £229,575 | £375,968 | £229,612 | £187,082 | £122,907 |
| 2019-11 | £228,812 | £374,515 | £229,282 | £186,159 | £122,678 |
| 2019-12 | £227,897 | £372,831 | £228,696 | £185,333 | £122,081 |
| 2020-01 | £228,956 | £374,752 | £229,889 | £186,282 | £122,135 |
| 2020-02 | £228,686 | £374,262 | £229,615 | £186,282 | £121,669 |
| 2020-03 | £229,019 | £375,234 | £230,179 | £186,458 | £121,308 |
| 2020-04 | £227,288 | £372,868 | £228,223 | £185,264 | £119,827 |
| 2020-05 | £226,893 | £371,831 | £228,162 | £184,855 | £119,710 |
| 2020-06 | £227,130 | £371,515 | £228,706 | £185,315 | £119,625 |
| 2020-07 | £229,548 | £375,211 | £231,162 | £187,191 | £121,299 |
| 2020-08 | £231,307 | £378,826 | £233,040 | £188,842 | £120,971 |
| 2020-09 | £235,492 | £387,061 | £237,026 | £192,114 | £122,379 |
| 2020-10 | £237,833 | £391,990 | £239,236 | £194,026 | £122,742 |
| 2020-11 | £240,011 | £395,748 | £240,927 | £195,925 | £124,140 |
| 2020-12 | £242,709 | £400,115 | £243,423 | £198,408 | £125,393 |
| 2021-01 | £244,069 | £400,014 | £244,962 | £199,930 | £127,412 |
| 2021-02 | £245,332 | £399,808 | £246,294 | £201,399 | £129,469 |
| 2021-03 | £244,614 | £396,049 | £245,574 | £201,309 | £130,820 |
| 2021-04 | £244,075 | £395,021 | £244,863 | £201,028 | £130,646 |
| 2021-05 | £244,307 | £395,538 | £245,039 | £201,277 | £130,578 |
| 2021-06 | £246,588 | £398,518 | £246,936 | £203,860 | £131,836 |
| 2021-07 | £245,441 | £396,223 | £246,321 | £202,749 | £131,263 |
| 2021-08 | £248,404 | £402,178 | £249,589 | £204,702 | £132,056 |
| 2021-09 | £251,533 | £407,986 | £253,215 | £206,751 | £133,176 |
| 2021-10 | £253,990 | £415,271 | £255,075 | £207,928 | £133,309 |
| 2021-11 | £257,053 | £421,075 | £258,144 | £210,180 | £134,540 |
| 2021-12 | £256,488 | £422,422 | £257,308 | £209,067 | £133,332 |
| 2022-01 | £261,678 | £429,780 | £263,019 | £213,769 | £135,715 |
| 2022-02 | £264,980 | £434,243 | £266,476 | £216,719 | £137,902 |
| 2022-03 | £267,394 | £438,106 | £269,490 | £218,531 | £138,738 |
| 2022-04 | £270,650 | £442,786 | £272,520 | £221,799 | £140,397 |
| 2022-05 | £272,508 | £445,880 | £274,455 | £223,654 | £140,535 |
| 2022-06 | £276,747 | £451,456 | £278,647 | £227,825 | £143,144 |
| 2022-07 | £281,436 | £458,538 | £283,842 | £231,893 | £145,162 |
| 2022-08 | £283,193 | £461,544 | £285,445 | £233,692 | £145,448 |
| 2022-09 | £286,908 | £468,631 | £289,185 | £236,667 | £146,271 |
| 2022-10 | £286,764 | £469,269 | £288,766 | £236,275 | £146,063 |
| 2022-11 | £289,366 | £473,993 | £291,372 | £238,153 | £147,362 |
| 2022-12 | £287,389 | £470,348 | £289,376 | £236,531 | £146,850 |
| 2023-01 | £285,584 | £467,728 | £288,061 | £234,695 | £145,478 |
| 2023-02 | £283,827 | £465,370 | £286,462 | £232,867 | £144,497 |
| 2023-03 | £281,214 | £462,527 | £284,419 | £229,697 | £142,599 |
| 2023-04 | £278,014 | £457,923 | £281,152 | £226,734 | £141,046 |
| 2023-05 | £275,362 | £452,276 | £278,735 | £224,721 | £140,109 |
| 2023-06 | £273,962 | £448,983 | £276,824 | £224,444 | £139,365 |
| 2023-07 | £276,158 | £451,949 | £279,136 | £226,781 | £140,065 |
| 2023-08 | £279,258 | £457,643 | £282,170 | £229,726 | £140,743 |
| 2023-09 | £281,113 | £460,601 | £284,256 | £231,362 | £141,363 |
| 2023-10 | £281,513 | £460,429 | £284,596 | £231,746 | £142,127 |
| 2023-11 | £276,694 | £453,051 | £280,008 | £227,174 | £139,906 |
| 2023-12 | £272,735 | £446,339 | £276,075 | £223,667 | £138,352 |
| 2024-01 | £270,283 | £442,547 | £273,547 | £221,767 | £136,843 |
| 2024-02 | £270,816 | £441,719 | £274,331 | £222,792 | £137,270 |
| 2024-03 | £269,551 | £439,614 | £273,002 | £221,700 | £136,830 |
| 2024-04 | £267,269 | £434,494 | £270,756 | £220,041 | £136,409 |
| 2024-05 | £264,236 | £429,175 | £267,532 | £217,613 | £135,238 |
| 2024-06 | £266,739 | £431,733 | £270,061 | £220,466 | £136,567 |
| 2024-07 | £270,737 | £438,226 | £274,182 | £224,225 | £137,832 |
| 2024-08 | £274,994 | £445,298 | £278,244 | £228,273 | £139,348 |
| 2024-09 | £275,745 | £448,103 | £279,393 | £228,441 | £138,692 |
| 2024-10 | £275,038 | £447,549 | £278,360 | £227,581 | £138,607 |
| 2024-11 | £274,058 | £446,300 | £277,956 | £226,325 | £137,852 |
| 2024-12 | £275,348 | £449,128 | £279,090 | £227,315 | £138,223 |
| 2025-01 | £274,452 | £448,232 | £278,810 | £226,465 | £136,795 |
| 2025-02 | £276,750 | £451,835 | £280,897 | £228,659 | £137,917 |
| 2025-03 | £276,609 | £447,908 | £280,833 | £229,518 | £139,397 |
| 2025-04 | £274,879 | £446,630 | £279,510 | £227,308 | £137,941 |
| 2025-05 | £272,937 | £444,557 | £277,867 | £225,451 | £136,078 |
| 2025-06 | £269,576 | £441,714 | £274,959 | £222,046 | £132,547 |
| 2025-07 | £273,674 | £446,312 | £279,088 | £226,620 | £134,573 |
| 2025-08 | £275,588 | £448,578 | £281,637 | £228,418 | £135,219 |
| 2025-09 | £281,153 | £457,975 | £287,503 | £233,207 | £137,222 |
| 2025-10 | £280,926 | £458,012 | £287,663 | £232,725 | £136,769 |
| 2025-11 | £280,303 | £456,855 | £286,876 | £232,482 | £136,358 |
| 2025-12 | £278,329 | £452,766 | £285,139 | £230,999 | £135,554 |
| 2026-01 | £279,210 | £453,314 | £286,091 | £232,316 | £135,799 |
| 2026-02 | £278,400 | £452,425 | £285,512 | £231,339 | £135,137 |
| 2026-03 | £278,634 | £452,948 | £286,142 | £231,776 | £134,247 |
- All property types
- Detached
- Semi-detached
- Terraced
- Flats
Source: HM Land Registry House Price Index
| Year | All property types | Detached | Semi-detached | Terraced | Flats |
|---|---|---|---|---|---|
| 1996-01 | -1.6% | -2.1% | -0.6% | -1.8% | -2.3% |
| 1996-02 | -1.8% | -1.6% | -1.2% | -2.1% | -2.7% |
| 1996-03 | -2.1% | -1.2% | -1.5% | -2.9% | -3.7% |
| 1996-04 | -1.6% | -0.3% | -1.4% | -2.4% | -3.5% |
| 1996-05 | -2.2% | -0.8% | -2.2% | -2.9% | -4.3% |
| 1996-06 | -1.5% | -0.3% | -1.6% | -1.9% | -3.4% |
| 1996-07 | -0.2% | +0.8% | 0.0% | -0.6% | -2.1% |
| 1996-08 | +1.9% | +2.9% | +2.0% | +1.3% | -0.2% |
| 1996-09 | +2.6% | +3.7% | +2.7% | +2.0% | +0.5% |
| 1996-10 | +1.9% | +3.0% | +1.7% | +1.5% | -0.7% |
| 1996-11 | +2.5% | +3.5% | +2.4% | +2.3% | -0.2% |
| 1996-12 | +4.1% | +5.2% | +4.0% | +4.0% | +0.9% |
| 1997-01 | +6.3% | +7.3% | +6.1% | +6.3% | +3.0% |
| 1997-02 | +6.2% | +7.7% | +5.8% | +5.8% | +3.1% |
| 1997-03 | +8.2% | +9.4% | +7.5% | +8.1% | +6.0% |
| 1997-04 | +7.5% | +8.6% | +7.0% | +7.2% | +5.3% |
| 1997-05 | +8.6% | +9.3% | +8.6% | +8.5% | +6.1% |
| 1997-06 | +8.2% | +9.4% | +8.4% | +7.6% | +4.3% |
| 1997-07 | +8.7% | +9.9% | +8.6% | +8.4% | +4.6% |
| 1997-08 | +9.3% | +10.6% | +9.2% | +9.0% | +5.6% |
| 1997-09 | +9.4% | +10.4% | +9.5% | +9.1% | +6.1% |
| 1997-10 | +11.0% | +11.8% | +11.3% | +10.6% | +7.9% |
| 1997-11 | +10.7% | +11.7% | +10.9% | +10.4% | +7.2% |
| 1997-12 | +11.0% | +12.1% | +11.2% | +10.4% | +7.6% |
| 1998-01 | +11.1% | +12.6% | +11.2% | +10.2% | +7.8% |
| 1998-02 | +11.2% | +12.3% | +11.4% | +10.4% | +8.6% |
| 1998-03 | +10.1% | +11.1% | +10.4% | +9.4% | +7.5% |
| 1998-04 | +8.5% | +9.5% | +8.7% | +7.9% | +5.9% |
| 1998-05 | +8.7% | +10.0% | +8.6% | +8.1% | +6.1% |
| 1998-06 | +8.9% | +10.0% | +8.6% | +8.5% | +7.3% |
| 1998-07 | +10.1% | +10.9% | +9.9% | +9.7% | +9.0% |
| 1998-08 | +9.7% | +10.4% | +9.6% | +9.5% | +8.7% |
| 1998-09 | +9.4% | +10.2% | +9.1% | +9.2% | +8.3% |
| 1998-10 | +7.9% | +8.5% | +7.6% | +7.8% | +7.3% |
| 1998-11 | +7.4% | +8.2% | +7.1% | +6.9% | +7.2% |
| 1998-12 | +7.0% | +7.6% | +6.7% | +6.5% | +7.3% |
| 1999-01 | +6.2% | +6.8% | +6.0% | +5.6% | +6.7% |
| 1999-02 | +6.4% | +6.9% | +6.3% | +6.0% | +6.4% |
| 1999-03 | +5.7% | +6.3% | +5.7% | +5.1% | +5.9% |
| 1999-04 | +7.2% | +7.6% | +7.1% | +6.9% | +7.4% |
| 1999-05 | +6.5% | +6.7% | +6.5% | +6.3% | +7.2% |
| 1999-06 | +8.0% | +7.9% | +8.0% | +8.1% | +8.1% |
| 1999-07 | +8.3% | +8.6% | +7.9% | +8.2% | +8.0% |
| 1999-08 | +8.6% | +8.9% | +8.2% | +8.6% | +8.7% |
| 1999-09 | +10.6% | +11.2% | +10.0% | +10.2% | +11.2% |
| 1999-10 | +13.0% | +13.9% | +12.6% | +12.4% | +13.7% |
| 1999-11 | +14.8% | +15.2% | +14.4% | +14.5% | +15.3% |
| 1999-12 | +15.7% | +15.9% | +15.3% | +15.8% | +16.7% |
| 2000-01 | +16.6% | +16.8% | +16.1% | +16.7% | +17.0% |
| 2000-02 | +16.9% | +17.5% | +16.1% | +16.9% | +16.8% |
| 2000-03 | +17.8% | +18.7% | +17.2% | +17.7% | +16.5% |
| 2000-04 | +18.3% | +19.1% | +17.7% | +18.2% | +17.4% |
| 2000-05 | +21.4% | +22.4% | +20.9% | +20.8% | +21.0% |
| 2000-06 | +20.8% | +21.7% | +20.5% | +19.8% | +21.3% |
| 2000-07 | +20.2% | +21.3% | +20.4% | +18.8% | +20.8% |
| 2000-08 | +18.8% | +20.0% | +19.2% | +17.0% | +19.5% |
| 2000-09 | +17.9% | +19.2% | +18.2% | +16.0% | +18.6% |
| 2000-10 | +17.2% | +18.2% | +17.5% | +15.6% | +17.9% |
| 2000-11 | +16.2% | +17.6% | +16.2% | +14.5% | +16.8% |
| 2000-12 | +14.0% | +15.4% | +14.1% | +12.5% | +14.3% |
| 2001-01 | +11.7% | +12.7% | +11.5% | +10.4% | +12.7% |
| 2001-02 | +10.2% | +10.7% | +10.3% | +9.2% | +11.5% |
| 2001-03 | +10.9% | +11.3% | +11.1% | +9.9% | +13.1% |
| 2001-04 | +11.4% | +12.2% | +11.5% | +10.1% | +12.9% |
| 2001-05 | +10.9% | +11.7% | +10.8% | +9.8% | +12.3% |
| 2001-06 | +10.6% | +11.2% | +10.4% | +9.7% | +12.2% |
| 2001-07 | +10.8% | +10.7% | +10.6% | +10.5% | +12.9% |
| 2001-08 | +11.5% | +11.2% | +11.1% | +11.6% | +13.6% |
| 2001-09 | +11.0% | +10.6% | +10.7% | +11.4% | +12.6% |
| 2001-10 | +11.7% | +11.4% | +11.2% | +12.0% | +13.2% |
| 2001-11 | +13.4% | +12.9% | +13.3% | +13.6% | +15.2% |
| 2001-12 | +15.8% | +15.2% | +15.8% | +15.6% | +18.1% |
| 2002-01 | +16.6% | +16.1% | +16.9% | +16.2% | +19.1% |
| 2002-02 | +17.8% | +17.6% | +17.7% | +17.5% | +20.2% |
| 2002-03 | +17.9% | +17.3% | +17.8% | +18.0% | +20.2% |
| 2002-04 | +19.0% | +17.9% | +18.8% | +19.3% | +22.1% |
| 2002-05 | +18.7% | +17.3% | +18.9% | +18.9% | +21.8% |
| 2002-06 | +20.6% | +19.3% | +20.6% | +20.9% | +23.6% |
| 2002-07 | +22.0% | +21.0% | +22.0% | +22.4% | +24.5% |
| 2002-08 | +25.2% | +24.1% | +25.2% | +25.7% | +27.8% |
| 2002-09 | +26.8% | +25.4% | +27.2% | +27.1% | +29.3% |
| 2002-10 | +27.5% | +25.9% | +28.0% | +27.8% | +30.0% |
| 2002-11 | +27.1% | +25.8% | +27.3% | +27.5% | +29.5% |
| 2002-12 | +27.9% | +26.5% | +28.0% | +28.5% | +30.4% |
| 2003-01 | +30.2% | +28.6% | +29.9% | +31.1% | +32.5% |
| 2003-02 | +30.1% | +28.1% | +30.5% | +30.9% | +32.6% |
| 2003-03 | +29.8% | +28.1% | +30.1% | +30.4% | +32.5% |
| 2003-04 | +26.8% | +24.9% | +27.6% | +27.2% | +29.2% |
| 2003-05 | +26.3% | +24.6% | +26.9% | +26.9% | +28.3% |
| 2003-06 | +23.7% | +22.0% | +24.5% | +24.2% | +25.5% |
| 2003-07 | +22.5% | +20.6% | +23.4% | +23.0% | +24.7% |
| 2003-08 | +19.0% | +17.0% | +19.9% | +19.6% | +21.5% |
| 2003-09 | +17.7% | +15.1% | +18.5% | +18.8% | +20.1% |
| 2003-10 | +16.3% | +13.7% | +16.7% | +17.8% | +18.5% |
| 2003-11 | +15.7% | +12.8% | +16.2% | +17.5% | +17.5% |
| 2003-12 | +14.6% | +11.5% | +15.0% | +16.7% | +16.0% |
| 2004-01 | +14.8% | +11.7% | +15.7% | +16.8% | +16.1% |
| 2004-02 | +14.8% | +11.6% | +15.2% | +17.0% | +16.5% |
| 2004-03 | +15.5% | +12.3% | +15.7% | +17.6% | +17.8% |
| 2004-04 | +15.9% | +12.4% | +15.9% | +18.6% | +18.1% |
| 2004-05 | +16.9% | +12.9% | +16.8% | +19.8% | +19.6% |
| 2004-06 | +16.7% | +12.2% | +16.9% | +20.0% | +19.0% |
| 2004-07 | +17.5% | +13.1% | +17.6% | +20.7% | +19.9% |
| 2004-08 | +17.5% | +13.3% | +17.8% | +20.6% | +19.2% |
| 2004-09 | +18.2% | +14.5% | +18.4% | +20.8% | +20.4% |
| 2004-10 | +17.7% | +14.2% | +18.0% | +20.2% | +20.0% |
| 2004-11 | +17.4% | +13.8% | +17.3% | +19.8% | +20.5% |
| 2004-12 | +15.6% | +12.0% | +15.3% | +18.1% | +18.7% |
| 2005-01 | +12.8% | +9.2% | +12.3% | +15.4% | +16.7% |
| 2005-02 | +11.9% | +8.5% | +11.5% | +14.2% | +15.2% |
| 2005-03 | +10.5% | +7.2% | +10.3% | +12.7% | +13.3% |
| 2005-04 | +9.7% | +6.8% | +9.7% | +11.7% | +11.8% |
| 2005-05 | +6.8% | +4.6% | +6.6% | +8.3% | +8.9% |
| 2005-06 | +6.4% | +4.3% | +6.0% | +7.7% | +8.7% |
| 2005-07 | +4.5% | +2.6% | +3.9% | +5.8% | +6.6% |
| 2005-08 | +4.6% | +2.6% | +3.9% | +6.2% | +6.6% |
| 2005-09 | +2.5% | +0.5% | +1.8% | +4.3% | +4.5% |
| 2005-10 | +1.7% | -0.3% | +0.9% | +3.6% | +3.6% |
| 2005-11 | +0.3% | -1.8% | -0.2% | +2.1% | +1.8% |
| 2005-12 | +1.2% | -0.6% | +0.6% | +2.6% | +2.4% |
| 2006-01 | +1.6% | +0.1% | +1.2% | +2.9% | +2.0% |
| 2006-02 | +2.0% | +0.6% | +1.5% | +3.3% | +2.5% |
| 2006-03 | +1.1% | -0.1% | +0.6% | +2.3% | +1.4% |
| 2006-04 | +2.0% | +1.1% | +1.4% | +2.9% | +2.6% |
| 2006-05 | +3.5% | +2.6% | +3.1% | +4.4% | +3.7% |
| 2006-06 | +4.7% | +4.0% | +4.4% | +5.5% | +4.6% |
| 2006-07 | +5.4% | +4.5% | +5.0% | +6.4% | +5.3% |
| 2006-08 | +6.3% | +5.6% | +6.0% | +7.2% | +5.9% |
| 2006-09 | +7.4% | +6.8% | +7.3% | +8.3% | +6.5% |
| 2006-10 | +8.3% | +7.9% | +8.4% | +8.9% | +7.5% |
| 2006-11 | +9.1% | +8.9% | +9.1% | +9.8% | +7.8% |
| 2006-12 | +9.6% | +9.3% | +9.6% | +10.3% | +8.5% |
| 2007-01 | +10.5% | +10.2% | +10.6% | +11.2% | +9.3% |
| 2007-02 | +10.3% | +9.9% | +10.3% | +10.9% | +9.4% |
| 2007-03 | +11.8% | +11.2% | +11.8% | +12.6% | +11.0% |
| 2007-04 | +11.5% | +11.0% | +11.3% | +12.5% | +10.4% |
| 2007-05 | +11.6% | +10.9% | +11.4% | +12.7% | +11.0% |
| 2007-06 | +10.2% | +9.7% | +9.7% | +11.2% | +9.7% |
| 2007-07 | +9.9% | +9.6% | +9.5% | +10.4% | +9.7% |
| 2007-08 | +8.7% | +8.8% | +8.3% | +9.3% | +8.1% |
| 2007-09 | +8.5% | +8.6% | +8.1% | +9.0% | +8.1% |
| 2007-10 | +7.2% | +7.2% | +6.7% | +7.8% | +6.7% |
| 2007-11 | +7.5% | +7.6% | +6.9% | +7.9% | +7.6% |
| 2007-12 | +6.4% | +6.8% | +5.8% | +6.5% | +6.3% |
| 2008-01 | +6.7% | +7.3% | +6.0% | +6.5% | +7.0% |
| 2008-02 | +4.4% | +5.1% | +3.8% | +4.2% | +4.3% |
| 2008-03 | +2.7% | +3.3% | +2.4% | +2.7% | +2.5% |
| 2008-04 | +1.0% | +1.5% | +0.7% | +0.9% | +0.7% |
| 2008-05 | +0.2% | +0.8% | +0.2% | +0.2% | -0.6% |
| 2008-06 | -0.6% | 0.0% | -0.6% | -0.8% | -1.4% |
| 2008-07 | -3.6% | -3.1% | -3.4% | -3.8% | -4.7% |
| 2008-08 | -5.7% | -5.3% | -5.7% | -6.2% | -5.7% |
| 2008-09 | -8.3% | -7.7% | -8.3% | -8.8% | -8.3% |
| 2008-10 | -9.1% | -8.5% | -9.1% | -9.7% | -9.1% |
| 2008-11 | -11.1% | -10.7% | -11.0% | -11.5% | -11.5% |
| 2008-12 | -13.3% | -13.2% | -12.9% | -13.3% | -13.9% |
| 2009-01 | -15.2% | -15.1% | -14.9% | -15.2% | -15.8% |
| 2009-02 | -14.6% | -14.2% | -14.4% | -14.7% | -15.4% |
| 2009-03 | -14.0% | -13.2% | -14.1% | -14.5% | -14.2% |
| 2009-04 | -14.5% | -14.0% | -14.5% | -14.9% | -14.6% |
| 2009-05 | -15.3% | -14.7% | -15.3% | -15.7% | -15.9% |
| 2009-06 | -14.3% | -13.9% | -14.1% | -14.3% | -15.8% |
| 2009-07 | -10.9% | -10.3% | -10.9% | -10.9% | -13.2% |
| 2009-08 | -8.3% | -7.9% | -8.0% | -7.9% | -11.4% |
| 2009-09 | -5.1% | -4.9% | -4.7% | -4.5% | -8.3% |
| 2009-10 | -2.7% | -2.6% | -2.1% | -2.0% | -6.6% |
| 2009-11 | -0.8% | -0.3% | -0.6% | 0.0% | -4.8% |
| 2009-12 | +2.3% | +3.0% | +2.5% | +3.0% | -1.8% |
| 2010-01 | +4.6% | +5.3% | +5.0% | +5.5% | -0.7% |
| 2010-02 | +6.6% | +7.3% | +7.6% | +7.4% | +0.2% |
| 2010-03 | +6.0% | +6.9% | +7.0% | +6.9% | -1.1% |
| 2010-04 | +7.5% | +8.7% | +8.3% | +7.9% | +0.8% |
| 2010-05 | +7.9% | +9.2% | +8.4% | +8.1% | +2.3% |
| 2010-06 | +8.4% | +9.7% | +8.8% | +8.4% | +3.2% |
| 2010-07 | +6.4% | +7.6% | +6.7% | +6.5% | +1.7% |
| 2010-08 | +5.6% | +6.9% | +6.1% | +5.4% | +0.9% |
| 2010-09 | +4.1% | +5.7% | +4.6% | +3.8% | -0.6% |
| 2010-10 | +3.1% | +4.6% | +3.6% | +2.7% | -1.0% |
| 2010-11 | +2.7% | +4.1% | +3.3% | +2.1% | -1.0% |
| 2010-12 | +2.4% | +4.0% | +2.9% | +1.6% | -1.2% |
| 2011-01 | +1.1% | +2.5% | +1.4% | +0.2% | -1.6% |
| 2011-02 | -0.5% | +0.8% | -0.7% | -1.1% | -2.0% |
| 2011-03 | -1.4% | -0.3% | -1.8% | -1.9% | -2.5% |
| 2011-04 | -0.9% | +0.2% | -1.4% | -1.3% | -1.9% |
| 2011-05 | -0.6% | +0.4% | -0.8% | -1.1% | -1.7% |
| 2011-06 | -1.4% | -0.6% | -1.4% | -2.0% | -2.0% |
| 2011-07 | -1.0% | -0.7% | -0.9% | -1.5% | -0.6% |
| 2011-08 | -1.0% | -0.8% | -1.1% | -1.4% | -0.9% |
| 2011-09 | -1.3% | -1.1% | -1.4% | -1.5% | -1.2% |
| 2011-10 | -2.3% | -1.7% | -2.3% | -2.6% | -3.3% |
| 2011-11 | -2.0% | -1.5% | -1.9% | -2.4% | -2.7% |
| 2011-12 | -2.1% | -1.6% | -2.0% | -2.7% | -2.7% |
| 2012-01 | -2.4% | -2.0% | -2.0% | -2.9% | -2.8% |
| 2012-02 | -3.0% | -2.7% | -2.6% | -3.3% | -4.2% |
| 2012-03 | -1.8% | -2.1% | -1.0% | -1.7% | -2.9% |
| 2012-04 | -1.3% | -1.6% | -0.5% | -1.2% | -2.5% |
| 2012-05 | -1.4% | -1.7% | -0.7% | -1.3% | -2.5% |
| 2012-06 | -1.1% | -0.9% | -0.8% | -1.0% | -2.9% |
| 2012-07 | -1.4% | -1.0% | -1.2% | -1.2% | -3.5% |
| 2012-08 | -1.3% | -1.2% | -1.3% | -0.9% | -3.1% |
| 2012-09 | -0.2% | -0.3% | -0.1% | +0.2% | -1.5% |
| 2012-10 | +1.2% | +0.7% | +1.3% | +1.9% | +0.5% |
| 2012-11 | +1.0% | +0.5% | +1.1% | +1.8% | -0.1% |
| 2012-12 | -0.2% | -0.5% | -0.2% | +0.7% | -2.1% |
| 2013-01 | +0.1% | -0.2% | +0.3% | +1.0% | -2.0% |
| 2013-02 | +2.1% | +1.8% | +2.3% | +2.8% | +0.5% |
| 2013-03 | +2.7% | +2.7% | +2.8% | +2.9% | +1.4% |
| 2013-04 | +2.2% | +2.4% | +2.2% | +2.4% | +0.7% |
| 2013-05 | +1.7% | +1.9% | +1.6% | +2.0% | +0.3% |
| 2013-06 | +1.5% | +1.3% | +1.6% | +1.9% | +0.2% |
| 2013-07 | +1.6% | +1.3% | +1.8% | +2.0% | +0.4% |
| 2013-08 | +1.8% | +1.6% | +2.1% | +1.9% | +0.8% |
| 2013-09 | +1.5% | +1.5% | +1.7% | +1.6% | +0.6% |
| 2013-10 | +1.1% | +1.4% | +1.2% | +1.0% | -0.1% |
| 2013-11 | +1.4% | +1.7% | +1.6% | +1.3% | 0.0% |
| 2013-12 | +3.3% | +3.3% | +3.7% | +3.1% | +2.6% |
| 2014-01 | +3.7% | +3.7% | +3.9% | +3.6% | +3.8% |
| 2014-02 | +3.7% | +3.8% | +3.7% | +3.5% | +3.6% |
| 2014-03 | +3.1% | +3.4% | +3.2% | +2.9% | +2.4% |
| 2014-04 | +4.2% | +4.4% | +4.6% | +4.1% | +3.2% |
| 2014-05 | +4.9% | +5.0% | +5.2% | +4.9% | +3.7% |
| 2014-06 | +5.7% | +5.9% | +5.9% | +5.6% | +4.6% |
| 2014-07 | +5.8% | +6.1% | +6.1% | +5.6% | +4.5% |
| 2014-08 | +6.2% | +6.5% | +6.5% | +6.0% | +5.2% |
| 2014-09 | +6.2% | +6.3% | +6.5% | +6.2% | +5.3% |
| 2014-10 | +5.7% | +5.5% | +5.9% | +5.8% | +5.7% |
| 2014-11 | +4.9% | +4.8% | +5.1% | +5.0% | +4.9% |
| 2014-12 | +3.9% | +4.1% | +4.0% | +3.9% | +3.7% |
| 2015-01 | +4.9% | +5.3% | +5.1% | +4.8% | +4.1% |
| 2015-02 | +5.1% | +5.3% | +5.3% | +4.9% | +4.5% |
| 2015-03 | +5.1% | +5.4% | +5.2% | +4.7% | +4.8% |
| 2015-04 | +3.3% | +3.7% | +3.4% | +2.8% | +3.1% |
| 2015-05 | +3.5% | +4.1% | +3.7% | +2.8% | +3.2% |
| 2015-06 | +3.7% | +4.1% | +3.9% | +3.2% | +3.1% |
| 2015-07 | +4.0% | +4.5% | +4.3% | +3.5% | +3.6% |
| 2015-08 | +4.1% | +4.4% | +4.4% | +3.6% | +3.5% |
| 2015-09 | +4.0% | +4.7% | +4.2% | +3.3% | +3.6% |
| 2015-10 | +4.4% | +5.1% | +4.7% | +3.8% | +3.5% |
| 2015-11 | +5.1% | +5.9% | +5.4% | +4.5% | +4.1% |
| 2015-12 | +6.0% | +6.6% | +6.3% | +5.5% | +4.6% |
| 2016-01 | +6.1% | +6.8% | +6.6% | +5.5% | +4.6% |
| 2016-02 | +6.3% | +7.0% | +6.6% | +5.8% | +5.0% |
| 2016-03 | +6.4% | +7.0% | +6.5% | +6.1% | +5.7% |
| 2016-04 | +7.4% | +7.7% | +7.2% | +7.3% | +7.1% |
| 2016-05 | +6.2% | +6.1% | +6.1% | +6.4% | +6.0% |
| 2016-06 | +6.1% | +6.1% | +6.0% | +6.3% | +5.9% |
| 2016-07 | +5.5% | +5.5% | +5.3% | +5.6% | +5.4% |
| 2016-08 | +5.6% | +5.6% | +5.4% | +5.6% | +5.7% |
| 2016-09 | +5.2% | +4.9% | +5.3% | +5.3% | +5.4% |
| 2016-10 | +5.6% | +5.6% | +5.8% | +5.3% | +6.2% |
| 2016-11 | +5.9% | +6.2% | +6.0% | +5.2% | +6.5% |
| 2016-12 | +5.6% | +6.0% | +5.5% | +4.9% | +6.6% |
| 2017-01 | +5.4% | +5.8% | +5.2% | +5.0% | +6.3% |
| 2017-02 | +4.7% | +4.8% | +4.4% | +4.3% | +5.8% |
| 2017-03 | +5.1% | +5.4% | +5.0% | +4.6% | +5.9% |
| 2017-04 | +4.8% | +5.2% | +4.8% | +4.0% | +5.8% |
| 2017-05 | +6.0% | +6.6% | +6.2% | +5.0% | +6.9% |
| 2017-06 | +5.7% | +6.1% | +5.7% | +4.7% | +7.2% |
| 2017-07 | +6.0% | +6.2% | +6.0% | +5.0% | +7.7% |
| 2017-08 | +5.5% | +5.7% | +5.4% | +4.8% | +7.0% |
| 2017-09 | +5.7% | +6.1% | +5.5% | +5.0% | +6.9% |
| 2017-10 | +6.0% | +6.3% | +5.8% | +5.6% | +6.2% |
| 2017-11 | +6.4% | +6.4% | +6.4% | +6.4% | +6.5% |
| 2017-12 | +6.5% | +6.3% | +6.8% | +6.6% | +6.2% |
| 2018-01 | +5.5% | +5.2% | +5.9% | +5.5% | +5.6% |
| 2018-02 | +6.0% | +6.1% | +6.6% | +5.9% | +5.0% |
| 2018-03 | +5.1% | +5.1% | +5.7% | +5.2% | +3.5% |
| 2018-04 | +5.4% | +5.4% | +6.1% | +5.8% | +2.9% |
| 2018-05 | +4.0% | +4.1% | +4.5% | +4.4% | +1.0% |
| 2018-06 | +4.0% | +4.4% | +4.7% | +4.2% | +0.9% |
| 2018-07 | +3.9% | +4.7% | +4.4% | +3.9% | +0.6% |
| 2018-08 | +4.2% | +4.6% | +5.0% | +4.1% | +1.1% |
| 2018-09 | +4.2% | +4.6% | +4.9% | +4.2% | +1.0% |
| 2018-10 | +3.5% | +3.8% | +4.4% | +3.5% | +0.9% |
| 2018-11 | +2.8% | +3.2% | +3.4% | +2.8% | +0.2% |
| 2018-12 | +2.8% | +3.3% | +3.2% | +2.7% | +0.7% |
| 2019-01 | +2.4% | +3.0% | +2.8% | +2.3% | +0.2% |
| 2019-02 | +2.0% | +2.5% | +2.4% | +1.8% | +0.4% |
| 2019-03 | +1.1% | +1.6% | +1.5% | +0.8% | -0.6% |
| 2019-04 | +0.7% | +1.1% | +1.2% | +0.5% | -0.8% |
| 2019-05 | +0.7% | +0.8% | +1.2% | +0.6% | -0.5% |
| 2019-06 | +1.2% | +1.2% | +1.4% | +1.4% | +0.1% |
| 2019-07 | +1.4% | +1.2% | +1.7% | +1.8% | +0.6% |
| 2019-08 | +1.3% | +1.5% | +1.3% | +1.6% | +0.2% |
| 2019-09 | +1.1% | +1.1% | +1.1% | +1.5% | +0.5% |
| 2019-10 | +1.0% | +1.1% | +1.0% | +1.4% | +0.1% |
| 2019-11 | +0.9% | +0.6% | +1.1% | +1.2% | +0.3% |
| 2019-12 | +0.4% | +0.2% | +0.8% | +0.8% | -0.6% |
| 2020-01 | +1.5% | +1.2% | +2.0% | +2.0% | +0.1% |
| 2020-02 | +1.5% | +1.2% | +1.9% | +2.3% | -0.2% |
| 2020-03 | +2.8% | +2.5% | +3.2% | +3.4% | +1.1% |
| 2020-04 | +1.8% | +1.7% | +2.0% | +2.3% | -0.2% |
| 2020-05 | +2.0% | +2.1% | +2.4% | +2.2% | +0.3% |
| 2020-06 | +0.9% | +0.9% | +1.5% | +1.1% | -1.1% |
| 2020-07 | +1.3% | +1.3% | +1.9% | +1.3% | -0.5% |
| 2020-08 | +1.0% | +1.0% | +1.8% | +1.1% | -1.5% |
| 2020-09 | +2.5% | +2.9% | +3.3% | +2.5% | -0.7% |
| 2020-10 | +3.6% | +4.3% | +4.2% | +3.7% | -0.1% |
| 2020-11 | +4.9% | +5.7% | +5.1% | +5.2% | +1.2% |
| 2020-12 | +6.5% | +7.3% | +6.4% | +7.1% | +2.7% |
| 2021-01 | +6.6% | +6.7% | +6.6% | +7.3% | +4.3% |
| 2021-02 | +7.3% | +6.8% | +7.3% | +8.1% | +6.4% |
| 2021-03 | +6.8% | +5.5% | +6.7% | +8.0% | +7.8% |
| 2021-04 | +7.4% | +5.9% | +7.3% | +8.5% | +9.0% |
| 2021-05 | +7.7% | +6.4% | +7.4% | +8.9% | +9.1% |
| 2021-06 | +8.6% | +7.3% | +8.0% | +10.0% | +10.2% |
| 2021-07 | +6.9% | +5.6% | +6.6% | +8.3% | +8.2% |
| 2021-08 | +7.4% | +6.2% | +7.1% | +8.4% | +9.2% |
| 2021-09 | +6.8% | +5.4% | +6.8% | +7.6% | +8.8% |
| 2021-10 | +6.8% | +5.9% | +6.6% | +7.2% | +8.6% |
| 2021-11 | +7.1% | +6.4% | +7.1% | +7.3% | +8.4% |
| 2021-12 | +5.7% | +5.6% | +5.7% | +5.4% | +6.3% |
| 2022-01 | +7.2% | +7.4% | +7.4% | +6.9% | +6.5% |
| 2022-02 | +8.0% | +8.6% | +8.2% | +7.6% | +6.5% |
| 2022-03 | +9.3% | +10.6% | +9.7% | +8.6% | +6.1% |
| 2022-04 | +10.9% | +12.1% | +11.3% | +10.3% | +7.5% |
| 2022-05 | +11.5% | +12.7% | +12.0% | +11.1% | +7.6% |
| 2022-06 | +12.2% | +13.3% | +12.8% | +11.8% | +8.6% |
| 2022-07 | +14.7% | +15.7% | +15.2% | +14.4% | +10.6% |
| 2022-08 | +14.0% | +14.8% | +14.4% | +14.2% | +10.1% |
| 2022-09 | +14.1% | +14.9% | +14.2% | +14.5% | +9.8% |
| 2022-10 | +12.9% | +13.0% | +13.2% | +13.6% | +9.6% |
| 2022-11 | +12.6% | +12.6% | +12.9% | +13.3% | +9.5% |
| 2022-12 | +12.0% | +11.3% | +12.5% | +13.1% | +10.1% |
| 2023-01 | +9.1% | +8.8% | +9.5% | +9.8% | +7.2% |
| 2023-02 | +7.1% | +7.2% | +7.5% | +7.5% | +4.8% |
| 2023-03 | +5.2% | +5.6% | +5.5% | +5.1% | +2.8% |
| 2023-04 | +2.7% | +3.4% | +3.2% | +2.2% | +0.5% |
| 2023-05 | +1.0% | +1.4% | +1.6% | +0.5% | -0.3% |
| 2023-06 | -1.0% | -0.5% | -0.7% | -1.5% | -2.6% |
| 2023-07 | -1.9% | -1.4% | -1.7% | -2.2% | -3.5% |
| 2023-08 | -1.4% | -0.8% | -1.1% | -1.7% | -3.2% |
| 2023-09 | -2.0% | -1.7% | -1.7% | -2.2% | -3.4% |
| 2023-10 | -1.8% | -1.9% | -1.4% | -1.9% | -2.7% |
| 2023-11 | -4.4% | -4.4% | -3.9% | -4.6% | -5.1% |
| 2023-12 | -5.1% | -5.1% | -4.6% | -5.4% | -5.8% |
| 2024-01 | -5.4% | -5.4% | -5.0% | -5.5% | -5.9% |
| 2024-02 | -4.6% | -5.1% | -4.2% | -4.3% | -5.0% |
| 2024-03 | -4.1% | -5.0% | -4.0% | -3.5% | -4.0% |
| 2024-04 | -3.9% | -5.1% | -3.7% | -3.0% | -3.3% |
| 2024-05 | -4.0% | -5.1% | -4.0% | -3.2% | -3.5% |
| 2024-06 | -2.6% | -3.8% | -2.4% | -1.8% | -2.0% |
| 2024-07 | -2.0% | -3.0% | -1.8% | -1.1% | -1.6% |
| 2024-08 | -1.5% | -2.7% | -1.4% | -0.6% | -1.0% |
| 2024-09 | -1.9% | -2.7% | -1.7% | -1.3% | -1.9% |
| 2024-10 | -2.3% | -2.8% | -2.2% | -1.8% | -2.5% |
| 2024-11 | -1.0% | -1.5% | -0.7% | -0.4% | -1.5% |
| 2024-12 | +1.0% | +0.6% | +1.1% | +1.6% | -0.1% |
| 2025-01 | +1.5% | +1.3% | +1.9% | +2.1% | 0.0% |
| 2025-02 | +2.2% | +2.3% | +2.4% | +2.6% | +0.5% |
| 2025-03 | +2.6% | +1.9% | +2.9% | +3.5% | +1.9% |
| 2025-04 | +2.8% | +2.8% | +3.2% | +3.3% | +1.1% |
| 2025-05 | +3.3% | +3.6% | +3.8% | +3.6% | +0.6% |
| 2025-06 | +1.0% | +2.3% | +1.8% | +0.7% | -3.0% |
| 2025-07 | +1.1% | +1.8% | +1.8% | +1.0% | -2.4% |
| 2025-08 | +0.2% | +0.7% | +1.2% | +0.1% | -3.0% |
| 2025-09 | +2.0% | +2.2% | +2.9% | +2.1% | -1.1% |
| 2025-10 | +2.1% | +2.3% | +3.3% | +2.3% | -1.3% |
| 2025-11 | +2.3% | +2.4% | +3.2% | +2.7% | -1.1% |
| 2025-12 | +1.1% | +0.8% | +2.2% | +1.6% | -1.9% |
| 2026-01 | +1.7% | +1.1% | +2.6% | +2.6% | -0.7% |
| 2026-02 | +0.6% | +0.1% | +1.6% | +1.2% | -2.0% |
| 2026-03 | +0.7% | +1.1% | +1.9% | +1.0% | -3.7% |
Read against the whole property market, Somerset's headline discount is modest but the type-by-type detail is uneven.
| Property Type | Somerset Average | England Average | Difference |
|---|---|---|---|
| Detached houses | £452,948 | £470,492 | -3.7% |
| Semi-detached houses | £286,142 | £288,185 | -0.7% |
| Terraced houses | £231,776 | £243,788 | -4.9% |
| Flats and maisonettes | £134,247 | £214,563 | -37.4% |
| All property types | £278,634 | £289,946 | -3.9% |
The semi-detached number is the one to watch if you are pricing family-home stock. At £286,142 it sits within 1% of the England average, because the semi is the workhorse of Somerset's market towns and owner-occupier demand in Taunton, Bridgwater and Yeovil keeps it trading close to national levels. Terraced houses at £231,776 are 4.9% under England, and in the older working towns those Victorian and Edwardian terraces are where the rental sums tend to work. The 37.4% flat discount is the outlier, and it reflects scarcity of demand rather than a bargain waiting to be picked up.
Best areas to invest in Somerset
Somerset's two town guides sit at opposite ends of the county in both geography and price. Wells is a cathedral city in the Mendips with a small, tightly held market. Bath, on the north-eastern boundary in the Bath and North East Somerset authority, is a heritage city with student and tourism demand layered on top of its residential base. Ranked by top gross yield from the latest month, the picture is this.
| Area | Mean Asking Price | 30% Deposit | Top Gross Yield |
|---|---|---|---|
| Wells | £374,584 | £112,375 | 4.9% |
| Bath | £478,576 | £143,573 | 4.4% |
Wells edges Bath on yield, at 4.9% against 4.4%, and it does so on an asking price more than £100,000 lower. That is the smaller-city discount at work: Wells has none of Bath's tourism premium, so rents sit closer to what the local price base will support. Bath's higher price reflects what a World Heritage city on Bristol's doorstep commands, and its yield is the trade-off you accept for that.
Away from the two guide towns, the county's highest single-postcode yield sits in TA6 around Bridgwater, where an average asking price of £243,188 against monthly rents of about £1,085 works out at 5.4%. Bridgwater is the biggest reason Somerset's county yield reaches that level. Taunton, Weston-super-Mare and Yeovil are the other working towns where the rental market has real depth. We do not hold standalone postcode analysis for those towns yet, so treat them as areas to look at rather than places we can quote a full data set on. The pattern across all of them is consistent: the yield lives in the M5-corridor and A303 towns, not the villages.

Somerset's coastal, commuter and lifestyle markets
Somerset does not have one rental story. It has three, and they pull in different directions.
The M5 working towns
Bridgwater, Taunton and Weston-super-Mare line the M5 as it runs south from Bristol. This is where tenant demand concentrates, because these are the towns with the jobs, the transport links and the housing stock that lets. Bridgwater's market has been reshaped by the Hinkley Point C project up the coast, which pulled in construction and supply-chain workers and pushed the town's transaction volumes and yields to the top of the county. That demand is tied to a construction phase, so the honest read is that Bridgwater's rental dynamics will shift when the build winds down and a smaller operational workforce takes over.
The Bristol fringe
Along Somerset's northern edge, the BS-prefixed postcodes around Nailsea, Backwell, Winscombe and Wedmore behave like Bristol commuter belt rather than rural Somerset. Prices here run past £500,000 and stretch to £675,815 in Wedmore, driven by buyers who work in the city and want village living within reach of it. The yields are thin because the prices are set by what commuters will pay, not by what local rents return. These are capital-value postcodes, not income ones.
The lifestyle towns and coast
Frome has become a destination in its own right, drawing creative professionals and relocators, and its market turns over more slowly because buyers hold on once they arrive. On the coast, Minehead is a seasonal retirement and holiday town where tenant demand is thinner and more seasonal, which is why its yields sit at the bottom of the county despite modest prices. Wells and Glastonbury in the Mendips are small, character-led markets shaped more by tourism and lifestyle demand than by a conventional letting market.
Somerset's student and HMO market
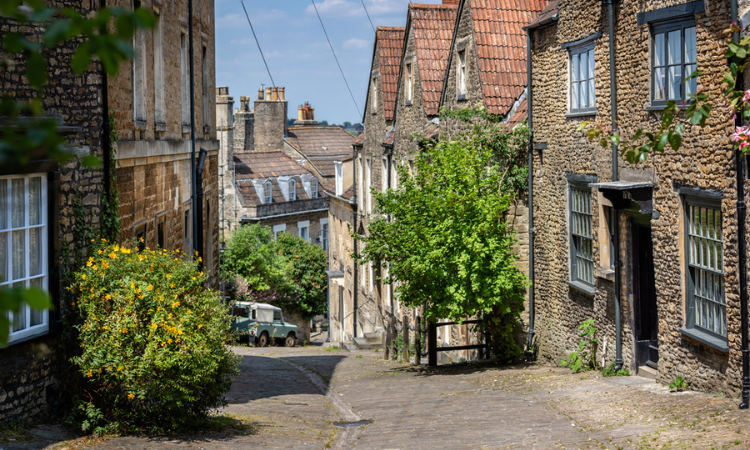
Somerset's student demand is concentrated almost entirely in Bath, which is why the county's HMO market is really a Bath market. The city is home to two universities: the University of Bath on its Claverton Down campus in the BA2 postcode, and Bath Spa University at Newton Park on the western edge of the city. Between them they bring a large, renewing pool of student tenants into a compact city, and that shared-house demand is what supports Bath's HMO yields above the plain buy-to-let figure.
An HMO let to students or professionals is a different proposition from a single-family let, and the licensing rules bite. A large HMO housing five or more people from more than one household needs a mandatory licence, and Bath and North East Somerset Council also runs its own scheme and register. Before buying HMO stock in the city, check the current requirements and apply through the council's Bath and North East Somerset HMO licensing page, which lists the standards and fees that apply. Outside Bath, the student and HMO market thins out fast. Wells, Bridgwater, Taunton and the rural towns are single-family-let markets, so the HMO strategy in Somerset largely means the Bath strategy.
What a Somerset buy-to-let deposit costs
The deposit you need swings hard with property type, because of that 3.4-times gap between the average detached house and the average flat. The table below takes 30% of each type average. We use 30% rather than the 25% minimum because it typically unlocks better interest rates, and the improved rate usually outweighs the extra capital tied up.
| Property Type | Average Somerset Price | 30% Deposit |
|---|---|---|
| Detached houses | £452,948 | £135,884 |
| Semi-detached houses | £286,142 | £85,843 |
| Terraced houses | £231,776 | £69,533 |
| Flats and maisonettes | £134,247 | £40,274 |
| All property types | £278,634 | £83,590 |
On the county average, £83,590 gets you into the market. But the spread from £40,274 for a flat to £135,884 for a detached house is what actually shapes a Somerset strategy. A terraced house at a £69,533 deposit is where a lot of the workable rental numbers in the market towns land, while a detached house asks for nearly twice that and returns a lower yield. The county-average deposit hides which end of the market you are really buying at, so price the deposit against the specific property type you are chasing, not the headline figure.
How to invest in Somerset
A buy-to-let purchase in Somerset carries the 5% stamp duty surcharge on top of the standard rates, so on a £278,634 average-priced home the surcharge alone runs to several thousand pounds before the standard bands apply. Work the exact figure for your target price with our stamp duty calculator before you commit, and budget for legal fees and a survey on top of the deposit.
When you are ready to look at stock, our investment property service is the place to start, and you can browse current buy-to-let deals across the UK to see what is trading now. Investors chasing a lower purchase price will find more room in the discounted-stock routes, from below market value properties through to repossession and auction lots.
To see where Somerset ranks against the wider country, our guide to the best places to invest puts the county's yields and prices in national context. If you are weighing the South West as a region, the neighbouring city markets of Bristol and Bath sit right on Somerset's northern boundary and give you a direct read on how urban rental demand compares to the county's town-by-town picture.
Frequently Asked Questions
What is the average house price in Somerset?
The average sold price across Somerset is £278,634 as of March 2026, according to the HM Land Registry House Price Index. That is 3.9% below the England average of £289,946. It breaks down to £452,948 for a detached house, £286,142 for a semi-detached, £231,776 for a terraced house, and £134,247 for a flat. The county reached an all-time high of £289,366 in November 2022 and has drifted back since as interest rates rose.
What is the average rent in Somerset?
Rents vary sharply by town rather than settling on one county figure. In the working towns along the M5, monthly rents run around £1,085 in Bridgwater and just over £1,000 in central Taunton, which is where the county's higher yields come from. In the Bristol-fringe and lifestyle postcodes rents are higher in cash terms but the prices are higher still, so the yields are thinner. The county's rental market is concentrated in a handful of towns rather than spread evenly across every postcode.
Where are the highest rental yields in Somerset?
The top single-postcode gross yield in Somerset is 5.4%, in the TA6 area around Bridgwater, where an average asking price near £243,188 meets monthly rents of about £1,085. Weston-super-Mare, Taunton and Yeovil follow as the other working towns with real rental depth. Of the two town guides we hold, Wells leads on yield at 4.9% and Bath sits at 4.4%. The pattern is consistent across the county: the yield lives in the M5-corridor towns, not the villages.
What are buy-to-let prices and yields in Bath, Somerset?
Bath has a top gross yield of 4.4% on a mean asking price of £478,576, which needs a 30% deposit of £143,573. Its numbers are shaped by two universities and a heavy tourism trade, so demand runs across student HMOs, professional lets and short-let holiday stock. The trade-off is the price. Bath is the most expensive market in the county, so the yield is lower than the working towns even though tenant demand is deep and year-round.
What is the cheapest place to buy property in Somerset?
The lowest average asking prices in the county sit in the working towns rather than the guide towns. The Bridgwater area is the cheapest, with an average asking price around £243,188, followed by the Yeovil and central Taunton postcodes. Those same towns carry the highest yields, so in Somerset the cheapest places to buy and the best-yielding places to buy are largely the same postcodes, which is not true in every county.
How does Somerset compare to Bath and Bristol for property investment?
Bath and Bristol both sit on Somerset's northern edge and both run higher on price than most of the county. Bristol is a dense city with deep, year-round rental demand across almost all its postcodes, which pushes its top yields well above Somerset's. Bath commands the highest prices of the three and leans on student and tourism demand. Somerset's own working towns undercut both cities on price, but the county's rental demand concentrates in a few towns rather than spreading across every postcode the way a city market does.
Ready to buy property?
Browse investment properties with prices and gross yields shown for each opportunity.
Get property alerts