Where to Buy Property Investments in Southampton: Yields of 9.0%
Southampton's gross rental yields range from 4.6% to 9.0% across all six postcodes, with SO17 delivering the highest returns. Average sold prices sit 19.9% below the England average, and the city's population grew 5.1% to 248,922 between the 2011 and 2021 censuses.
Southampton's average sold price of £233,920 is 38.2% below the South East regional average of £378,800. That gap is wider than Portsmouth (24.7% below) and Bournemouth (6.2% below) on the same measure. Asking prices start from £216,516 in SO14, and rental data is available for all six of the city's postcodes.
This guide covers all six Southampton postcodes from SO14 to SO19 under the Southampton unitary authority (ONS code E06000045). Southampton sits on the south coast of Hampshire, centred on one of the UK's busiest commercial ports. Investors comparing options in the region may also consider Portsmouth, Bournemouth, or Reading. Browse all our South East location guides.
Article updated: March 2026
Southampton Buy-to-Let Market Overview 2026
Southampton's asking prices sit below Portsmouth, Bournemouth, Reading, and Brighton, with port employment and two universities underpinning rental demand.
- Average sold price: £233,920 (19.9% below England's £291,865)
- Asking price range: £216,516 (SO14) to £305,281 (SO16)
- Rental yields: 4.6% (SO18) to 9.0% (SO17) across all 6 postcodes
- Rental income: Monthly rents from £1,106 (SO18) to £1,890 (SO17)
- Price per sq ft: Sold prices from £275/sq ft (SO14) to £329/sq ft (SO18)
- Market activity: Sales ranging from 21 per month (SO14, SO17) to 48 per month (SO19)
- Deposit requirements: 30% deposits range from £64,955 (SO14) to £91,584 (SO16)
- Affordability ratios: Property prices from 5.8 to 8.2 times Southampton's median annual salary of £37,130
Contents

-
by Robert Jones, Founder of Property Investments UK
With two decades in UK property, Rob has been investing in buy-to-let since 2005, and uses property data to develop tools for property market analysis.

Property Data Sources
Our location guide relies on diverse, authoritative datasets including:
- HM Land Registry UK House Price Index
- Ministry of Housing, Communities and Local Government
- Ordnance Survey Data Hub
- Propertydata.co.uk
We update our property data quarterly to ensure accuracy. Last update: March 2026. All data is presented as provided by our sources without adjustments or amendments.
Why Invest in Southampton?
Southampton's economy is built on its port. Associated British Ports operates one of the UK's busiest commercial docks, handling around 900,000 cruise passengers per year and significant container traffic. P&O Cruises, Cunard, MSC, and Celebrity Cruises all use Southampton as their UK homeport. That means thousands of jobs in logistics, hospitality, and maritime services that feed directly into local rental demand.
The city has two universities generating a combined student population of around 35,000. The University of Southampton is a Russell Group institution with roughly 24,000 students, a nationally recognised engineering faculty, and the National Oceanography Centre. Solent University adds another 11,000 students with strengths in maritime, media, and sport. Students and graduates create year-round rental demand in SO17 (Portswood), SO14 (City Centre), and parts of SO15 (Shirley).
Between the 2011 and 2021 censuses, Southampton's population grew from 236,882 to 248,922, a rise of 5.1%. That is below the England average of 6.6%. Southampton's growth has been steady rather than speculative, driven by the port, universities, and University Hospital Southampton, which is one of the largest NHS teaching hospitals in the country and the region's major trauma centre.
Earnings in Southampton sit below both the regional and national averages. The median annual salary is £37,130, compared to £41,616 across the South East and £39,125 for Great Britain. Lower local wages in a high-cost region create a dynamic where rents absorb a larger share of income than in many cities. For investors, this means strong rental demand from tenants who need to rent because buying is out of reach, but also a market where affordability pressure on tenants is above average.
Southampton Economic Summary
- Population: 248,922 (2021 Census). Growth of 5.1% from 2011.
- Median annual salary: £37,130 (Southampton), £41,616 (South East), £39,125 (Great Britain)
- Employment rate: 72.8% (Southampton), 78.7% (South East), 75.6% (Great Britain)
- Unemployment rate: 3.1% (Southampton), 3.5% (South East), 4.3% (Great Britain)
- Key employment sectors: Port and logistics, healthcare, higher education, retail, maritime technology
Source: ONS Census 2021, Nomis Labour Market Profile (ASHE 2025, Employment Oct 2024-Sep 2025)
Southampton's employment rate of 72.8% sits well below the South East average of 78.7% and the national 75.6%. But unemployment at 3.1% is lower than both the regional 3.5% and national 4.3%. That combination is common in university cities. A large student population depresses the headline employment rate without being counted as unemployed. The 22.8% of employee jobs in health and social work reflects the hospital's dominance as an employer, while 8.8% in transportation and storage is the port economy showing up in the data.
Source: Office for National Statistics - Population for Southampton
Regeneration & Investment in Southampton
Southampton's regeneration pipeline is concentrated around the waterfront and city centre, with projects that aim to add housing, leisure, and commercial space within walking distance of the port and main railway station.
- Town Quay Waterfront (planning approved, £230m): Three 25-storey residential towers with over 400 flats, a 9-storey hotel with 128 bedrooms, and a 300-berth marina. Developed by Nicholas James Group and funded through private equity and flat sales. Delivery is planned in two phases over four years. The scale of this project will add significant housing supply to the SO14 waterfront area. Updates at Construction Enquirer.
- Bargate Quarter (under construction, £139m): A 519-unit residential development with 2,515 sq metres of ground floor commercial space, built around Southampton's 12th-century Bargate gatehouse and city walls. Developed by Tellon Capital with Legal & General as forward funder. The scheme adds city centre rental stock aimed at young professionals. Updates at UK Construction Media.
- Southampton Outdoor Sports Centre (under construction, £36m): A renewal of the city's 1938 sports centre funded by the Levelling Up Fund, Southampton City Council, and the Football Foundation. Morgan Sindall is delivering new covered courts, a gym, community spaces, improved athletics facilities, and three artificial pitches. Completion is expected in early 2027. Updates at The Construction Index.

Southampton Property Market Analysis
When Was the Last House Price Crash in Southampton?
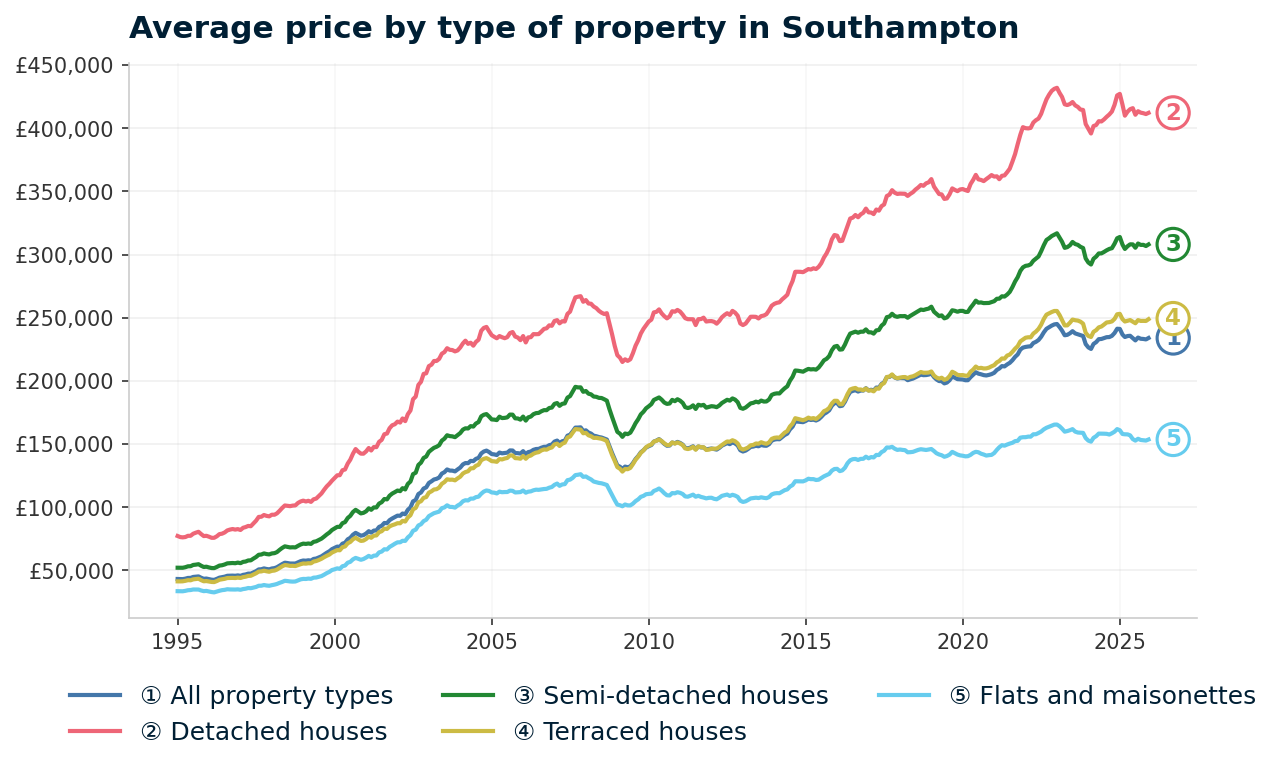
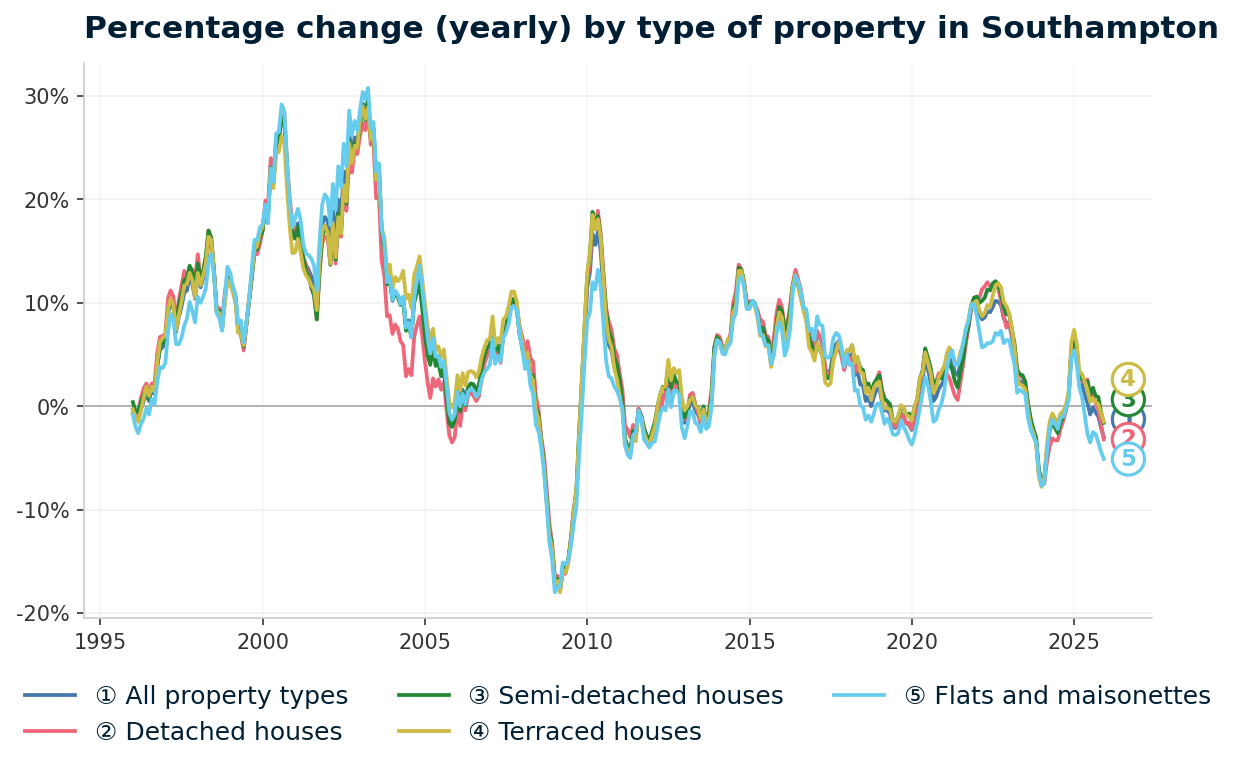
Southampton's last major crash saw prices fall 20.2% from £163,196 to £130,199 between November 2007 and March 2009, taking nearly seven years to recover. The full house price history from the HM Land Registry House Price Index runs from January 1995 to December 2025 and shows one major crash, a relatively quick initial bounce, and a double-dip pattern in the most recent years.
- 1995-2000 (Slow start): Southampton began 1995 at £43,144. Prices barely moved for two years, dipping to £43,015 in January 1996 with an annual change of -0.3%. By January 2000, prices had reached £67,762. Steady growth but unremarkable, while London and the wider South East were already accelerating.
- 2000-2007 (The boom): Southampton exploded. Prices more than doubled from £67,762 in January 2000 to a peak of £163,196 in November 2007. The sharpest growth came in 2003, when annual change hit 29.7% in April. Port expansion, university growth, and cheap credit all contributed. By the peak, prices had outrun local wages considerably.
- 2007-2009 (The financial crisis): From the peak of £163,196 in November 2007 to the trough of £130,199 in March 2009, Southampton lost 20.2% of its value in 16 months. The worst annual change reading was -17.7% in March 2009. All property types fell almost equally: detached -17.7%, semi-detached -17.8%, terraced -18.0%, flats -17.4%. Southampton's decline was broadly in line with the South East region (-19.9%) and worse than England overall (-18.1%).
- 2009-2013 (Quick bounce, then stagnation): Prices recovered sharply off the trough. By December 2009, the average had rebounded to £147,184. But then growth slowed. By December 2013, prices stood at £152,619. Still 6.5% below the pre-crash peak after four years of modest gains.
- 2014-2016 (Recovery): Growth returned more convincingly. Annual change hit 9.7% in August 2014, when prices finally passed the pre-crash peak at £163,761. That recovery took nearly seven years from the November 2007 peak. By December 2016, prices had reached £194,166, helped by stamp duty reforms and improving employment.
- 2017-2019 (Plateau): Growth stalled. Prices traded sideways between £192,000 and £205,000. By December 2019, the average was £201,201 with annual change actually turning negative at -1.8%. Brexit uncertainty weighed on the South East market more heavily than the Midlands or North.
- 2020-2022 (Pandemic surge): The stamp duty holiday and remote working demand hit Southampton hard in the best sense. Prices jumped from £200,518 in March 2020 to £244,681 by December 2022. That is 22.0% growth in under three years. Southampton's coastal location and relative affordability within the South East made it a beneficiary of the lifestyle relocation trend.
- 2023-2025 (Rate shock and double dip): Interest rate rises reversed the gains sharply. Prices fell to £229,104 by December 2023, a decline of 6.4% from the 2022 peak. A partial recovery to £241,250 by December 2024 looked promising, but prices then fell back to £233,920 by December 2025. The current annual change of -3.0% means Southampton is still adjusting. Prices sit 4.4% below their post-pandemic peak.
In 30 years, Southampton prices have risen 442.2% from £43,144 to £233,920. The only major crash (2007-2009) produced a 20.2% decline that took nearly seven years to recover.
Long-Term Property Value Growth in Southampton
- 5 years (2020-2025): +13.9% (£205,342 to £233,920)
- 10 years (2015-2025): +28.3% (£182,341 to £233,920)
- 15 years (2010-2025): +54.2% (£151,664 to £233,920)
- 20 years (2005-2025): +64.2% (£142,421 to £233,920)
- 30 years (1995-2025): +442.2% (£43,144 to £233,920)
The 2008 crash is the reference point for Southampton investors assessing downside risk. A 20.2% decline took nearly seven years to recover. The current -3.0% annual decline is mild by comparison but extends a pattern of weakness since the 2022 peak.
Southampton's long-term structural drivers remain intact. The port is not relocating. The universities are not shrinking. University Hospital Southampton continues to expand. But the short-term price data shows a city still working through the rate shock that hit the wider South East market.
Source: HM Land Registry House Price Index for Southampton
Source: HM Land Registry House Price Index for Southampton, January 1995 to December 2025.
Thinking of Buying?
We have off-market investment properties averaging 8%+ annual yield.
View Property DealsSold House Prices in Southampton
Southampton's average sold price of £233,920 is 19.9% below England's £291,865 and 38.2% below the South East's £378,800. But that discount tells a misleading story. It is almost entirely driven by two property types. Semi-detached and terraced houses actually sit above England averages.
Southampton Flats to Buy: The Discount That Drives Yields
Flats in Southampton average £153,577. That is 30.0% below the England average of £219,340. This is the widest discount in Southampton's market and reflects a combination of purpose-built student accommodation, ex-local authority stock, and city centre conversions. The flat market in SO14 and SO17 is heavily influenced by the university rental sector.
| Property Type | Southampton Average | England Average | Difference |
|---|---|---|---|
| Detached houses | £412,160 | £471,667 | -12.6% |
| Semi-detached houses | £307,997 | £289,135 | +6.5% |
| Terraced houses | £248,810 | £244,830 | +1.6% |
| Flats and maisonettes | £153,577 | £219,340 | -30.0% |
| All property types | £233,920 | £291,865 | -19.9% |
Semi-detached houses at £307,997 are 6.5% above England's £289,135. This is unusual for a city where the overall average is 19.9% below. Semis are the core family housing stock in Southampton's suburban postcodes like SO16 (Bassett, Lordshill) and SO19 (Sholing, Woolston). Owner-occupier demand in the South East pushes these prices above the national average, even though the wider city appears affordable.
Terraced houses average £248,810, 1.6% above England. Like semis, terraced stock is popular with owner-occupiers and investors in the inner suburbs. SO15 (Shirley) and parts of SO14 have Victorian and Edwardian terraces that trade at competitive prices. The premium over England is small but tells a different story to the average house price in Southampton. The headline discount does not apply if you are buying terraced houses.
Detached houses sit 12.6% below England at £412,160. There are relatively few detached properties within the city boundary, concentrated in SO16 (Bassett) and the fringes of SO18. Southampton's compact urban footprint limits detached housing supply, but the city does not command the premium that detached homes achieve in Surrey or Berkshire.
Flats at 30.0% below England represent the largest gap in the market. For investors, that gap is where yields are generated. Flat rents in SO17 and SO14 are high relative to purchase prices, which is what drives the headline 9.0% and 7.2% yields in those postcodes. The postcode-level data in the sections below shows where this translates into returns.
Price Per Square Foot in Southampton
Southampton's price per square foot ranges from £275 in SO14 to £329 in SO18, a spread of just 20% across six postcodes. Average asking prices can mislead because a postcode might look expensive simply because it has larger properties. Price per square foot strips out that size bias and shows what you are actually paying for space. That is a narrow range compared to many cities and it means the underlying cost of space is relatively uniform across Southampton. The postcode differences in asking price are driven more by property size than by per-foot premiums.
| Rank | Area | Price Per Sq Ft |
|---|---|---|
| 1 | SO14 (City Centre, St Marys) | £275 |
| 2 | SO17 (Portswood, Highfield) | £295 |
| 3 | SO15 (Shirley, Millbrook) | £297 |
| 4 | SO19 (Sholing, Woolston) | £312 |
| 5 | SO16 (Bassett, Lordshill) | £313 |
| 6 | SO18 (Bitterne Park) | £329 |
SO14 at £275 per square foot is the cheapest space in Southampton. This is the city centre and waterfront area, where smaller flats and older stock keep per-foot costs low. SO14 also delivers a 7.2% yield and 8.3% one-year growth. Investors buying here are paying the least per square foot while accessing some of the city's strongest returns.
SO18 Bitterne Park at £329 per square foot is the most expensive, but by a margin of only £54 over SO14. That 20% spread is narrow. In many cities, the gap between cheapest and most expensive per-foot prices exceeds 50%. Southampton's compact geography means you are not paying a dramatic premium for one postcode over another. The investment decision comes down to yield, growth trajectory, and tenant profile rather than wildly different space costs.
Figures reflect averages across all property types and ages. Individual values depend on condition, location within the postcode, and building age.
Homes for Sale in Southampton: Asking Prices by Postcode
Southampton's asking prices range from £216,516 in SO14 to £305,281 in SO16, a spread of £89,000 across six postcodes. Asking prices reflect what sellers and agents think the market will pay. They are not the same as sold prices, which capture what buyers actually paid. In a falling market like Southampton's current -3.0% annual change, asking prices may sit above what eventually transacts.
| Rank | Area | Average Asking Price |
|---|---|---|
| 1 | SO14 (City Centre, St Marys) | £216,516 |
| 2 | SO15 (Shirley, Millbrook) | £238,570 |
| 3 | SO17 (Portswood, Highfield) | £252,208 |
| 4 | SO19 (Sholing, Woolston) | £262,799 |
| 5 | SO18 (Bitterne Park) | £288,971 |
| 6 | SO16 (Bassett, Lordshill) | £305,281 |
Three postcodes cluster below £253,000: SO14, SO15, and SO17. These are the city centre, the inner west, and the university belt. Together they account for Southampton's highest-yielding postcodes (SO17 at 9.0%, SO14 at 7.2%, and SO15 at 6.9%). The entry price is similar across all three, so the decision comes down to tenant profile and growth outlook.
SO14 has the strongest recent growth at 8.3% one-year. SO17 has the highest yield at 9.0% but is falling in price. SO15 sits in the middle on both measures.
SO16 Bassett at £305,281 is the most expensive postcode. It attracts families and professional owner-occupiers, which supports long-term pricing but compresses yields to 5.3%. Among all homes for sale in Southampton, the gap between SO16 and the next most expensive postcode (SO18 at £288,971) is only £16,000, suggesting the premium end of the market is relatively tight.
The mean asking price across all six Southampton postcodes is £260,724. That figure appears in the comparison section later, where Southampton is measured against Portsmouth, Bournemouth, Reading, and Brighton. With prices at this level, investors searching for renovation properties may find opportunities in SO14 and SO15 where older stock trades below the postcode average.

House Price Growth in Southampton
Five of six postcodes delivered positive five-year growth, with SO19 leading at 16.1%. The five-year figure matters most for buy-to-let investors. It captures a full market cycle and filters out short-term noise. One-year growth can swing on a handful of transactions.
The outlier is SO17, the university postcode, which has fallen 5.7% over five years and 18.3% in the past year alone. An investor who bought a £226,000 property in SO19 five years ago would be sitting on a property now asking £262,799. That is £36,000 in equity growth from one of Southampton's suburban postcodes.
| Area | 1 Year | 3 Years | 5 Years |
|---|---|---|---|
| SO19 (Sholing, Woolston) | 0.7% | -2.3% | 16.1% |
| SO15 (Shirley, Millbrook) | 2.5% | 4.9% | 15.5% |
| SO18 (Bitterne Park) | 5.5% | 1.6% | 14.7% |
| SO14 (City Centre, St Marys) | 8.3% | 2.0% | 13.6% |
| SO16 (Bassett, Lordshill) | -3.1% | -3.4% | 8.7% |
| SO17 (Portswood, Highfield) | -18.3% | -12.2% | -5.7% |
SO14 City Centre has the strongest one-year growth at 8.3%. That is a significant reading in a city where the overall Land Registry figure shows -3.0% annual change. The difference tells you that city centre stock is moving in the opposite direction to the wider market. Town Quay and Bargate Quarter development activity may be contributing to a repricing of the waterfront and central postcodes.
SO17 at -18.3% one-year and -5.7% five-year is the clear outlier. This is the university postcode. The data shows a sustained price correction that has wiped out pandemic-era gains.
The yield remains headline-grabbing at 9.0%, but that yield is partly a function of falling asking prices rather than rising rents. Rents of £1,890 per month are the highest in the city. It is the asking price decline that has pushed the yield calculation upward.
SO18 and SO15 show steady long-term appreciation. Both have delivered positive growth across all three timeframes. SO18 at 5.5% one-year growth is the second strongest recent performance. These suburban postcodes, east of the Itchen and along the Shirley corridor, have been quieter performers than SO14 but more consistent than SO17.
Monthly Property Sales in Southampton
Southampton records 199 property transactions per month across six postcodes, ranging from 21 in SO14 and SO17 to 48 in SO19. Transaction volumes tell you which areas have the deepest buyer pools. If you need to sell, can you? High volume and high turnover mean a liquid market. Low volume means you may wait. The lowest turnover rate is SO14 at 11%, indicating a large stock of properties that rarely comes to market.
| Area | Sales Per Month | Turnover | Asking Price |
|---|---|---|---|
| SO19 (Sholing, Woolston) | 48 | 18% | £262,799 |
| SO16 (Bassett, Lordshill) | 41 | 27% | £305,281 |
| SO15 (Shirley, Millbrook) | 38 | 23% | £238,570 |
| SO18 (Bitterne Park) | 30 | 14% | £288,971 |
| SO17 (Portswood, Highfield) | 21 | 33% | £252,208 |
| SO14 (City Centre, St Marys) | 21 | 11% | £216,516 |
SO19 Sholing leads on volume at 48 sales per month but with a turnover of just 18%. A large pool of housing stock and steady demand from families moving east of the River Itchen keep transaction numbers high. For exit strategy planning, SO19 and SO16 offer the strongest combination of volume and turnover. If you need to realise an investment, these postcodes have the deepest buyer pools in Southampton.
SO17 shows 33% turnover from just 21 monthly sales. That is the highest turnover rate in the city from the lowest volume (tied with SO14). A smaller total stock means properties change hands more frequently as a proportion of what is available. In a student-dominated postcode, this reflects landlords buying and selling investment stock rather than owner-occupier churn.
SO14 at 11% turnover is the stickiest postcode. Properties in the city centre rarely come to market. That low turnover combined with 21 sales per month and 8.3% one-year growth suggests demand is outstripping supply. If the Town Quay development adds 400+ flats to this postcode over the next four years, the supply dynamic may shift.

Southampton Rental Market Analysis
For investors weighing up whether rental property is a worthwhile investment in Southampton, the data below breaks down average monthly rents and gross rental yields across the city's postcodes.
Rental data is available for all 6 postcodes. Monthly rents range from £1,106 in SO18 to £1,890 in SO17 and gross yields range from 4.6% to 9.0%. If you are looking to build a property portfolio in the South East, or searching for buy-to-let properties, Southampton's combination of affordable asking prices and yields up to 9.0% is detailed in the data below.
Average Rent & Gross Rental Yields in Southampton
SO17 delivers Southampton's highest gross yield at 9.0%, where monthly rents of £1,890 meet asking prices of £252,208. Gross rental yield is calculated from the average asking price and average monthly rent for each postcode. It does not account for void periods, maintenance, management fees, or mortgage costs.
At the other end, SO18 Bitterne Park at 4.6% reflects higher asking prices absorbing moderate absolute rents. The yield spread across Southampton is 4.4 percentage points, a wide range for a six-postcode city. That gap separates postcodes that cash-flow strongly from those that depend on capital growth.
| Area | Average Monthly Rent | Average Asking Price | Gross Yield |
|---|---|---|---|
| SO17 (Portswood, Highfield) | £1,890 | £252,208 | 9.0% |
| SO14 (City Centre, St Marys) | £1,299 | £216,516 | 7.2% |
| SO15 (Shirley, Millbrook) | £1,367 | £238,570 | 6.9% |
| SO19 (Sholing, Woolston) | £1,173 | £262,799 | 5.4% |
| SO16 (Bassett, Lordshill) | £1,340 | £305,281 | 5.3% |
| SO18 (Bitterne Park) | £1,106 | £288,971 | 4.6% |
Three postcodes sit above 6.5% gross yield: SO17, SO14, and SO15. Each taps into a different tenant pool. SO17 Portswood draws students and university staff. SO14 City Centre attracts young professionals and port workers. SO15 Shirley serves a mix of families and key workers.
SO17's 9.0% yield needs context. This is the highest figure in the city by a wide margin, but it sits alongside -18.3% one-year price decline and -5.7% five-year growth. The yield calculation is partly driven by falling asking prices pushing the denominator down. Monthly rents at £1,890 are the highest in Southampton, likely reflecting HMO and shared house rents rather than single-let tenancies. The headline yield is real, but the growth data tells a different story.
SO18 at 4.6% delivers the lowest yield but the strongest recent price appreciation at 5.5% one-year. Bitterne Park attracts family tenants willing to pay moderate rents for larger suburban properties. The yield is compressed by asking prices of £288,971. Investors here are typically holding for long-term appreciation rather than monthly cash flow.
Is Southampton Rent High?
Across all six Southampton postcodes, rent ranges from 35.8% to 61.1% of the local median gross monthly salary of £3,094. That matters from both sides. For tenants, it determines whether they can sustain payments long-term. For landlords, areas where rent consumes a lower share of income tend to produce more reliable tenants and fewer arrears.
The median gross weekly salary in Southampton is £714.00, which equates to £3,094 per month or £37,130 per year. This is below the South East regional median of £800.30 per week and the Great Britain median of £752.40 per week. Data from the Nomis Labour Market Profile (ASHE 2025).
Every postcode exceeds the 30% benchmark where rent starts to look stretched. That reflects Southampton's position as a relatively low-wage city within the high-cost South East. Rents are not unusually high in absolute terms. It is the combination of moderate rents against below-average local wages that pushes the ratios up.
| Rank | Area | Rent as % of Income |
|---|---|---|
| 1 | SO17 (Portswood, Highfield) | 61.1% |
| 2 | SO15 (Shirley, Millbrook) | 44.2% |
| 3 | SO16 (Bassett, Lordshill) | 43.3% |
| 4 | SO14 (City Centre, St Marys) | 42.0% |
| 5 | SO19 (Sholing, Woolston) | 37.9% |
| 6 | SO18 (Bitterne Park) | 35.8% |
SO17 at 61.1% is an extreme figure that needs context. The £1,890 monthly rent reflects the HMO and shared house market near the University of Southampton. Individual tenants in shared properties pay a fraction of that headline figure. The median salary calculation uses a city-wide number that understates what professional sharers and postgraduate tenants actually earn. The 61.1% figure is a mathematical artefact of the aggregation method, not a real measure of tenant stress in this postcode.
SO18 at 35.8% and SO19 at 37.9% have the lowest rent-to-income ratios in the city. These east-of-Itchen suburbs attract family renters on moderate incomes. The ratios sit above 30% but not dramatically. For investors, tenant affordability in these postcodes is manageable, which translates into lower arrears risk and longer tenancies.
Thinking of Buying?
We have off-market investment properties averaging 8%+ annual yield.
View Property DealsBuy-to-Let Considerations
Are Southampton House Prices High? Price-to-Earnings Ratios
Purchasing a property in Southampton requires between 5.8 and 8.2 times the local median annual salary of £37,130. The national benchmark is 7.5x, calculated from England's average sold price of £291,865 against Great Britain's median annual salary of £39,125. Four of Southampton's six postcodes sit below that benchmark. Salary data from the Nomis Labour Market Profile for Southampton (ASHE 2025).
SO14, SO15, and SO17 all come in at 6.8x or below. SO19 at 7.1x sits just below. The range is narrow enough that all six postcodes remain within reach of investors using standard buy-to-let mortgage products.
| Rank | Area | Price-to-Earnings Ratio |
|---|---|---|
| 1 | SO14 (City Centre, St Marys) | 5.8x |
| 2 | SO15 (Shirley, Millbrook) | 6.4x |
| 3 | SO17 (Portswood, Highfield) | 6.8x |
| 4 | SO19 (Sholing, Woolston) | 7.1x |
| 5 | SO18 (Bitterne Park) | 7.8x |
| 6 | SO16 (Bassett, Lordshill) | 8.2x |
SO14 at 5.8x is the most affordable postcode relative to local earnings. It also delivers a 7.2% yield, the second highest in the city, and the strongest one-year growth at 8.3%. That combination of low price-to-earnings, high yield, and positive growth momentum appears across multiple data tables in this guide.
SO16 at 8.2x is the most stretched, reflecting the Bassett and Lordshill premium. Higher-value family housing in the north and west of this postcode pushes asking prices to £305,281, well above what the local median salary would suggest. Buyers here are typically dual-income households or owner-occupiers rather than entry-level investors.
Deposit Requirements in Southampton
Southampton's 30% deposit requirements range from £64,955 in SO14 to £91,584 in SO16. That is a £27,000 spread from cheapest to most expensive, keeping every postcode within a similar bracket. Most buy-to-let lenders require a minimum 25% deposit. The table below uses a more conservative 30% to reflect the rates and products available at higher loan-to-value ratios. Investors who might be priced out of Reading (mean asking £415,265) or Brighton (£420,745) can access Southampton's entire market with a deposit under £92,000.
| Rank | Area | 30% Deposit Required |
|---|---|---|
| 1 | SO14 (City Centre, St Marys) | £64,955 |
| 2 | SO15 (Shirley, Millbrook) | £71,571 |
| 3 | SO17 (Portswood, Highfield) | £75,662 |
| 4 | SO19 (Sholing, Woolston) | £78,840 |
| 5 | SO18 (Bitterne Park) | £86,691 |
| 6 | SO16 (Bassett, Lordshill) | £91,584 |
SO14 and SO15 at £64,955 and £71,571 require the two lowest deposits in the city. SO14 at £64,955 has the lowest deposit in the city alongside a 7.2% yield, the lowest asking price, lowest price per square foot, and the strongest one-year growth. The extra £6,600 to step up to SO15 buys access to a 6.9% yield and 15.5% five-year growth. Both postcodes sit in the sub-£72,000 deposit bracket that makes Southampton accessible to investors with moderate capital.
SO17 at £75,662 is the third cheapest deposit but comes with the highest yield at 9.0%. The trade-off is price decline. SO17 has lost 18.3% in the past year and 5.7% over five years. An investor depositing £75,662 today is buying into a postcode where the capital base has been falling. The rental income is strong, but the asset value has moved against recent buyers. For investors exploring lower entry costs, repossessed houses for sale occasionally appear in SO14 and SO15 at discounts to asking prices.
Deposit is only part of the upfront cost. Budget for stamp duty (use our stamp duty calculator for an accurate figure), legal fees, and survey costs. For a full breakdown, see our guide to buy-to-let costs. Southampton's prices also sit in the range where below market value properties appear regularly, particularly in SO14 and SO15. For creative finance options, see our guide to investment property with no deposit.

What the Southampton Data Tells Buy-to-Let Investors
For yield, the numbers favour SO17 (9.0%), SO14 (7.2%), and SO15 (6.9%). All three sit below 6.8x price-to-earnings with 30% deposits between £64,955 and £75,662. SO14 has the additional advantage of the strongest one-year growth (8.3%) and the lowest entry cost. SO15 delivers a balanced combination of yield and growth. SO17 has the headline yield, but the -18.3% one-year decline reduces the total return calculation.
For growth, the suburban postcodes lead. SO19 (16.1%), SO15 (15.5%), and SO18 (14.7%) delivered the strongest five-year appreciation. These are family-oriented areas east of the Itchen and along the Shirley corridor. None of them offer yields above 7%, so for buy-to-let in Southampton, there is a clear split between yield-led postcodes (SO17, SO14) and growth-led postcodes (SO19, SO15, SO18).
SO16 and SO17 both show negative three-year growth. SO16 at -3.4% and SO17 at -12.2%. These are the two postcodes at opposite ends of the price spectrum. SO16 is the most expensive in the city and may be at a ceiling relative to local wages. SO17 is correcting from pandemic-era overpricing in the student market.
Southampton City Council operates a selective licensing scheme in parts of the city. Licensing requirements vary by property and can be checked with the council before purchase. For current investment properties across the South East, including Southampton, we regularly list stock from local agents and developers.
How Southampton Buy-to-Let Compares to Nearby Areas
Investors looking at Southampton are typically also considering other South East and South Coast cities. The table below compares Southampton against four nearby locations using the same methodology: mean asking price across all postcodes, mean monthly rent across postcodes with data, and top single-postcode gross yield.
| Location | Mean Asking Price | Mean Monthly Rent | Top Gross Yield |
|---|---|---|---|
| Southampton | £260,724 | £1,362 | 9.0% |
| Portsmouth | £284,807 | £1,351 | 7.0% |
| Bournemouth | £355,164 | £1,408 | 7.7% |
| Reading | £415,265 | £1,603 | 6.1% |
| Brighton | £420,745 | £1,825 | 6.6% |
Southampton has the lowest mean asking price in this group by £24,000 and the highest top yield by 1.3 percentage points. That yield gap is driven by SO17's 9.0% figure. Without it, Southampton's next best yield of 7.2% (SO14) would still sit above both Reading (6.1%) and Brighton (6.6%). The entry price difference is significant. Southampton's mean asking of £260,724 means a 30% deposit of £78,217, compared to £124,580 for Reading and £126,224 for Brighton.
Portsmouth is the closest comparison. Similar rents (£1,351 vs £1,362), similar location on the South Coast, but £24,000 more expensive on mean asking price. Southampton's yield advantage comes from lower asking prices rather than higher rents. Portsmouth's top yield of 7.0% comes without the student-driven volatility of Southampton's SO17.
Reading and Brighton command significantly higher asking prices with lower top yields. Both cities benefit from London commuter demand that pushes entry costs beyond what most income-focused investors can justify. For investors comparing South East cities on the best buy-to-let areas list, Southampton has the lowest mean asking price and the highest top yield in this group.
Frequently Asked Questions
How does Southampton compare to Portsmouth for buy-to-let?
Southampton has a lower mean asking price (£260,724 vs £284,807), a higher top yield (9.0% vs 7.0%), and similar mean monthly rents (£1,362 vs £1,351). Southampton's top yield is driven by SO17, the university postcode, which has negative price growth. Portsmouth's yield spread is narrower and comes without that student-market volatility.
Portsmouth has six postcodes with five providing rental data. Southampton's entry deposit starts at £64,955 (SO14) while Portsmouth's equivalent is approximately £75,000. The two cities are 20 miles apart and serve overlapping tenant pools, with Portsmouth's naval base providing a different employment anchor to Southampton's commercial port.
Is student accommodation a factor in Southampton's rental market?
Around 35,000 students from two universities create significant rental demand. The University of Southampton has approximately 24,000 students, and Solent University adds another 11,000. The student population is concentrated in SO17 (Portswood, Highfield) and parts of SO14 (City Centre), which are also the two highest-yielding postcodes at 9.0% and 7.2%.
Student demand drives the HMO and shared house market in these areas. The headline rent figures in this guide reflect postcode averages across all property types. For room-by-room HMO lets, per-tenant costs are lower. For a broader view of the sector, see our guide to purpose-built student accommodation.
What will the Town Quay development do to Southampton's property market?
The £230m scheme adds over 400 flats, a 128-room hotel, and a 300-berth marina to the SO14 waterfront. It received planning approval in March 2025 and will be delivered in two phases over four years.
SO14 currently has the lowest asking price (£216,516) and the strongest one-year growth (8.3%) in the city. Adding 400+ flats to a postcode with 21 monthly sales and 11% turnover will increase supply significantly. Whether that new supply absorbs into existing demand or compresses existing values depends on pricing and build quality. The Bargate Quarter is also adding 519 units to the city centre at the same time.
Can I find buy-to-let property in Southampton under £150,000?
Individual flats in SO14 and SO15 do list below £150,000. The Land Registry average for flats in Southampton is £153,577, and smaller one-bedroom flats and ex-local authority stock in the city centre regularly fall within this range. At that price point, a 30% deposit is under £45,000.
Lease length, service charges, and building condition vary significantly at the lower end of the market. Investors looking for stock at this level may also consider off-market property sources where competition is lower.
Why is SO17 showing such high yields but falling prices?
The yield calculation explains it. SO17 delivers 9.0% because monthly rents of £1,890 are divided by an asking price that has fallen 18.3% in one year and 5.7% over five years. When the asking price falls while rents hold steady, the yield figure increases mechanically.
The £1,890 rent reflects the shared housing and HMO market near the University of Southampton, where per-property rents are higher than single-let equivalents. The price correction likely reflects a post-pandemic adjustment, where student property values surged during 2020-2022 and are now returning to pre-pandemic levels. SO17's yield is real income, but the capital position has weakened.