Where to Buy Property Investments in Warrington: Yields of 4.7%
Warrington's top postcode delivers a gross rental yield of 4.7%, with average sold prices sitting 13.7% below the England average. The borough's population grew 4.3% between the 2011 and 2021 Census to 210,974 residents, driven by sustained housing development and the town's position as one of the North West's leading employment centres.
Six postcodes cover the Warrington buy-to-let market, with asking prices ranging from £234,535 in WA2 to £461,411 in WA13. Monthly rents span £878 to £1,305 across all six postcodes, and a 30% deposit starts from £70,361. Investors searching for buy-to-let properties for sale in the North West will find Warrington positioned between Manchester and Liverpool, with direct rail links to both city centres.
Warrington is a unitary authority (ONS code E06000007) sitting at the junction of the M6, M56, and M62 motorways. The borough borders St Helens to the west and stretches from the industrial areas north of the Manchester Ship Canal to the Cheshire villages of Lymm and Appleton in the south. This guide analyses six postcodes: WA1 (Town Centre, Latchford), WA2 (Orford, Padgate), WA3 (Birchwood, Culcheth), WA4 (Stockton Heath, Appleton), WA5 (Great Sankey, Penketh), and WA13 (Lymm).
Article updated: March 2026
Warrington Buy-to-Let Market Overview 2026
Warrington combines above-average local earnings with prices 13.7% below the England average, creating a tenant-friendly rental market across six postcodes.
- Average sold price: £251,903 (13.7% below England's £291,865)
- Asking price range: £234,535 (WA2) to £461,411 (WA13)
- Rental yields: 3.4% (WA13) to 4.7% (WA5) across 6 postcodes with rental data
- Rental income: Monthly rents from £878 (WA2) to £1,305 (WA13)
- Price per sq ft: House prices from £218/sq ft (WA2) to £362/sq ft (WA13)
- Market activity: Sales ranging from 14 per month (WA13) to 54 per month (WA5)
- Deposit requirements: 30% deposits range from £70,361 (WA2) to £138,423 (WA13)
- Affordability ratios: Property prices from 5.8 to 11.4 times Warrington's median annual salary of £40,380
Contents

-
by Robert Jones, Founder of Property Investments UK
With two decades in UK property, Rob has been investing in buy-to-let since 2005, and uses property data to develop tools for property market analysis.

Property Data Sources
Our location guide relies on diverse, authoritative datasets including:
- HM Land Registry UK House Price Index
- Ministry of Housing, Communities and Local Government
- Ordnance Survey Data Hub
- Propertydata.co.uk
We update our property data quarterly to ensure accuracy. Last update: March 2026. All data is presented as provided by our sources without adjustments or amendments.
Why Invest in Warrington?
Warrington's population reached 210,974 at the 2021 Census, a growth of 4.3% from 202,228 in 2011. The borough has expanded consistently since its designation as a New Town in 1968, with major housing estates across Great Sankey, Birchwood, and Westbrook driving residential growth over six decades.
The median annual salary for Warrington residents is £40,380, placing it above both the North West regional median (£37,445) and the Great Britain median (£39,125). This earning power reflects the concentration of financial and professional services, nuclear energy operations, and logistics businesses across the borough. Birchwood Park alone employs thousands in technology and professional services. The employment rate stands at 75.8%. Warrington's combination of above-average earnings, strong transport links, and ongoing regeneration creates a distinct investor profile. Those considering different property investment strategies will find the data below identifies which postcodes align with specific approaches.
Warrington Economic Summary
- Population: 210,974 (2021 Census). Growth of 4.3% from 2011.
- Median annual salary: £40,380 (Warrington), £37,445 (North West), £39,125 (Great Britain)
- Employment rate: 75.8% (Warrington)
- Key employment sectors: Financial and professional services, nuclear energy, logistics and distribution, advanced manufacturing
Source: ONS Census 2021, Nomis Labour Market Profile (ASHE 2025)
Regeneration and Investment in Warrington
Three major programmes are reshaping Warrington's economic landscape, with combined investment running into hundreds of millions of pounds.
- Fiddler's Ferry Power Station (Phase 1 underway, multi-billion pound long-term programme): Peel NRE's masterplan for the 820-acre former power station site includes 1,760+ homes, 1.5 million sq ft employment space, and parkland across a 10-15 year build. The employment-led development is projected to support 845 jobs in Phase 1 alone, creating sustained demand in surrounding postcodes. Updates at Fiddler's Ferry.
- Warrington Town Centre (Under construction, £190 million): The 90-acre regeneration programme delivered 359 apartments at Steelworks (completed October 2024), with 900 further homes planned at Cockhedge and ongoing public realm improvements. The Station Quarter location benefits from direct rail access to Manchester and Liverpool. Updates at Warrington Borough Council.
- Central 6 Regeneration Masterplan (In delivery, £22 million): A 20-year programme improving six inner Warrington neighbourhoods through community hubs, sports facilities, cycling infrastructure, and housing renewal. Neighbourhood-level investment supports long-term liveability and tenant retention in postcodes WA1, WA2, and WA5. Updates at Warrington Borough Council.

Warrington Property Market Analysis
Warrington is a unitary authority, so all sold property prices from HM Land Registry are recorded at this level.
When was the last house price crash in Warrington?
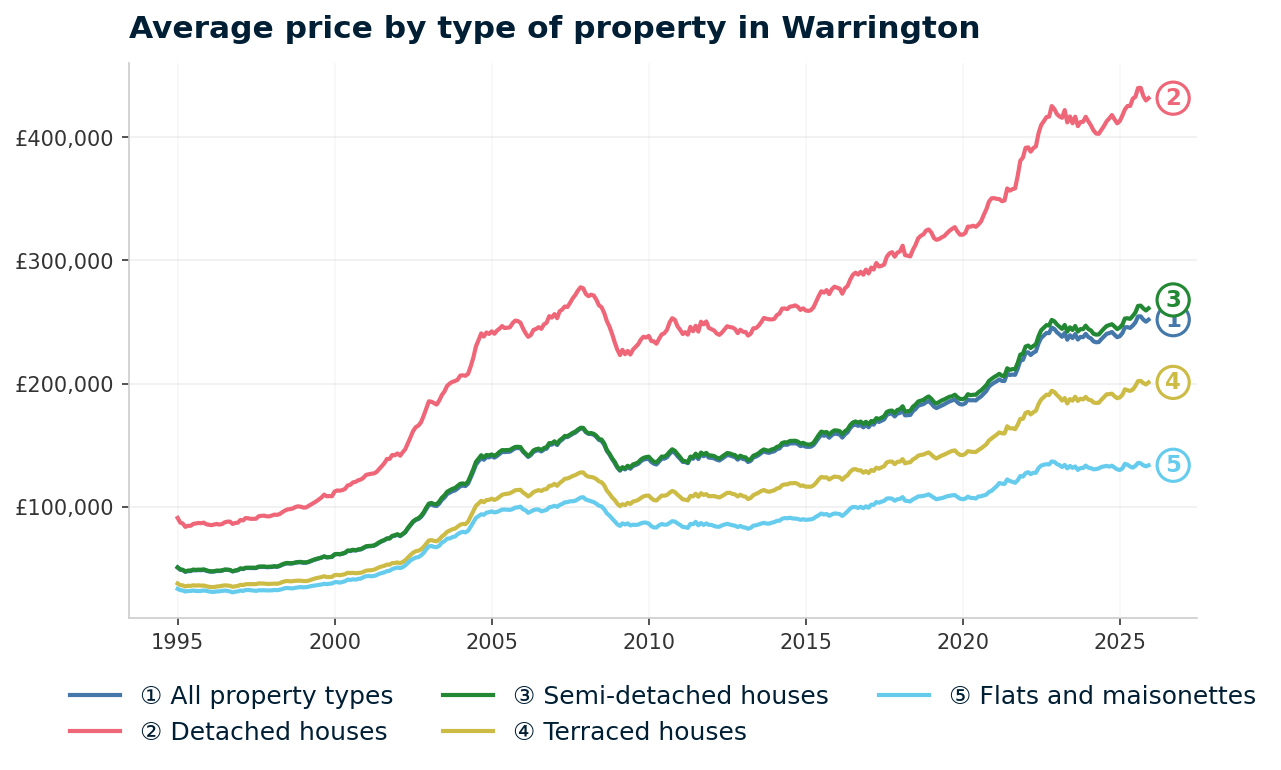
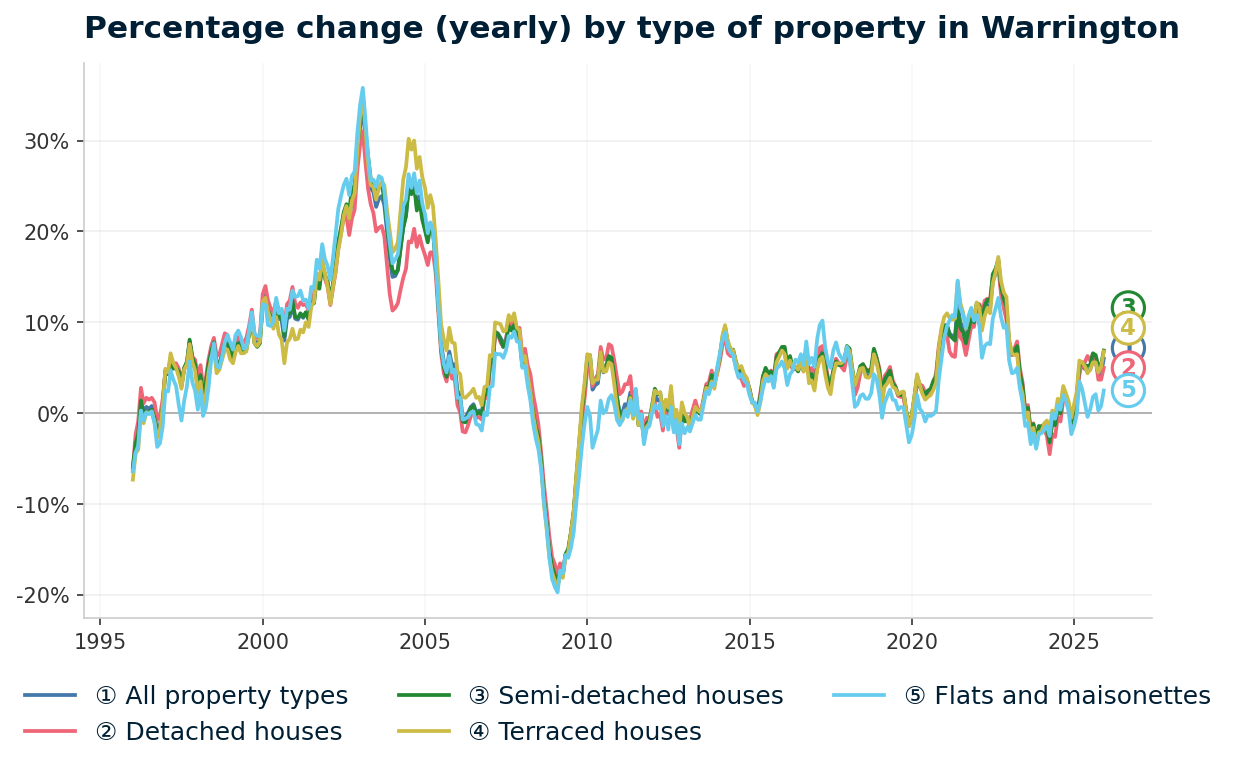
Warrington's average house price stood at £50,509 in January 1995. Over the following twelve years, prices more than tripled to reach £163,419 by November 2007. The strongest growth came between 2001 and 2004, when annual gains exceeded 20%. By 2006, growth had slowed to 2.5% as affordability constraints took hold.
The 2008 financial crisis hit Warrington harder than the national average. Prices fell 20.9% from the November 2007 peak of £163,419 to a trough of £129,198 in February 2009. The worst annual change reading was -18.8% (February 2009). England declined 18.2% peak-to-trough (September 2007 to March 2009), with a worst annual change of -15.5%. The North West region fell 18.3% from its December 2007 peak to a trough in January 2013, with a worst annual change of -14.0%.
After an initial bounce to £138,847 in January 2010, Warrington prices drifted sideways for three years. By January 2013, the average stood at £138,680, still 15.1% below the pre-crash peak. The North West as a whole reached its trough later, in January 2013, at £115,931.
Sustained growth returned in 2014, with annual gains above 4%. Warrington's average price crossed the pre-crash peak in June 2016 at £163,801, taking 8 years and 7 months from peak to full recovery. England recovered faster, regaining its September 2007 peak by May 2014 (6 years 8 months). The North West took until May 2017 (9 years 5 months).
Steady 3-5% annual growth between 2017 and 2019 pushed the average to £183,815 by January 2019. The M62 corridor's continuing economic development and Warrington's role as a major employment hub supported demand through this period.
The pandemic period saw the sharpest acceleration in Warrington's price history. Annual gains hit 11.9% in June 2021 and 11.7% in June 2022. Prices surged from £183,000 (January 2020) to £232,784 (June 2022), a 27.2% increase in two and a half years. The stamp duty holiday and demand for suburban space fuelled this growth.
Growth stalled as mortgage rates rose through 2023. The average dipped to £239,239 by June 2023 (+2.8% annual) and fell to £237,744 by January 2024 (-1.6% annual), marking two consecutive quarters of negative year-on-year readings.
Prices recovered through 2024 and into 2025. The latest Land Registry data (December 2025) records Warrington's average at £251,903, with annual growth of +6.0%. This outpaces both the England average (+1.7%) and the North West region (+4.5%).
Long-term growth summary:
- 5 years (2020-2025): +26.4% (£199,319 to £251,903)
- 10 years (2015-2025): +58.1% (£159,351 to £251,903)
- 15 years (2010-2025): +78.5% (£141,093 to £251,903)
- 20 years (2005-2025): +70.7% (£147,582 to £251,903)
- 30 years (1995-2025): +426.5% (£47,849 to £251,903)
The 20-year return (70.7%) is lower than the 15-year return (78.5%) because December 2005 prices (£147,582) were higher than December 2010 (£141,093). The 2008 crash dragged values below their 2005 level, creating a lower starting base for the 15-year calculation. The full price history shows Warrington tracking the wider 18-year property cycle with amplified peaks and deeper troughs than the national average.
Source: HM Land Registry House Price Index for Warrington, January 1995 to December 2025.
Thinking of Buying?
We have off-market investment properties averaging 8%+ annual yield.
View Property DealsSold House Prices in Warrington
Warrington's average sold price stands at £251,903, sitting 13.7% below the England average of £291,865 (HM Land Registry, December 2025). The discount varies significantly by property type. The gap is narrowest for detached houses (8.4% below England) and widest for flats and maisonettes (39.1% below). Warrington sits above the North West regional average of £217,428.
| Property Type | Warrington Average | England Average | Difference |
|---|---|---|---|
| Detached houses | £431,875 | £471,667 | -8.4% |
| Semi-detached houses | £261,128 | £289,135 | -9.7% |
| Terraced houses | £200,942 | £244,830 | -17.9% |
| Flats and maisonettes | £133,609 | £219,340 | -39.1% |
| All property types | £251,903 | £291,865 | -13.7% |
Detached houses in Warrington average £431,875, just 8.4% below the England figure of £471,667. This narrow gap reflects Warrington's premium southern postcodes. WA4 (Stockton Heath, Appleton) and WA13 (Lymm) account for the bulk of detached sales, with prices in these areas comparable to wider Cheshire levels. One-year growth for detached properties runs at +5.0%, outpacing England's +0.9%.
Semi-detached houses average £261,128 (9.7% below England's £289,135) and have recorded the strongest annual growth of any property type at +6.9%. Semi-detached homes represent the core of Warrington's housing stock, particularly across WA1, WA2, WA3, and WA5. England's equivalent growth is +3.3%.
Terraced houses at £200,942 sit 17.9% below the England average of £244,830, with annual growth of +6.8%. The terraced market is concentrated in inner Warrington (WA1, WA2) where entry prices are lowest. England's terraced growth is +2.9%.
Flats and maisonettes show the widest discount at 39.1% below England (£133,609 vs £219,340). Warrington has limited apartment stock compared to city centre markets. One-year growth is +2.5% against England's -1.8%, meaning Warrington flats are appreciating while the national flat market contracts.
Property Data Sources
Our location guide relies on diverse, authoritative datasets including:
- HM Land Registry UK House Price Index
- Ministry of Housing, Communities and Local Government
- Ordnance Survey Data Hub
- Propertydata.co.uk
We update our property data quarterly to ensure accuracy. Last update: March 2026. All data is presented as provided by our sources without adjustments or amendments.
Price Per Square Foot in Warrington
Price per square foot ranges from £218 in WA2 to £362 in WA13, a spread of 66%. This metric strips out the effect of property size, showing what buyers actually pay per unit of space. The ranking broadly mirrors the asking price hierarchy, with the premium southern postcodes commanding the highest rates.
| Rank | Area | Price Per Sq Ft |
|---|---|---|
| 1 | WA2 (Orford, Padgate) | £218 |
| 2 | WA1 (Town Centre, Latchford) | £249 |
| 3 | WA5 (Great Sankey, Penketh) | £271 |
| 4 | WA3 (Birchwood, Culcheth) | £276 |
| 5 | WA4 (Stockton Heath, Appleton) | £300 |
| 6 | WA13 (Lymm) | £362 |
WA13 (Lymm) commands a premium of £362 per square foot, 66% more than WA2's £218. Lymm is a village location with period properties and larger detached homes, which drives up the rate per square foot. WA2 (Orford, Padgate) offers the cheapest space in the borough, making it the natural starting point for investors seeking maximum square footage per pound.
For Sale Asking Prices in Warrington
Current asking prices in Warrington range from £234,535 in WA2 (Orford, Padgate) to £461,411 in WA13 (Lymm), with a mean of £311,729 across all six postcodes. The two cheapest postcodes (WA2 and WA1) are both priced below £250,000, offering entry points accessible for investors targeting below market value properties or renovation properties in established residential areas.
| Rank | Area | Average Asking Price |
|---|---|---|
| 1 | WA2 (Orford, Padgate) | £234,535 |
| 2 | WA1 (Town Centre, Latchford) | £241,854 |
| 3 | WA5 (Great Sankey, Penketh) | £279,227 |
| 4 | WA3 (Birchwood, Culcheth) | £293,453 |
| 5 | WA4 (Stockton Heath, Appleton) | £359,895 |
| 6 | WA13 (Lymm) | £461,411 |
The data divides into three pricing tiers. WA1 and WA2 form the entry level at £234,535 to £241,854. WA3 and WA5 sit in the mid-range at £279,227 to £293,453. WA4 and WA13 represent the premium market at £359,895 to £461,411. The gap between the cheapest and most expensive postcode is £226,876, reflecting Warrington's range from inner-urban terraces to village detached homes.

House Price Growth in Warrington
Five-year price growth in Warrington ranges from 10.4% in WA13 (Lymm) to 30.6% in WA1 (Town Centre, Latchford). The pattern is clear: the cheapest postcodes have grown the fastest. WA1 and WA2, the two lowest-priced areas, both recorded around 30% five-year growth. Warrington is among the fastest growing cities in the North West for property values over this period.
| Area | 1 Year | 3 Years | 5 Years |
|---|---|---|---|
| WA1 (Town Centre, Latchford) | +6.7% | +1.0% | +30.6% |
| WA2 (Orford, Padgate) | +4.1% | +1.9% | +29.5% |
| WA3 (Birchwood, Culcheth) | +6.8% | +6.8% | +23.0% |
| WA5 (Great Sankey, Penketh) | +1.8% | +0.9% | +19.3% |
| WA4 (Stockton Heath, Appleton) | +6.4% | +5.8% | +14.7% |
| WA13 (Lymm) | +0.5% | +4.3% | +10.4% |
WA1's 30.6% five-year growth represents approximately £56,700 in value on the current average of £241,854. WA3 (Birchwood, Culcheth) stands out with the strongest one-year reading at +6.8%, matching its three-year figure exactly, suggesting consistent momentum rather than a single-year spike. The premium postcodes (WA4, WA13) show more modest five-year returns of 10-15%, a common pattern where higher-value markets grow more slowly in percentage terms.
Monthly Property Sales in Warrington
Warrington records approximately 215 property transactions per month across its six postcodes. WA5 (Great Sankey, Penketh) is the most active market with 54 sales per month, while WA13 (Lymm) sees 14 sales monthly but with the highest stock turnover rate at 80%.
| Area | Sales Per Month | Stock Turnover | Asking Price |
|---|---|---|---|
| WA5 (Great Sankey, Penketh) | 54 | 18% | £279,227 |
| WA4 (Stockton Heath, Appleton) | 51 | 41% | £359,895 |
| WA3 (Birchwood, Culcheth) | 44 | 18% | £293,453 |
| WA2 (Orford, Padgate) | 29 | 24% | £234,535 |
| WA1 (Town Centre, Latchford) | 23 | 18% | £241,854 |
| WA13 (Lymm) | 14 | 80% | £461,411 |
WA4's 41% turnover rate and 51 monthly sales indicate a liquid market with strong demand across a broad price range. WA13's 80% turnover despite only 14 sales per month reflects a small housing stock in a desirable village where properties move quickly when listed. The higher-volume postcodes (WA3, WA4, WA5) each record over 40 transactions per month, providing greater exit flexibility for buy-to-let investors.
Property Data Sources
Our location guide relies on diverse, authoritative datasets including:
- HM Land Registry UK House Price Index
- Ministry of Housing, Communities and Local Government
- Ordnance Survey Data Hub
- Propertydata.co.uk
We update our property data quarterly to ensure accuracy. Last update: March 2026. All data is presented as provided by our sources without adjustments or amendments.

Warrington Rental Market Analysis
For investors weighing up whether rental property is a worthwhile investment in Warrington, the data below breaks down average monthly rents and gross rental yields across the borough's postcodes.
All six postcodes carry rental data, with monthly rents ranging from £878 to £1,305 and gross yields from 3.4% to 4.7%. If you are looking to build a property portfolio in the North West, Warrington's combination of above-average local earnings and established commuter demand creates a stable rental base.
Average Rent and Gross Rental Yields in Warrington
WA5 (Great Sankey, Penketh) tops Warrington's rental yield rankings at 4.7%, combining a monthly rent of £1,100 with an asking price of £279,227. The table below shows rent, asking price, and yield for all six postcodes. Understanding how to work out rental yield helps when comparing these figures across different locations.
| Area | Average Monthly Rent | Average Asking Price | Gross Yield |
|---|---|---|---|
| WA5 (Great Sankey, Penketh) | £1,100 | £279,227 | 4.7% |
| WA1 (Town Centre, Latchford) | £899 | £241,854 | 4.5% |
| WA2 (Orford, Padgate) | £878 | £234,535 | 4.5% |
| WA4 (Stockton Heath, Appleton) | £1,248 | £359,895 | 4.2% |
| WA3 (Birchwood, Culcheth) | £978 | £293,453 | 4.0% |
| WA13 (Lymm) | £1,305 | £461,411 | 3.4% |
The yield spread between WA5 (4.7%) and WA13 (3.4%) is 1.3 percentage points. This is a narrow range compared to cities with high-yield pockets. Warrington's yields cluster in the 3.4% to 4.7% band, reflecting its character as a mid-market commuter town rather than a city with sharp postcode-level contrasts. WA13 (Lymm) commands the highest monthly rent at £1,305, but its £461,411 asking price pulls the yield down to 3.4%.
Is Warrington Rent High?
The median gross weekly salary in Warrington is £776.50, which equates to £3,365 per month or £40,380 per year. This is above the North West regional median of £720.10 per week and the Great Britain median of £752.40 per week. Data from the Nomis Labour Market Profile (ASHE 2025).
Rents in Warrington absorb between 26.1% and 38.8% of the local median gross monthly income. The table below shows the ratio for each postcode.
| Rank | Area | Rent as % of Income |
|---|---|---|
| 1 | WA2 (Orford, Padgate) | 26.1% |
| 2 | WA1 (Town Centre, Latchford) | 26.7% |
| 3 | WA3 (Birchwood, Culcheth) | 29.1% |
| 4 | WA5 (Great Sankey, Penketh) | 32.7% |
| 5 | WA4 (Stockton Heath, Appleton) | 37.1% |
| 6 | WA13 (Lymm) | 38.8% |
No Warrington postcode crosses the 40% threshold where rent typically becomes a strain on household budgets. Even WA13 (Lymm) at 38.8% remains below that line. The four inner and mid-market postcodes (WA1, WA2, WA3, WA5) all sit below 33%, meaning tenants across much of Warrington retain significant disposable income after rent. This positions Warrington's rental market as more affordable for tenants than many comparable North West locations.
Thinking of Buying?
We have off-market investment properties averaging 8%+ annual yield.
View Property DealsBuy-to-Let Considerations
Are House Prices High? Price-to-Earnings Ratios
Purchasing a property in Warrington requires between 5.8 and 11.4 times the median annual salary. This is based on the Nomis Labour Market Profile for Warrington showing the median gross annual income for Warrington residents is £40,380.
For context, the national benchmark (England average sold price of £291,865 divided by the Great Britain median salary of £39,125) gives a price-to-earnings ratio of 7.5. Four of Warrington's six postcodes sit below this national benchmark.
| Rank | Area | Price-to-Earnings Ratio |
|---|---|---|
| 1 | WA2 (Orford, Padgate) | 5.8 |
| 2 | WA1 (Town Centre, Latchford) | 6.0 |
| 3 | WA5 (Great Sankey, Penketh) | 6.9 |
| 4 | WA3 (Birchwood, Culcheth) | 7.3 |
| 5 | WA4 (Stockton Heath, Appleton) | 8.9 |
| 6 | WA13 (Lymm) | 11.4 |
WA2 at 5.8 and WA1 at 6.0 both sit well below the national benchmark of 7.5, making them the most affordable postcodes relative to local earnings. WA13's ratio of 11.4 reflects Lymm's premium pricing, where property values sit at village levels while the salary data covers the whole Warrington authority. The three mid-range postcodes (WA3, WA5, WA4) range from 6.9 to 8.9, straddling the national average.
Deposit Requirements in Warrington
A 30% deposit on a buy-to-let property in Warrington ranges from £70,361 in WA2 to £138,423 in WA13. The table below shows deposit requirements at 30% for each postcode. Use our stamp duty calculator and guide to buy-to-let costs to factor in the full acquisition cost.
| Rank | Area | 30% Deposit Required |
|---|---|---|
| 1 | WA2 (Orford, Padgate) | £70,361 |
| 2 | WA1 (Town Centre, Latchford) | £72,556 |
| 3 | WA5 (Great Sankey, Penketh) | £83,768 |
| 4 | WA3 (Birchwood, Culcheth) | £88,036 |
| 5 | WA4 (Stockton Heath, Appleton) | £107,968 |
| 6 | WA13 (Lymm) | £138,423 |
The £2,195 difference between WA2 (£70,361) and WA1 (£72,556) is minimal, and both postcodes carry identical yields of 4.5%. The jump to WA5 at £83,768 buys the borough's highest yield at 4.7%. For investors weighing deposit size against income, WA5 offers a measurably better return for an additional £13,407 over the cheapest entry point.

What the Warrington Data Tells Buy-to-Let Investors
WA5 (Great Sankey, Penketh) leads Warrington's yield rankings at 4.7%, with 54 sales per month and a 30% deposit of £83,768. The postcode combines the highest income return with the most active resale market in the borough. WA1 and WA2 offer marginally lower yields at 4.5% with the cheapest entry deposits under £73,000. These three postcodes account for the highest yields and lowest entry costs in Warrington, and each features on lists of investment properties in the North West.
WA1 and WA2 have delivered the strongest five-year capital growth at 30.6% and 29.5% respectively, despite being the two cheapest postcodes. WA3 (Birchwood, Culcheth) adds consistent three-year growth of 6.8%. The growth data and yield data do not converge on a single postcode. WA5 tops yield but ranks fourth for five-year growth at 19.3%.
WA13 (Lymm) and WA4 (Stockton Heath, Appleton) dominate on rent (£1,305 and £1,248 per month) but deliver the lowest yields at 3.4% and 4.2%. Their P/E ratios of 11.4 and 8.9 reflect premium pricing against local salary benchmarks. These postcodes show different characteristics to the rest of the borough: higher values, lower percentage yields, and in WA13's case, lower transaction volumes at 14 sales per month.
Licensing requirements vary by ward in Warrington. Details of any selective licensing schemes are available from Warrington Borough Council. Investors reviewing off-market property in the borough should check current licensing status before completing.
How Warrington Compares
Warrington's mean asking price of £311,729 positions it above Manchester (£266,893) and below Chester (£325,454) in the North West price hierarchy. The table below compares Warrington against four neighbouring markets on asking prices, rents, and top yields.
| Location | Average Asking Price | Average Monthly Rent | Top Gross Yield |
|---|---|---|---|
| Liverpool | £207,760 | £870 | 7.4% |
| Wigan | £227,201 | £892 | 5.6% |
| Manchester | £266,893 | £1,308 | 7.8% |
| Warrington | £311,729 | £1,068 | 4.7% |
| Chester | £325,454 | £1,095 | 4.8% |
Warrington's top yield of 4.7% sits at the lower end of this comparison group, with Liverpool (7.4%), Manchester (7.8%), Wigan (5.6%), and Chester (4.8%) all returning higher headline figures. Manchester's higher yield reflects its dense city-centre apartment market. Wigan offers the lowest entry price (£227,201) with meaningfully higher returns. Chester's similar yield to Warrington (4.8% vs 4.7%) comes at a higher asking price of £325,454.
Warrington's median salary of £40,380 is the second highest in the group (behind Chester at £41,486), meaning local tenants have more disposable income than in Liverpool (£37,788), Wigan (£37,377), or Manchester (£36,278). For investors comparing the best buy to let areas in the North West, Warrington's data profile combines the highest asking prices with the lowest top yield, but its tenant affordability metrics are among the strongest.
Frequently Asked Questions
Is Warrington a good place to invest in buy-to-let property?
Warrington's data shows a market with moderate yields (3.4% to 4.7%), prices 13.7% below the England average, and above-average local earnings of £40,380. Five-year growth ranges from 10.4% to 30.6% across its six postcodes, with the cheapest areas growing fastest. The borough records 215 property sales per month, indicating an active and liquid market. Three major regeneration programmes, including the 820-acre Fiddler's Ferry development, are projected to add significant housing stock and employment over the next decade.
What are the best areas to invest in Warrington?
Warrington's postcodes split into three investment tiers. WA1 (Town Centre, Latchford) and WA2 (Orford, Padgate) offer the lowest entry points under £242,000 with 4.5% yields and the strongest five-year growth around 30%. WA5 (Great Sankey, Penketh) delivers the highest yield at 4.7% with the most transactions (54 per month). WA3 (Birchwood, Culcheth) combines consistent growth with proximity to Birchwood Park's employment base. The premium postcodes, WA4 (Stockton Heath) and WA13 (Lymm), attract higher rents of £1,248 and £1,305 per month but return lower yields of 3.4% to 4.2%.
How does Warrington compare to Manchester for property investment?
Manchester's top yield of 7.8% significantly exceeds Warrington's 4.7%, driven by Manchester's dense city-centre apartment market. Manchester's mean monthly rent of £1,308 is higher than Warrington's £1,068, but Manchester's mean asking price is lower at £266,893 vs £311,729. Warrington's median salary (£40,380) exceeds Manchester's (£36,278), which means Warrington tenants allocate a smaller share of income to rent. The two markets serve different profiles: Manchester for rental income density, Warrington for tenant affordability and suburban demand.
When will Fiddler's Ferry affect Warrington house prices?
Fiddler's Ferry is a 10-15 year programme. Phase 1 is underway with cooling tower demolition running from late 2025 to 2027, followed by 1.5 million sq ft of employment floorspace supporting 845 jobs. The housing delivery of 1,760+ homes will arrive in later phases. The nearest residential postcodes, WA5 (Great Sankey, Penketh) and parts of WA1, will see the most direct effect from the employment-led development. Peel NRE has delivered major regeneration projects across the North West including TraffordCity and MediaCity UK in Salford.
Can I find buy-to-let property in Warrington for under £250,000?
Two postcodes have average asking prices below £250,000: WA2 (Orford, Padgate) at £234,535 and WA1 (Town Centre, Latchford) at £241,854. Both offer 4.5% gross yields and have recorded approximately 30% five-year growth. Individual properties will vary around these averages, so terraced houses and flats in these postcodes will often sit below the £200,000 mark. Options like rent to buy or repossessed properties may provide further routes to below-average pricing.