Where to Buy Property Investments in Bournemouth: Yields of 7.7%
Bournemouth is a coastal town in Dorset on England's south coast. Gross rental yields range from 2.9% to 7.7% across 12 postcodes with rental data, with BH9 delivering the highest returns. Average sold prices sit 6.1% above the England average, and the area's population grew 5.6% to 400,200 between the 2011 and 2021 censuses.
Bournemouth's average sold price of £309,673 places it above the England average of £291,865. That 6.1% premium reflects the south coast location. Yet asking prices start from £237,411 in BH1, and BH9 delivers a 7.7% gross yield that few coastal locations can match. Rental data is available for 12 of the area's 13 postcodes.
This guide covers all 13 Bournemouth postcodes from BH1 to BH12 plus BH23 (Christchurch) under the Bournemouth, Christchurch and Poole unitary authority (ONS code E06000058), created in 2019. Investors comparing options along the south coast may also consider Brighton or browse all our South West location guides. For buy-to-let property data from Bournemouth's neighbouring authority, see our Poole guide.
Article updated: March 2026
Bournemouth Buy-to-Let Market Overview 2026
Bournemouth offers south coast rental demand backed by two universities, a tourism economy, and asking prices that start well below the area average in the town centre postcodes.
- Average sold price: £309,673 (6.1% above England's £291,865)
- Asking price range: £237,411 (BH1) to £480,871 (BH3)
- Rental yields: 2.9% (BH7) to 7.7% (BH9) across postcodes with rental data
- Rental income: Monthly rents from £1,065 (BH7) to £2,279 (BH9)
- Price per sq ft: Sold prices from £293/sq ft (BH1) to £424/sq ft (BH23)
- Market activity: Sales ranging from 6 per month (BH3) to 70 per month (BH23)
- Deposit requirements: 30% deposits range from £71,223 (BH1) to £144,261 (BH3)
- Affordability ratios: Property prices from 6.3 to 12.8 times Bournemouth's median annual salary of £37,493
Contents

-
by Robert Jones, Founder of Property Investments UK
With two decades in UK property, Rob has been investing in buy-to-let since 2005, and uses property data to develop tools for property market analysis.

Property Data Sources
Our location guide relies on diverse, authoritative datasets including:
- HM Land Registry UK House Price Index
- Ministry of Housing, Communities and Local Government
- Ordnance Survey Data Hub
- Propertydata.co.uk
We update our property data quarterly to ensure accuracy. Last update: March 2026. All data is presented as provided by our sources without adjustments or amendments.
Why Invest in Bournemouth?
Bournemouth's rental market draws from two distinct demand pools totalling around 20,000 university students alongside a year-round tourism workforce. Bournemouth University has around 17,000 students and the Arts University Bournemouth adds a further 3,000. Students and recent graduates create consistent demand for shared housing in postcodes like BH9 (Winton, Moordown) and BH8 (Charminster). The second pool is tourism and hospitality. Bournemouth's seven miles of beaches make it one of the UK's most visited coastal resorts, supporting a year-round economy of hotels, restaurants, and seasonal workers who need short-term rental accommodation.
The wider BCP area also has a growing financial and professional services sector. JP Morgan Chase operates a significant technology hub in the area, alongside insurance and fintech firms clustered around the town centre and Lansdowne. Healthcare is another anchor employer, with Royal Bournemouth Hospital and Poole Hospital both part of University Hospitals Dorset.
Between the 2011 and 2021 censuses, the population of Bournemouth, Christchurch and Poole grew from 378,900 to 400,200, a rise of 5.6%. That is above the England average growth rate for the same period and reflects inward migration to the south coast.
Earnings in Bournemouth sit below both the regional and national averages. The median annual salary is £37,493, compared to £37,544 across the South West and £39,125 for Great Britain. Lower wages alongside higher property prices create a market where affordability is tighter than in many northern cities, but rental demand remains strong because of the student population, tourism workforce, and retiree migration patterns.
Bournemouth's employment rate of 77.3% sits below the South West average of 79.3% but above the Great Britain rate of 75.6%. The unemployment rate of 4.9% is higher than both the regional 3.3% and the national 4.3%. That gap partly reflects the seasonal nature of Bournemouth's tourism economy, where hospitality employment fluctuates between summer and winter.
Bournemouth Economic Summary
- Population: 400,200 (2021 Census). Growth of 5.6% from 2011.
- Median annual salary: £37,493 (Bournemouth, Christchurch and Poole), £37,544 (South West), £39,125 (Great Britain)
- Employment rate: 77.3% (Bournemouth, Christchurch and Poole), 79.3% (South West), 75.6% (Great Britain)
- Unemployment rate: 4.9% (Bournemouth, Christchurch and Poole), 3.3% (South West), 4.3% (Great Britain)
- Key employment sectors: Tourism and hospitality, higher education, financial services, healthcare, digital and creative
Source: ONS Census 2021, Nomis Labour Market Profile (ASHE 2025, Employment Oct 2024-Sep 2025)
Regeneration and Investment in Bournemouth
BCP Council's regeneration programme spans 11 brownfield sites across Bournemouth, Christchurch and Poole with a combined gross development value exceeding £2 billion. Three projects stand out for the scale of housing and employment they bring.
- Holes Bay Regeneration (in progress, 830 homes): A 40-acre former power station site on Poole Harbour, described as the South West's largest brownfield regeneration site. BCP Council has completed the purchase, backed by a £5m Local Growth Fund investment from Dorset LEP, and plans include employment land and commercial space alongside the housing. Updates at BCP Council.
- Winter Gardens Redevelopment (planning, £150m): A joint venture between BCP Council and Muse Developments to deliver approximately 500 homes, including affordable housing, plus retail and commercial space on the former Winter Gardens site in Bournemouth town centre. The cabinet approved the updated partnership plan in June 2025, with a Site Option Execution Date of September 2028. Updates at BCP Council Cabinet.
- Wessex Fields Medtech Science Park (planning, part of £250m UHD programme): A medtech science park adjacent to Royal Bournemouth Hospital, developed in partnership between BCP Council and University Hospitals Dorset. Plans include medical research facilities, key worker housing, and community facilities. A site masterplan is in development for 2026. Updates at BCP Council.

Bournemouth Property Market Analysis
When Was the Last House Price Crash in Bournemouth?
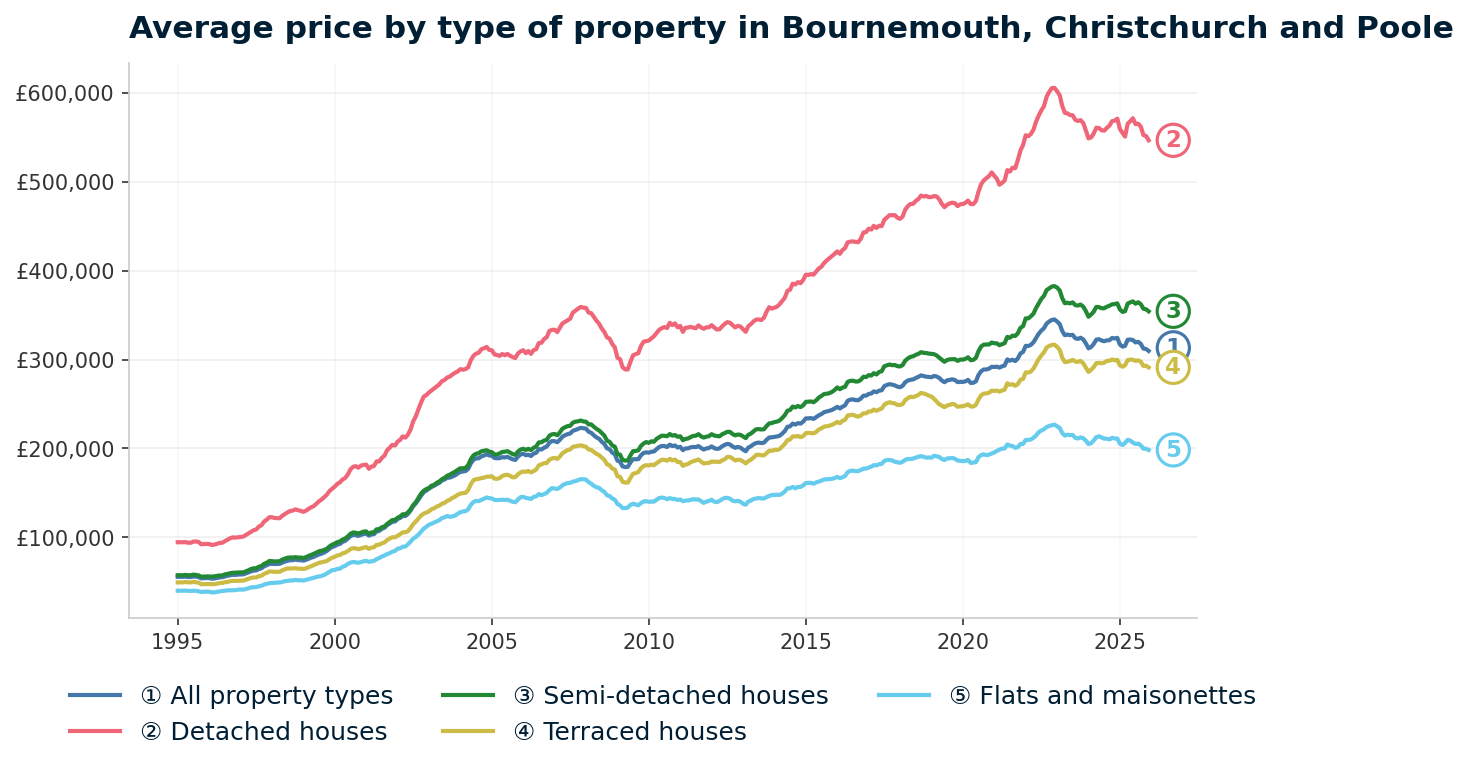
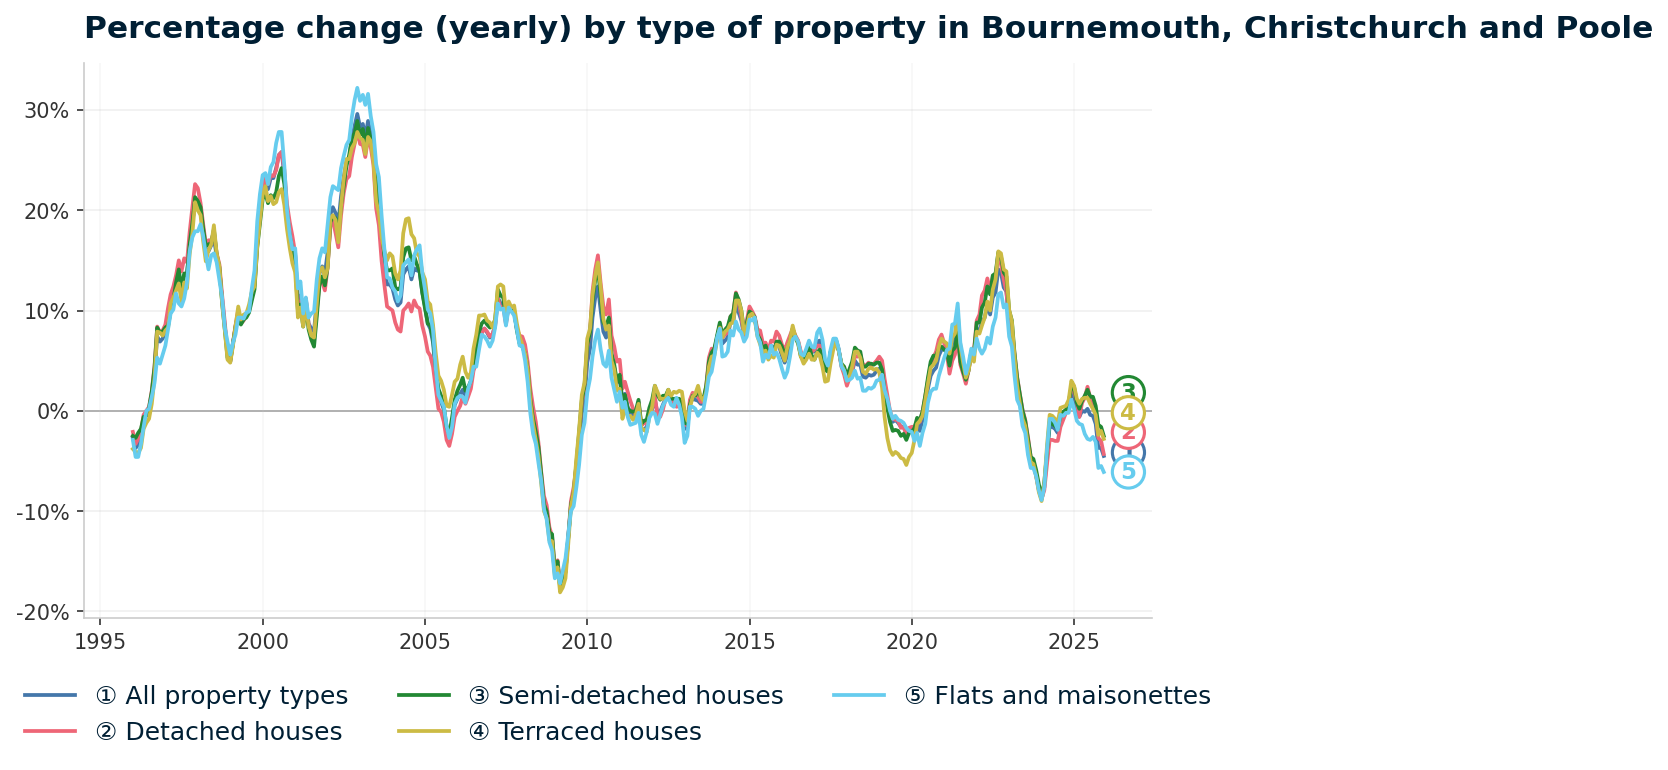
Bournemouth property prices have risen 458% since January 1995, from £55,465 to £309,673 at December 2025, but sit 10.3% below the pandemic peak of £345,134. Bournemouth sits within the Bournemouth, Christchurch and Poole unitary authority (created in 2019), so all sold property prices from the HM Land Registry House Price Index are reported at this combined level. The data covers the full authority area, including postcodes that fall under our separate Poole guide.
- 1995-2000 (Coastal boom begins): Bournemouth started 1995 at £55,465. By January 2000, prices had reached £90,120 with annual growth hitting 22.3%. The south coast property market caught the late 1990s boom earlier than many regional markets.
- 2000-2007 (The boom): Prices more than doubled from £90,120 in January 2000 to a peak of £223,171 in November 2007. The fastest growth came in 2002-2003, when annual change exceeded 28%. Cheap credit, buy-to-let expansion, and the lifestyle appeal of the south coast pushed prices well beyond what local wages could support.
- 2007-2009 (The financial crisis): From the peak of £223,171 in November 2007 to the trough of £179,039 in April 2009, Bournemouth lost 19.8% of its value in 17 months. The worst annual change reading was -17.4% in March 2009. Bournemouth's decline of 19.8% was broadly in line with the South West region (-19.4%) and slightly worse than England overall (-18.2%).
- 2009-2013 (Slow recovery): Prices bounced quickly off the trough. By December 2009, the average had recovered to £195,610. But then the market settled into a period of gradual growth. By December 2013, prices reached £212,482. Still 4.8% below the November 2007 peak.
- 2014-2016 (Passing the pre-crash peak): Growth accelerated from 2014. Prices finally surpassed the pre-crash peak in June 2014 at £224,321, taking approximately 6.5 years from the November 2007 high. By January 2016, the average had reached £246,749. The south coast lifestyle premium returned as London buyers began looking for value outside the capital.
- 2017-2019 (Pre-pandemic cooling): Prices continued rising from £261,318 in January 2017, but the pace slowed. By December 2019, the average stood at £274,959 with annual change dipping to -1.9%. The market was already cooling before the pandemic.
- 2020-2022 (Pandemic surge): The stamp duty holiday and remote working trend transformed Bournemouth. Prices surged from £277,118 in March 2020 to £345,134 by December 2022. That is 24.5% growth in under three years. Bournemouth's coastal location and quality of life made it a direct beneficiary of the pandemic lifestyle shift.
- 2023 (Rate shock): Interest rate rises hit hard. Prices fell from £345,134 in December 2022 to £318,322 by December 2023. A decline of 7.8% in a single year. Bournemouth's correction was sharper than the national average, reflecting the premium that pandemic buyers had paid.
- 2024-2025 (Continued adjustment): Prices stabilised briefly at £324,413 in December 2024 (annual growth of 1.9%), before falling again to £309,673 by December 2025 with annual change of -4.5%. Bournemouth's current price is 38.8% above its pre-crash peak but 10.3% below the pandemic high of December 2022.
In summary: one major crash (19.8% over 17 months), a 6.5-year recovery, a 24.5% pandemic surge, and a 10.3% correction that is still playing out.
Long-Term Property Value Growth in Bournemouth
- 5 years (2020-2025): +6.1% (£291,844 to £309,673)
- 10 years (2015-2025): +26.5% (£244,834 to £309,673)
- 15 years (2010-2025): +54.0% (£201,067 to £309,673)
- 20 years (2005-2025): +60.3% (£193,211 to £309,673)
- 30 years (1995-2025): +472.2% (£54,123 to £309,673)
The 2008 crash is the reference point: a 19.8% decline that took 6.5 years to recover. The more recent correction from the 2022 pandemic peak has been 10.3% over three years and the market has not yet stabilised. Bournemouth's structural drivers are different from 2007. The BCP unitary authority has a larger, more coordinated regeneration programme, and the two universities continue to grow. But the -4.5% annual change at December 2025 shows the market is still adjusting. Investors monitoring price declines may also track repossessed houses for sale as a source of below-market stock.
Source: HM Land Registry House Price Index for Bournemouth, Christchurch and Poole
Source: HM Land Registry House Price Index for Bournemouth, Christchurch and Poole, January 1995 to December 2025.
Thinking of Buying?
We have off-market investment properties averaging 8%+ annual yield.
View Property DealsSold House Prices in Bournemouth
Bournemouth's sold prices sit above the national average, which is unusual for a buy-to-let focused location. The headline figure of £309,673 is 6.1% above England's £291,865 and 2.8% above the South West's £301,226. But that premium is not uniform across property types. Flats are the exception.
Flats in Bournemouth, Christchurch and Poole average £198,290. That is 9.6% below the England average of £219,340. It is the only property type trading at a discount to the national market. The south coast flat stock includes a high proportion of purpose-built retirement apartments and older conversions, which trade at lower values than the new-build flat stock that inflates averages in London and other major cities.
| Property Type | Bournemouth Average | England Average | Difference |
|---|---|---|---|
| Detached houses | £546,702 | £471,667 | +15.9% |
| Semi-detached houses | £354,270 | £289,135 | +22.5% |
| Terraced houses | £291,215 | £244,830 | +18.9% |
| Flats and maisonettes | £198,290 | £219,340 | -9.6% |
| All property types | £309,673 | £291,865 | +6.1% |
Semi-detached houses carry the largest premium at 22.5% above England. Semis are the core family housing stock in Bournemouth's suburban postcodes like BH10 (Kinson, Northbourne) and BH12 (Branksome, Alderney). Owner-occupier demand on the south coast pushes semi prices substantially above the national average.
Terraced houses at £291,215 sit 18.9% above England. The Victorian and Edwardian terraces in BH1 (Town Centre), BH5 (Boscombe), and BH8 (Charminster) are among the more affordable property types in Bournemouth, but the south coast location lifts them well above what equivalent stock costs in northern or Midlands cities.
Detached houses average £546,702, a 15.9% premium over England. These are concentrated in the premium postcodes: BH3 (Talbot Woods), BH6 (Southbourne), and BH23 (Christchurch). The detached premium is smaller than for semis and terraces because the England detached average is already high at £471,667.
Flats at £198,290 represent the only entry point below the England average. For investors, that 9.6% discount creates a gap between Bournemouth's overall premium positioning and the actual cost of flat stock. Retirement apartments, older conversions, and ex-local authority flats keep the average down, creating an entry point in a market that otherwise trades above national benchmarks.
Property Data Sources
Our location guide relies on diverse, authoritative datasets including:
- HM Land Registry UK House Price Index
- Ministry of Housing, Communities and Local Government
- Ordnance Survey Data Hub
- Propertydata.co.uk
We update our property data quarterly to ensure accuracy. Last update: March 2026. All data is presented as provided by our sources without adjustments or amendments.
Price Per Square Foot in Bournemouth
Sold prices per square foot in Bournemouth range from £293 in BH1 to £424 in BH23. Average asking prices can mislead because a postcode might look expensive simply because it has larger properties. Price per square foot strips out that size bias and shows what you are actually paying for space.
That £131 spread across 13 postcodes shows a clear geographic pattern. The town centre postcodes are the cheapest per square foot, while the coastal and Christchurch postcodes command the highest rates.
| Rank | Area | Price Per Sq Ft |
|---|---|---|
| 1 | BH1 (Town Centre, East Cliff) | £293 |
| 2 | BH2 (West Cliff, Town Centre) | £295 |
| 3 | BH5 (Boscombe) | £332 |
| 4 | BH4 (Westbourne) | £342 |
| 5 | BH12 (Branksome, Alderney) | £353 |
| 6 | BH9 (Winton, Moordown) | £353 |
| 7 | BH8 (Charminster, Malmesbury Park) | £354 |
| 8 | BH3 (Talbot Woods, Winton) | £355 |
| 9 | BH11 (Bear Cross, Kinson) | £365 |
| 10 | BH10 (Kinson, Northbourne) | £370 |
| 11 | BH7 (Littledown, Iford) | £374 |
| 12 | BH6 (Southbourne) | £422 |
| 13 | BH23 (Christchurch) | £424 |
BH1 and BH2 at £293 and £295 per square foot are the cheapest space in Bournemouth. These are the town centre postcodes where apartment stock and older buildings keep per-foot costs low. BH1 also delivers a 5.5% yield, making it one of the few postcodes where low space costs and reasonable returns overlap.
BH6 and BH23 form the premium tier at £422 and £424 per square foot. Southbourne (BH6) commands coastal premiums along the clifftop, while Christchurch (BH23) combines period property stock with the New Forest fringe. These are the postcodes where space costs more than 40% above the town centre.
The mid-range cluster from BH4 to BH10 (£342 to £370) is remarkably tight. Seven postcodes sit within a £28 range per square foot. Within this cluster, BH9 at £353 per square foot is where most buy-to-let activity concentrates. Read this alongside the yield data: BH9 delivers the area's highest gross yield at 7.7% from mid-range space costs.
Figures reflect averages across all property types and ages. Individual values depend on condition, location within the postcode, and building age.
For Sale Asking Prices in Bournemouth
Asking prices for property for sale in Bournemouth range from £237,411 in BH1 to £480,871 in BH3, a spread of £243,460 across 13 postcodes. Asking prices reflect what sellers and agents think the market will pay. They are not the same as sold prices, which capture what buyers actually paid. With Land Registry data showing a -4.5% annual change at December 2025, asking prices may sit above what eventually transacts.
Across all 13 postcodes, the mean asking price is £355,164. Three postcodes sit below £260,000, offering entry points well under the area average.
| Rank | Area | Average Asking Price |
|---|---|---|
| 1 | BH1 (Town Centre, East Cliff) | £237,411 |
| 2 | BH2 (West Cliff, Town Centre) | £245,203 |
| 3 | BH5 (Boscombe) | £257,090 |
| 4 | BH8 (Charminster, Malmesbury Park) | £319,487 |
| 5 | BH12 (Branksome, Alderney) | £332,900 |
| 6 | BH11 (Bear Cross, Kinson) | £338,111 |
| 7 | BH4 (Westbourne) | £343,799 |
| 8 | BH9 (Winton, Moordown) | £356,184 |
| 9 | BH10 (Kinson, Northbourne) | £357,572 |
| 10 | BH7 (Littledown, Iford) | £443,513 |
| 11 | BH6 (Southbourne) | £445,295 |
| 12 | BH23 (Christchurch) | £459,694 |
| 13 | BH3 (Talbot Woods, Winton) | £480,871 |
BH1, BH2, and BH5 form the affordable entry tier at £237,411 to £257,090. These three town centre and eastern postcodes sit significantly below the Bournemouth mean of £355,164. BH1 in particular offers the lowest asking price in the area while delivering a 5.5% yield. For investors looking at below market value properties or renovation properties, these postcodes represent the most accessible entry into the Bournemouth market.
The premium tier starts at BH7 and climbs to £480,871 in BH3. Four postcodes (BH7, BH6, BH23, BH3) all sit above £440,000. These are the areas where owner-occupier demand, period homes, and coastal proximity drive prices to more than double the affordable tier. BH3 (Talbot Woods, Winton) tops the table despite having just 6 sales per month, suggesting a small but tightly held market.

House Price Growth in Bournemouth
Growth across Bournemouth's 13 postcodes splits sharply. Five-year growth ranges from -1.0% in BH2 to 22.6% in BH7. That 23.6 percentage point spread between the weakest and strongest postcodes is wider than in many cities, and the growth pattern does not follow the price pattern. Some of the most expensive postcodes grew fastest.
| Area | 1 Year | 3 Years | 5 Years |
|---|---|---|---|
| BH7 (Littledown, Iford) | 16.8% | 16.5% | 22.6% |
| BH12 (Branksome, Alderney) | 7.1% | 0.2% | 19.4% |
| BH9 (Winton, Moordown) | 6.4% | 3.1% | 18.5% |
| BH10 (Kinson, Northbourne) | 6.7% | -1.7% | 18.2% |
| BH11 (Bear Cross, Kinson) | 0.0% | -6.5% | 14.8% |
| BH3 (Talbot Woods, Winton) | 8.3% | -6.8% | 12.0% |
| BH1 (Town Centre, East Cliff) | -3.1% | 1.1% | 11.1% |
| BH23 (Christchurch) | 0.4% | -2.6% | 11.1% |
| BH6 (Southbourne) | 4.7% | -0.7% | 10.5% |
| BH8 (Charminster, Malmesbury Park) | 0.9% | 7.5% | 6.0% |
| BH4 (Westbourne) | -8.5% | -8.4% | 0.9% |
| BH5 (Boscombe) | 5.3% | 4.3% | -0.1% |
| BH2 (West Cliff, Town Centre) | 0.7% | -12.4% | -1.0% |
BH7 leads all 13 postcodes at 22.6% over five years, with consistent growth across all three time horizons. Littledown and Iford are predominantly residential areas with family housing stock. The 16.8% one-year growth is the highest current reading in Bournemouth. Yet BH7 has the lowest yield in the area at 2.9%, confirming this is an owner-occupier driven market rather than a rental play.
BH9 combines 18.5% five-year growth with the area's highest yield of 7.7%. That combination of growth and yield in the same postcode is unusual. Most markets force investors to choose one or the other. BH9's student rental demand (driven by proximity to Bournemouth University) supports both rent levels and long-term capital appreciation.
BH2 and BH5 are the only postcodes showing negative five-year growth. BH2 (West Cliff, Town Centre) at -1.0% has also lost 12.4% over three years. BH5 (Boscombe) shows -0.1% over five years but has recovered to 5.3% one-year growth. BH4 (Westbourne) at 0.9% five-year growth and -8.5% one-year growth is also flat in real terms. These are the postcodes where the post-pandemic correction has been most visible.
Monthly Property Sales in Bournemouth
Christchurch (BH23) dominates Bournemouth's sales volume at 70 transactions per month. That is more than double the next busiest postcode. BH23 covers a large geographic area with diverse housing stock, from Christchurch Harbour to the edges of the New Forest. High volume with 11% turnover suggests a liquid market with regular buyer and seller activity.
| Area | Sales Per Month | Turnover | Asking Price |
|---|---|---|---|
| BH23 (Christchurch) | 70 | 11% | £459,694 |
| BH12 (Branksome, Alderney) | 34 | 28% | £332,900 |
| BH9 (Winton, Moordown) | 27 | 14% | £356,184 |
| BH1 (Town Centre, East Cliff) | 26 | 11% | £237,411 |
| BH6 (Southbourne) | 24 | 10% | £445,295 |
| BH8 (Charminster, Malmesbury Park) | 24 | 10% | £319,487 |
| BH10 (Kinson, Northbourne) | 19 | 13% | £357,572 |
| BH11 (Bear Cross, Kinson) | 16 | 27% | £338,111 |
| BH7 (Littledown, Iford) | 14 | 13% | £443,513 |
| BH2 (West Cliff, Town Centre) | 12 | 4% | £245,203 |
| BH4 (Westbourne) | 12 | 5% | £343,799 |
| BH5 (Boscombe) | 11 | 6% | £257,090 |
| BH3 (Talbot Woods, Winton) | 6 | 63% | £480,871 |
BH3 records just 6 sales per month but a 63% turnover rate. That combination suggests a very small total housing stock where even modest sales volumes produce high percentage turnover. BH3 (Talbot Woods, Winton) is a premium postcode with large detached properties. The low volume means individual transactions can move the average significantly.
BH2 and BH4 both show low turnover at 4% and 5%. BH2 (West Cliff) has the lowest turnover in Bournemouth, with 12 sales per month from a larger housing stock. Low turnover combined with negative five-year growth (-1.0%) and 12.4% three-year decline suggests a market where owners are holding rather than selling into weakness.
For investors building a portfolio, BH9 at 27 sales per month offers both volume and the area's highest yield. BH1 at 26 sales per month has the lowest asking price in the area. These are the postcodes where finding stock is more straightforward.
Property Data Sources
Our location guide relies on diverse, authoritative datasets including:
- HM Land Registry UK House Price Index
- Ministry of Housing, Communities and Local Government
- Ordnance Survey Data Hub
- Propertydata.co.uk
We update our property data quarterly to ensure accuracy. Last update: March 2026. All data is presented as provided by our sources without adjustments or amendments.

Bournemouth Rental Market Analysis
For investors weighing up whether rental property is a worthwhile investment in Bournemouth, the data below breaks down average monthly rents and gross rental yields across the area's postcodes.
Rental data is available for 12 of Bournemouth's 13 postcodes, with BH11 (Bear Cross, Kinson) the exception. Monthly rents range from £1,065 (BH7) to £2,279 (BH9), and yields span 2.9% to 7.7%. If you are looking to build a property portfolio in the South West, Bournemouth's combination of university-driven tenant demand and south coast lifestyle appeal makes it a distinct market within the region.
Average Rent & Gross Rental Yields in Bournemouth
The yield spread in Bournemouth is one of the widest in any south coast location. BH9 (Winton, Moordown) tops the area at 7.7% gross yield from an average monthly rent of £2,279. That rent level is significantly above other Bournemouth postcodes, reflecting the concentration of HMO and multi-let properties in BH9's student-heavy streets near Bournemouth University.
| Area | Monthly Rent | Asking Price | Gross Yield |
|---|---|---|---|
| BH9 (Winton, Moordown) | £2,279 | £356,184 | 7.7% |
| BH10 (Kinson, Northbourne) | £1,847 | £357,572 | 6.2% |
| BH1 (Town Centre, East Cliff) | £1,092 | £237,411 | 5.5% |
| BH8 (Charminster, Malmesbury Park) | £1,476 | £319,487 | 5.5% |
| BH2 (West Cliff, Town Centre) | £1,097 | £245,203 | 5.4% |
| BH5 (Boscombe) | £1,076 | £257,090 | 5.0% |
| BH12 (Branksome, Alderney) | £1,365 | £332,900 | 4.9% |
| BH4 (Westbourne) | £1,327 | £343,799 | 4.6% |
| BH3 (Talbot Woods, Winton) | £1,713 | £480,871 | 4.3% |
| BH23 (Christchurch) | £1,360 | £459,694 | 3.6% |
| BH6 (Southbourne) | £1,206 | £445,295 | 3.2% |
| BH7 (Littledown, Iford) | £1,065 | £443,513 | 2.9% |
| BH11 (Bear Cross, Kinson) | Not enough data | £338,111 | Not enough data |
BH9's £2,279 monthly rent is more than double the rent in 4 of the 12 postcodes with data. This level is consistent with HMO or multi-let properties where a single landlord lets to multiple tenants, producing a headline rent that exceeds what a standard single-let would achieve. The 7.7% gross yield is calculated on this combined rent figure. Investors targeting BH9 for yield should factor in the higher management intensity and licensing requirements that multi-let properties bring.
BH1 and BH2 deliver 5.5% and 5.4% yields from the lowest asking prices in the area. Rents of £1,092 and £1,097 are modest by Bournemouth standards, but entry prices of £237,411 and £245,203 keep the yield arithmetic working. These are the postcodes where the numbers work for standard single-let investors.
BH7 at the bottom with 2.9% sits 4.8 percentage points below BH9. With an asking price of £443,513 and monthly rent of just £1,065, BH7 is the clearest capital-growth-over-yield postcode in Bournemouth. Its 22.6% five-year growth confirms the pattern.
Is Bournemouth Rent High?
The median gross weekly salary in Bournemouth, Christchurch and Poole is £721, which equates to £3,124 per month or £37,493 per year. This is below the South West regional median of £722 per week and the Great Britain median of £752.40 per week. Data from the Nomis Labour Market Profile (ASHE 2025).
Rent as a percentage of the local median gross income ranges from 34.1% in BH7 to 72.9% in BH9. The table below ranks postcodes from highest rent burden to lowest. Only two postcodes (BH7 and BH5) fall within the standard 30-35% affordability threshold used by lenders and housing associations.
| Rank | Area | Rent as % of Income |
|---|---|---|
| 1 | BH9 (Winton, Moordown) | 72.9% |
| 2 | BH10 (Kinson, Northbourne) | 59.1% |
| 3 | BH3 (Talbot Woods, Winton) | 54.8% |
| 4 | BH8 (Charminster, Malmesbury Park) | 47.2% |
| 5 | BH12 (Branksome, Alderney) | 43.7% |
| 6 | BH23 (Christchurch) | 43.5% |
| 7 | BH4 (Westbourne) | 42.5% |
| 8 | BH6 (Southbourne) | 38.6% |
| 9 | BH2 (West Cliff, Town Centre) | 35.1% |
| 10 | BH1 (Town Centre, East Cliff) | 35.0% |
| 11 | BH5 (Boscombe) | 34.4% |
| 12 | BH7 (Littledown, Iford) | 34.1% |
| — | BH11 (Bear Cross, Kinson) | Not enough data |
BH9's 72.9% figure reflects the HMO-driven rent averages discussed in the yield section. When a multi-let property advertises at £2,279 per month, that rent is typically split across multiple tenants rather than being paid by a single earner. The rent-to-income ratio for individual tenants in shared accommodation is lower than the headline figure suggests.
The town centre postcodes (BH1, BH2) and BH5 (Boscombe) cluster around 34-35% of income. These are the most affordable rental areas for tenants on local salaries. For landlords, affordable rents relative to income tend to correlate with lower void risk and fewer tenant payment issues.
Thinking of Buying?
We have off-market investment properties averaging 8%+ annual yield.
View Property DealsBuy-to-Let Considerations
Are House Prices High? Price-to-Earnings Ratios
Purchasing a property in Bournemouth requires between 6.3 and 12.8 times the median annual salary. This is based on the Nomis Labour Market Profile for Bournemouth, Christchurch and Poole showing the median gross annual income for local residents is £37,493.
For context, the national benchmark (England's average sold price of £291,865 divided by Great Britain's median salary of £39,125) gives a ratio of 7.5x. Three of Bournemouth's 13 postcodes sit below that national benchmark. The remaining ten exceed it.
| Rank | Area | Price-to-Earnings Ratio |
|---|---|---|
| 1 | BH1 (Town Centre, East Cliff) | 6.3x |
| 2 | BH2 (West Cliff, Town Centre) | 6.5x |
| 3 | BH5 (Boscombe) | 6.9x |
| 4 | BH8 (Charminster, Malmesbury Park) | 8.5x |
| 5 | BH12 (Branksome, Alderney) | 8.9x |
| 6 | BH11 (Bear Cross, Kinson) | 9.0x |
| 7 | BH4 (Westbourne) | 9.2x |
| 8 | BH9 (Winton, Moordown) | 9.5x |
| 9 | BH10 (Kinson, Northbourne) | 9.5x |
| 10 | BH7 (Littledown, Iford) | 11.8x |
| 11 | BH6 (Southbourne) | 11.9x |
| 12 | BH23 (Christchurch) | 12.3x |
| 13 | BH3 (Talbot Woods, Winton) | 12.8x |
BH1 at 6.3x and BH2 at 6.5x have the lowest ratios in Bournemouth, though both still exceed the typical mortgage affordability threshold of 4.5x. These ratios sit well below Bournemouth's premium postcodes and closer to the national benchmark of 7.5x. At these levels, owner-occupier competition is more likely than in postcodes above 10x, where local wage earners face steeper affordability constraints.
BH3 at 12.8x is the least affordable postcode relative to local earnings. Properties in Talbot Woods and the premium end of Winton require almost 13 years of median salary to purchase outright. At this ratio, local wage earners are priced out of ownership, which sustains rental demand from professionals who choose to live in premium areas without buying.
Deposit Requirements in Bournemouth
Buy-to-let mortgages typically require a 30% deposit. In Bournemouth, 30% deposits range from £71,223 in BH1 to £144,261 in BH3. That is a £73,038 difference between the cheapest and most expensive entry point. For investors comparing the full costs of buy-to-let including stamp duty, Bournemouth's deposit requirements place it above most northern cities but within the range for the south coast.
| Rank | Area | 30% Deposit Required |
|---|---|---|
| 1 | BH1 (Town Centre, East Cliff) | £71,223 |
| 2 | BH2 (West Cliff, Town Centre) | £73,561 |
| 3 | BH5 (Boscombe) | £77,127 |
| 4 | BH8 (Charminster, Malmesbury Park) | £95,846 |
| 5 | BH12 (Branksome, Alderney) | £99,870 |
| 6 | BH11 (Bear Cross, Kinson) | £101,433 |
| 7 | BH4 (Westbourne) | £103,140 |
| 8 | BH9 (Winton, Moordown) | £106,855 |
| 9 | BH10 (Kinson, Northbourne) | £107,272 |
| 10 | BH7 (Littledown, Iford) | £133,054 |
| 11 | BH6 (Southbourne) | £133,588 |
| 12 | BH23 (Christchurch) | £137,908 |
| 13 | BH3 (Talbot Woods, Winton) | £144,261 |
The gap from BH1 (£71,223) to BH8 (£95,846) is £24,623. That additional deposit buys access to a postcode with a 5.5% yield and stronger three-year growth (7.5% vs 1.1%). Read the deposit table alongside the yield and growth data to see where the additional capital requirement translates into measurably different returns.
Eight postcodes require deposits above £100,000. From BH11 at £101,433 to BH3 at £144,261, the deposit requirement crosses into six figures. Yields across the seven with rental data range from 2.9% (BH7) to 7.7% (BH9), with five sitting below 5%. For investors exploring alternative entry routes, see our guide to buying investment property with no deposit.

What the Bournemouth Data Tells Buy-to-Let Investors
BH9 (Winton, Moordown) produces the highest yield in Bournemouth at 7.7% and the third-highest five-year growth at 18.5%. That combination, achieved from an asking price of £356,184, is rare in any south coast market. The £2,279 average monthly rent reflects HMO and multi-let activity rather than standard single-let returns. A 30% deposit on BH9 is £106,855. Tenants are predominantly students and young professionals drawn by Bournemouth University's proximity.
BH1 (Town Centre, East Cliff) offers the lowest entry price at £237,411 with a 5.5% gross yield. A 30% deposit of £71,223 makes it the most accessible postcode in Bournemouth. BH1 has 26 sales per month, giving investors a liquid market to buy into. BH2 (West Cliff) at £245,203 and 5.4% yield delivers a similar profile from a neighbouring postcode. These two town centre postcodes represent the simplest entry into the Bournemouth market for investment property portfolios.
BH7 (Littledown, Iford) shows 22.6% five-year growth but the area's lowest yield at 2.9%. BH6 (Southbourne) and BH23 (Christchurch) also sit below 4% yield. These are the postcodes where owner-occupier demand dominates. The data shows a clear split between yield-led postcodes (BH9, BH10, BH1, BH8) and growth-led postcodes (BH7, BH12). BH2 and BH4 show weakness across both growth and yield, with negative three-year growth of -12.4% and -8.4% respectively.
BCP Council operates selective licensing in parts of the authority area. Investors considering off-market property in HMO-heavy postcodes like BH9 should factor in licensing fees and compliance requirements.
How Bournemouth Compares
Bournemouth sits between two cheaper south coast cities and two more expensive neighbours. The mean asking price of £355,164 places Bournemouth above Southampton (£260,724) and Portsmouth (£284,807) but below Exeter (£387,814) and its immediate neighbour Poole (£443,756).
| Location | Mean Asking Price | Mean Monthly Rent | Top Gross Yield |
|---|---|---|---|
| Southampton | £260,724 | £1,362 | 9.0% |
| Portsmouth | £284,807 | £1,351 | 7.0% |
| Bournemouth | £355,164 | £1,408 | 7.7% |
| Exeter | £387,814 | £1,284 | 5.6% |
| Poole | £443,756 | £1,443 | 4.9% |
Southampton at £260,724 is 27% cheaper than Bournemouth and delivers a higher top yield of 9.0%. For investors where price and yield are the primary drivers, Southampton's numbers are stronger on both measures. Portsmouth at £284,807 sits between the two with a 7.0% top yield. Both cities are accessible via the M27 motorway and benefit from port-related employment.
Bournemouth's 7.7% top yield exceeds Exeter (5.6%) and Poole (4.9%) despite being cheaper than both. Exeter at £387,814 is 9% more expensive with lower rental returns. Poole at £443,756 is 25% more expensive with a top yield of just 4.9%. For investors comparing the best buy-to-let locations along the south coast, Bournemouth's yield-to-price ratio sits between the affordable Hampshire cities and the premium Dorset and Devon markets.
Frequently Asked Questions
Is Bournemouth expensive for property investment?
Bournemouth's average sold price of £309,673 sits 6.1% above the England average of £291,865. Asking prices range from £237,411 in BH1 to £480,871 in BH3. The town centre postcodes (BH1, BH2, BH5) all sit below £260,000, while the premium postcodes (BH6, BH7, BH23, BH3) exceed £440,000. The yield each postcode delivers varies with entry price: BH1 at £237,411 produces a 5.5% gross yield, while BH3 at £480,871 produces 4.3%.
What is the average rent in Bournemouth?
Monthly rents range from £1,065 in BH7 to £2,279 in BH9 across 12 postcodes with rental data. BH11 (Bear Cross, Kinson) has insufficient rental data. The BH9 figure of £2,279 reflects the concentration of HMO and multi-let properties in the area. Nine postcodes sit between £1,065 and £1,476 per month. BH3 (£1,713), BH10 (£1,847), and BH9 (£2,279) are the three postcodes above £1,500, with BH9 and BH10 producing the area's highest gross yields.
What are the best areas in Bournemouth for buy-to-let?
Different postcodes lead on different metrics. BH9 (Winton, Moordown) has the highest gross yield at 7.7% and 18.5% five-year growth. BH1 (Town Centre) has the lowest asking price at £237,411 and a 5.5% yield. BH7 (Littledown, Iford) has the strongest five-year growth at 22.6% but the lowest yield at 2.9%.
BH10 (Kinson, Northbourne) ranks second for yield at 6.2% and fourth for five-year growth at 18.2%. Each postcode's data profile suits different investment strategies. The full tables above break down rent, yield, growth, sales volume, and deposit requirements across all 13 postcodes.
Are there holiday homes for sale in Bournemouth and Dorset?
Bournemouth's seven miles of beaches and year-round tourism make it one of the south coast's most active holiday let markets. Flats in BH1 (Town Centre) and BH2 (West Cliff) start from £237,411, with proximity to the seafront and lower purchase prices than the wider Bournemouth average. For investors considering buying a holiday let, seasonal demand in Bournemouth peaks from May to September, when occupancy rates across Dorset's coastal towns are among the highest in England. Holiday lets carry different tax treatment and mortgage requirements from standard buy-to-let.
Are flats in Bournemouth a good investment?
Flats in Bournemouth, Christchurch and Poole average £198,290, which is 9.6% below the England flat average of £219,340. That makes flats the only property type in Bournemouth trading at a discount to the national market. The town centre postcodes BH1 and BH2 have the highest concentration of flat stock and both deliver yields of at least 5.4%. The flat stock includes purpose-built retirement apartments and older conversions, which keeps average values lower than in cities dominated by new-build developments.
How does Bournemouth compare to Southampton and Portsmouth for investment?
Southampton at £260,724 is 27% cheaper than Bournemouth's mean asking price of £355,164, and delivers a higher top yield of 9.0% versus 7.7%. Portsmouth at £284,807 is 20% cheaper with a 7.0% top yield. Both cities offer lower entry prices and comparable or higher yields.
Bournemouth's mean monthly rent of £1,408 is higher than Southampton (£1,362) and Portsmouth (£1,351), but the difference in rent does not offset the price gap. Where Bournemouth differs is in its south coast lifestyle positioning, university-driven tenant demand, and the range across 13 postcodes from £237,411 to £480,871.