Where to Buy Property Investments in Chichester: Yields of 4.5%
Chichester's top gross rental yield sits at 4.5% in PO19 (Chichester City Centre), where asking prices average £410,018. Across the district, average sold prices reached £441,151 in December 2025. That is 51.1% above the England average of £291,865. The population grew 9.03% between the 2011 and 2021 censuses, from 113,794 to 124,068.
Chichester is a premium market. Entry prices here are among the highest of any location covered on this site. The lowest asking price sits at £410,018 in PO19, while the most expensive postcode, GU27 (Haslemere), averages £648,567. Rental yields across the district range from 3.3% to 4.5% across six postcodes with rental data. Two postcodes have insufficient rental activity to generate yield figures. This is a district where the investment case rests on long-term capital growth and tenant quality rather than headline yields.
Chichester is a cathedral city in West Sussex, and this guide covers the Chichester local authority district (ONS code E07000225). The district takes in eight postcodes spanning from Haslemere and Petworth in the north to Selsey and the Witterings on the coast. Nearby South East locations include Brighton, Portsmouth, Eastbourne, and Crawley. Investors looking for buy-to-let properties in this part of the South East will find a very different profile to most of those locations.
Article updated: March 2026
Chichester Buy-to-Let Market Overview 2026
Chichester is a premium rural district in West Sussex where sold prices sit 51.1% above the England average and rental yields are compressed across all postcodes.
- Average sold price: £441,151 (51.1% above England's £291,865)
- Asking price range: £410,018 (PO19, Chichester City Centre) to £648,567 (GU27, Haslemere)
- Rental yields: 3.3% (PO18) to 4.5% (PO19) across 6 postcodes with rental data
- Rental income: Monthly rents from £1,425 (PO20) to £1,885 (GU27)
- Price per sq ft: House prices from £388/sq ft (PO20) to £509/sq ft (GU27)
- Market activity: Sales ranging from 4 per month (GU28) to 46 per month (PO20)
- Deposit requirements: 30% deposits range from £123,005 (PO19) to £194,570 (GU27)
- Affordability ratios: Property prices from 11.6 to 18.4 times Chichester's median annual salary of £35,264
Contents

-
by Robert Jones, Founder of Property Investments UK
With two decades in UK property, Rob has been investing in buy-to-let since 2005, and uses property data to develop tools for property market analysis.

Property Data Sources
Our location guide relies on diverse, authoritative datasets including:
- HM Land Registry UK House Price Index
- Ministry of Housing, Communities and Local Government
- Ordnance Survey Data Hub
- Propertydata.co.uk
We update our property data quarterly to ensure accuracy. Last update: March 2026. All data is presented as provided by our sources without adjustments or amendments.
Why Invest in Chichester?
Chichester's population grew 9.03% between 2011 and 2021, rising from 113,794 to 124,068. That growth rate outpaces several larger South East local authorities. The district covers a mix of the historic cathedral city, market towns including Midhurst, Petworth, and Arundel, and coastal settlements at Selsey and the Witterings. The South Downs National Park runs through the northern half of the district, which constrains new development and limits housing supply.
The median gross annual salary for Chichester residents is £35,264. That translates to £678.20 per week or £2,939 per month. Local earnings sit below the South East regional median of £800.30 per week and below the Great Britain median of £752.40 per week. The gap between local and regional earnings reflects Chichester's employment mix, which leans toward tourism, hospitality, retail, agriculture, and public services rather than the higher-paying financial and technology sectors found in nearby Surrey and along the M3/M4 corridor.
Chichester's employment rate stands at 84.6%. Tourism is a significant employer. Goodwood hosts horse racing, the Festival of Speed, and the Revival meeting, drawing hundreds of thousands of visitors each year. Chichester Festival Theatre is one of the country's flagship producing theatres. The University of Chichester adds an academic and student population, and the city's NHS services and local government provide steady public sector employment.
Chichester Economic Summary
- Population: 124,068 (2021 Census). Growth of 9.03% from 2011.
- Median annual salary: £35,264 (Chichester), £41,616 (South East), £39,125 (Great Britain)
- Employment rate: 84.6% (Chichester)
- Unemployment rate: Not available from source
- Key employment sectors: Tourism and hospitality, agriculture, public administration and health, education, retail and services
Source: ONS Census 2021, Nomis Labour Market Profile (ASHE 2025)
Regeneration and Investment in Chichester
Chichester District Council adopted a new regeneration strategy in 2024, identifying 19 strategic sites across the city centre. Three projects stand out for their scale and investor relevance.
- Southern Gateway Regeneration (In progress, £5m): The largest regeneration project Chichester has seen in decades, transforming approximately 30 acres of largely brownfield land south of the city centre into up to 365 residential dwellings and 21,000 sqm of commercial floorspace. New housing supply at this scale has the potential to shift demand patterns in adjacent postcodes. Updates at Chichester District Council.
- Persimmon Homes Madgwick Lane (Approved, £2m infrastructure contributions): Planning approved for 165 new homes (115 open market, 50 affordable) near the Goodwood Estate, with £640,000 directed toward A27 highway improvements. The Local Homes Guarantee reserves 50% of private homes for buyers with a local connection, which may concentrate local demand. Updates at Persimmon Homes.
- Chichester Regeneration Strategy (In progress): A 15-year city-wide strategy identifying 19 strategic sites and 16 key interventions, with AR Urbanism appointed to develop design options. Priority sites include the bus station, bus depot, Basin Road car park, and The Tannery brownfield site. Signals sustained council commitment to city centre improvement over the next decade. Updates at Invest Chichester.

Chichester Property Market Analysis
When was the last house price crash in Chichester?
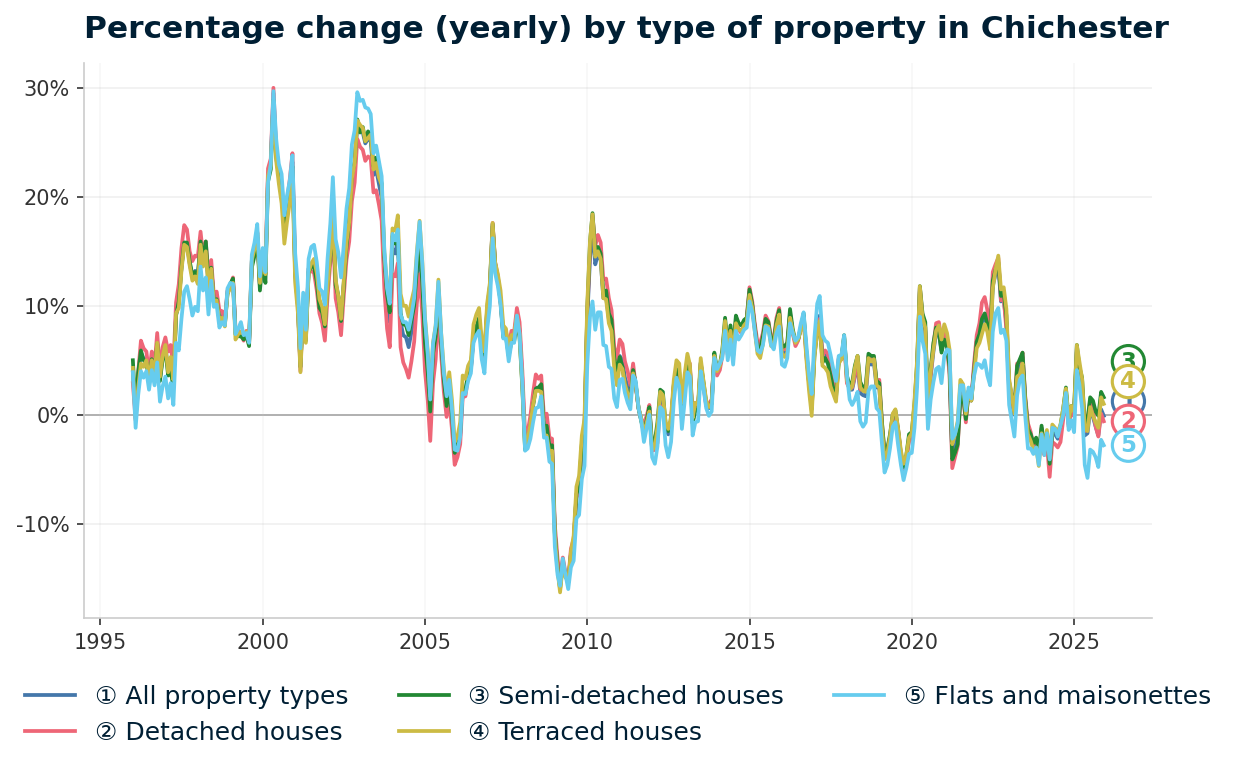
Average property prices in Chichester fell 21.5% during the 2008-2009 financial crisis, from a peak of £295,643 in October 2007 to a trough of £232,224 in March 2009. Chichester is a local authority district in West Sussex, so all sold property prices from HM Land Registry are available at the district level.
That decline was steeper than both the England average of 18.2% and the South East regional average of 20.0%. The worst annual change reading was -15.7% in March 2009. Prices took until September 2012 to recover past the pre-crash peak, reaching £298,295.
Here is how Chichester property prices have moved through each major cycle since 1995:
- 1995-2007 (The Boom): Chichester prices rose from £80,122 in January 1995 to £295,643 in October 2007. Growth was driven by falling interest rates, expanding mortgage availability, and Chichester's appeal as a rural South East location within reach of London.
- 2008-2009 (The Financial Crisis): Prices fell 21.5% from the October 2007 peak of £295,643 to £232,224 in March 2009. The worst annual change reading was -15.7% (March 2009). England fell 18.2% and the South East fell 20.0% over the same period.
- 2010-2013 (Stagnation and Recovery): Prices recovered sharply to £270,964 by January 2010 before stalling. The market moved sideways between £270,000 and £298,000, with prices first passing the pre-crash peak in September 2012 (£298,295) before dipping again to £284,091 in January 2013.
- 2014-2016 (Turning Point): Sustained recovery took hold, with annual growth of 3.9% in January 2014 accelerating to 5.8% by January 2016. Prices reached £347,438, driven by London buyers looking further afield and limited new supply within the National Park boundaries.
- 2017-2019 (Pre-pandemic growth): Steady growth continued. Prices hit £368,010 in January 2017 and £389,455 by January 2019, before easing to £383,751 by December 2019 as Brexit uncertainty weighed on the South East market.
- 2020-2022 (Pandemic surge): Prices jumped to £412,060 by June 2020, driven by the stamp duty holiday and a surge in demand for rural and coastal properties. Chichester's mix of countryside and coast made it a direct beneficiary. Prices reached £430,082 by June 2022.
- 2023 (Rate shock): Prices peaked at £452,685 in June 2023 before mortgage rate rises took effect. Annual growth was still positive at 5.3% in June but turned negative by year end.
- 2024-2026 (Current): A modest correction. Prices fell to £440,366 in January 2024 (annual change -1.3%) and have largely stabilised. The latest data shows £441,151 in December 2025, with annual change at -0.1%.
Long-term growth summary:
- 5 years (2021-2026): 8.0% growth (£408,456 to £441,151)
- 10 years (2016-2026): 27.0% growth (£347,438 to £441,151)
- 15 years (2011-2026): 54.4% growth (£285,630 to £441,151)
- 20 years (2006-2026): 81.5% growth (£243,032 to £441,151)
- 30 years (1996-2026): 430.0% growth (£83,232 to £441,151)
Chichester prices today sit 49.2% above their October 2007 pre-crash peak. The 21.5% crash was deeper than England's decline, which reflects the South East's greater exposure to mortgage tightening. Recovery took nearly five years. The current market shows a mild correction of 2.5% from the June 2023 high of £452,685, largely driven by higher borrowing costs rather than the structural oversupply that triggered the 2008 crash.
Source: HM Land Registry House Price Index for Chichester, January 1995 to December 2025.
Thinking of Buying?
We have off-market investment properties averaging 8%+ annual yield.
View Property DealsSold House Prices in Chichester
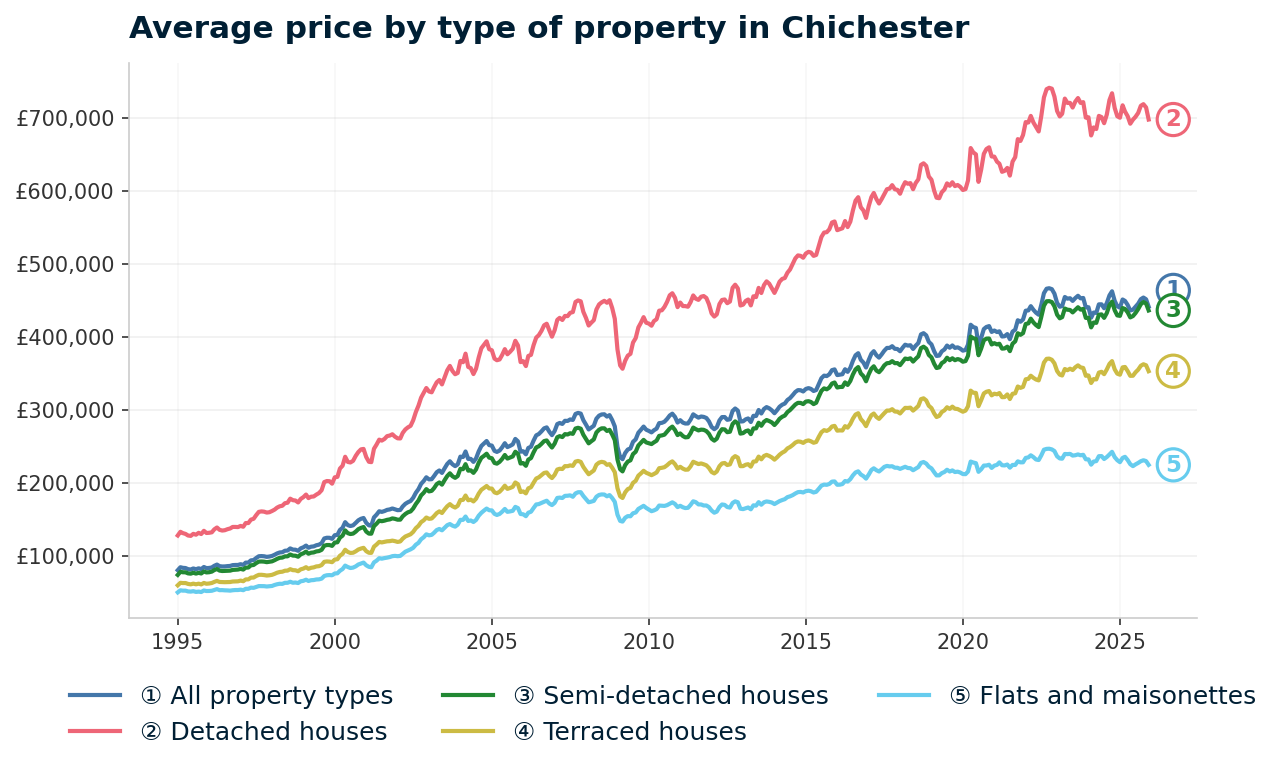
The average sold property price in Chichester is £441,151, which is £149,286 above the England average of £291,865. That 51.1% premium holds across houses. Detached homes in Chichester average £697,510 (47.9% above England) and semi-detached homes average £435,960 (50.8% above). Terraced houses average £352,738, 44.1% above the national figure. The exception is flats.
| Property Type | Chichester Average | England Average | Difference |
|---|---|---|---|
| Detached houses | £697,510 | £471,667 | +£225,843 (+47.9%) |
| Semi-detached houses | £435,960 | £289,135 | +£146,825 (+50.8%) |
| Terraced houses | £352,738 | £244,830 | +£107,908 (+44.1%) |
| Flats and maisonettes | £224,450 | £219,340 | +£5,110 (+2.3%) |
| All property types | £441,151 | £291,865 | +£149,286 (+51.1%) |
Detached houses in Chichester carry the largest absolute premium at £225,843 above England. The district's housing stock is weighted toward detached and semi-detached properties, particularly in the rural postcodes of GU27, GU28, and GU29, where large period homes and country properties push the average up. That housing mix is a key reason Chichester's overall average sits so far above the national figure.
Semi-detached houses show the largest percentage premium at 50.8%. Limited stock and competition from buyers relocating from London and the Surrey commuter belt keep prices elevated. Semi-detached homes are the most common property type in several Chichester postcodes, making this premium particularly relevant for buy-to-let investors targeting family tenants.
Terraced houses are 44.1% above the England average at £352,738. The terraced stock is concentrated in the city centre (PO19) and coastal areas (PO20), where Victorian and Georgian terraces attract both owner-occupiers and tenants. This price point represents the mid-market entry for Chichester buy-to-let.
Flats are the outlier, sitting just 2.3% above England at £224,450. This near-parity with the national average makes flats the most accessible entry point for investors. The flat market in Chichester is smaller than in urban centres, but the compressed premium compared to houses creates a different affordability dynamic for tenants and investors alike.
Property Data Sources
Our location guide relies on diverse, authoritative datasets including:
- HM Land Registry UK House Price Index
- Ministry of Housing, Communities and Local Government
- Ordnance Survey Data Hub
- Propertydata.co.uk
We update our property data quarterly to ensure accuracy. Last update: March 2026. All data is presented as provided by our sources without adjustments or amendments.
Price Per Square Foot in Chichester
How much does a square foot of property cost in Chichester? Transaction-based sold prices per square foot range from £388 in PO20 (Selsey, Witterings) to £509 in GU27 (Haslemere). That £121 spread reveals where the premium is concentrated. The PO postcodes around the city and coast sit between £388 and £428 per square foot, while the three GU postcodes in the north of the district all exceed £430 per square foot, reflecting the influence of the Surrey border and the South Downs.
| Rank | Area | Price Per Sq Ft |
|---|---|---|
| 1 | PO20 (Selsey, Witterings) | £388 |
| 2 | BN18 (Arundel) | £390 |
| 3 | PO19 (Chichester City Centre) | £403 |
| 4 | PO10 (Emsworth) | £417 |
| 5 | PO18 (Bosham, Boxgrove) | £428 |
| 6 | GU29 (Midhurst) | £430 |
| 7 | GU28 (Petworth) | £456 |
| 8 | GU27 (Haslemere) | £509 |
GU27 (Haslemere) commands £509 per square foot, the highest in the district by a significant margin. Haslemere sits at the northern edge of the district near the Surrey border, where London commuter demand and the desirability of the Hindhead area push values up. Buyers here are paying a premium per square foot that is 31% higher than PO20 at the bottom of the table.
PO19 (Chichester City Centre) sits at £403 per square foot, sixth out of eight postcodes. For investors, this is a useful comparison point. PO19 has the lowest asking price (£410,018) and the highest yield (4.5%), yet its cost per square foot is mid-range rather than rock bottom. That suggests the city centre is delivering relatively compact, higher-density stock compared to the sprawling rural properties in the GU postcodes.
For Sale Asking Prices in Chichester
Compare Chichester to nearby Portsmouth, where properties start below £200,000. Asking prices across Chichester's eight postcodes range from £410,018 to £648,567, with a mean of £509,470. Six of the eight postcodes fall between £410,000 and £475,000, creating a relatively tight band. The two outliers are PO18 (Bosham, Boxgrove) at £558,915 and GU27 (Haslemere) at £648,567.
| Rank | Area | Asking Price |
|---|---|---|
| 1 | PO19 (Chichester City Centre) | £410,018 |
| 2 | GU29 (Midhurst) | £460,594 |
| 3 | BN18 (Arundel) | £471,264 |
| 4 | PO10 (Emsworth) | £472,046 |
| 5 | PO20 (Selsey, Witterings) | £472,636 |
| 6 | PO18 (Bosham, Boxgrove) | £558,915 |
| 7 | GU28 (Petworth) | £581,717 |
| 8 | GU27 (Haslemere) | £648,567 |
PO19 (Chichester City Centre) is the most affordable postcode at £410,018. It is also the only postcode where asking prices sit below the district's Land Registry sold price average of £441,151. This is a relatively liquid market with 32 sales per month, which matters for investors who need exit options. Investors looking for below market value properties will find that the city centre's mix of flats, terraces, and smaller semis provides the widest range of stock in the district.
The rural postcodes command substantial premiums. GU27 (Haslemere) at £648,567 is 58% more expensive than PO19. The difference reflects the character of these areas. Large detached period homes on generous plots in the South Downs dominate the GU postcodes. These are owner-occupier markets where rental demand is thinner and yields are compressed below 4%. Investors looking for renovation properties may find better value in the city centre, where older terraces and period conversions are more common.

House Price Growth in Chichester
Not every Chichester postcode has grown at the same pace. Five-year asking price growth ranges from 3.3% to 13.2%. PO18 (Bosham, Boxgrove) leads at 13.2% over five years, while GU27 (Haslemere) and GU29 (Midhurst) share the bottom position at 3.3%. All eight postcodes show positive five-year growth, but six out of eight show negative three-year figures.
| Area | 1 Year | 3 Years | 5 Years |
|---|---|---|---|
| PO18 (Bosham, Boxgrove) | 3.5% | 5.8% | 13.2% |
| GU28 (Petworth) | -8.8% | 3.0% | 12.0% |
| PO19 (Chichester City Centre) | 3.5% | -3.4% | 11.8% |
| PO10 (Emsworth) | -3.4% | -4.0% | 8.9% |
| PO20 (Selsey, Witterings) | 7.7% | -0.9% | 6.4% |
| BN18 (Arundel) | 0.0% | -4.0% | 6.0% |
| GU27 (Haslemere) | -4.4% | -9.9% | 3.3% |
| GU29 (Midhurst) | -4.5% | -1.5% | 3.3% |
PO18 (Bosham, Boxgrove) leads five-year growth at 13.2% and is the only postcode showing positive growth across all three timeframes. PO19 (Chichester City Centre) also shows positive one-year growth of 3.5% alongside 11.8% over five years, though its three-year figure is -3.4%. PO20 (Selsey, Witterings) has the strongest one-year growth at 7.7%, which may reflect pandemic-era demand for coastal properties continuing to work through.
GU27 (Haslemere) shows the weakest growth picture at -9.9% over three years and just 3.3% over five. GU28 (Petworth) is similar over five years but its pattern is different. Petworth dropped 8.8% in the last year alone but still holds 12.0% five-year growth, suggesting a sharp recent correction after earlier gains. The northern postcodes are more sensitive to mortgage rate movements, given their higher average prices and the buyer profile in those areas.
Monthly Property Sales in Chichester
How quickly do properties sell in Chichester? PO20 (Selsey, Witterings) records the highest transaction volume at 46 sales per month, 14 more than the next busiest postcode. PO19 (Chichester City Centre) follows with 32. The total across all eight postcodes is 156 sales per month. Turnover rates range from 6% in PO18 to 15% in GU29, with most postcodes sitting between 7% and 12%.
| Area | Sales Per Month | Turnover | Asking Price |
|---|---|---|---|
| PO20 (Selsey, Witterings) | 46 | 12% | £472,636 |
| PO19 (Chichester City Centre) | 32 | 9% | £410,018 |
| PO10 (Emsworth) | 22 | 12% | £472,046 |
| GU27 (Haslemere) | 16 | 9% | £648,567 |
| BN18 (Arundel) | 13 | 7% | £471,264 |
| GU29 (Midhurst) | 12 | 15% | £460,594 |
| PO18 (Bosham, Boxgrove) | 11 | 6% | £558,915 |
| GU28 (Petworth) | 4 | 11% | £581,717 |
PO20's 46 monthly sales reflect the Selsey peninsula and Witterings coast, where a mix of retirement downsizers, second-home buyers, and holiday let purchasers drives high transaction levels. PO19 at 32 sales per month is the city centre equivalent. These two postcodes between them account for half of all transactions in the district.
GU28 (Petworth) records just 4 sales per month. At that volume, any single large transaction can move the average significantly. The growth and price data for GU28 should be read accordingly. PO18 (Bosham, Boxgrove) also shows low volume at 11 sales per month with the lowest turnover rate of 6%, suggesting a market where homeowners hold properties for longer periods.
Property Data Sources
Our location guide relies on diverse, authoritative datasets including:
- HM Land Registry UK House Price Index
- Ministry of Housing, Communities and Local Government
- Ordnance Survey Data Hub
- Propertydata.co.uk
We update our property data quarterly to ensure accuracy. Last update: March 2026. All data is presented as provided by our sources without adjustments or amendments.

Chichester Rental Market Analysis
For investors weighing up whether rental property is a worthwhile investment in Chichester, the data below breaks down average monthly rents and gross rental yields across the district's postcodes.
Six of Chichester's eight postcodes have sufficient rental activity to produce yield data. Rents range from £1,425 to £1,885 per month, with yields between 3.3% and 4.5%. GU28 (Petworth) and PO10 (Emsworth) lack enough rental data to calculate yields. If you are looking to build a property portfolio in the South East, Chichester's combination of premium tenant demographics and constrained supply creates a different dynamic to higher-yielding alternatives along the coast.
Average Rent & Gross Rental Yields in Chichester
PO19 (Chichester City Centre) delivers the highest gross rental yield in the district at 4.5%, with average rents of £1,547 per month against asking prices of £410,018. That 4.5% is modest by national standards, but it is the entry point for yield-focused investors in this premium market. The six postcodes with data show yields compressed into a narrow 1.2 percentage point range between 3.3% and 4.5%.
| Area | Average Rent | Asking Price | Gross Yield |
|---|---|---|---|
| PO19 (Chichester City Centre) | £1,547 | £410,018 | 4.5% |
| BN18 (Arundel) | £1,631 | £471,264 | 4.2% |
| GU29 (Midhurst) | £1,561 | £460,594 | 4.1% |
| PO20 (Selsey, Witterings) | £1,425 | £472,636 | 3.6% |
| GU27 (Haslemere) | £1,885 | £648,567 | 3.5% |
| PO18 (Bosham, Boxgrove) | £1,542 | £558,915 | 3.3% |
| GU28 (Petworth) | Not enough data | £581,717 | Not enough data |
| PO10 (Emsworth) | Not enough data | £472,046 | Not enough data |
GU27 (Haslemere) generates the highest absolute rents at £1,885 per month, yet returns only 3.5% yield because asking prices are £648,567. This pattern repeats across Chichester's premium postcodes. High rents do not automatically translate into high yields when purchase prices are equally elevated. The only postcode where the yield equation works in the investor's favour is PO19, where relatively lower prices meet strong city-centre rental demand.
PO20 (Selsey, Witterings) returns 3.6% yield on £1,425 monthly rent. The lowest rent in the district reflects PO20's position as a retirement and holiday destination rather than a commuter location. Seasonal demand from holiday lets may supplement these figures, though that income is not captured in the standard rental data.
Is Chichester Rent High?
Rent as a percentage of local income shows how much of a Chichester tenant's salary goes toward housing costs. Across the six postcodes with rental data, rents consume between 48.5% and 64.1% of the median gross monthly salary. Every postcode sits well above the commonly cited 30% affordability threshold.
The median gross weekly salary in Chichester is £678.20, which equates to £2,939 per month or £35,264 per year. This is below the South East regional median of £800.30 per week and the Great Britain median of £752.40 per week. Data from the Nomis Labour Market Profile (ASHE 2025).
| Rank | Area | Rent as % of Income |
|---|---|---|
| 1 | GU27 (Haslemere) | 64.1% |
| 2 | BN18 (Arundel) | 55.5% |
| 3 | GU29 (Midhurst) | 53.1% |
| 4 | PO19 (Chichester City Centre) | 52.6% |
| 5 | PO18 (Bosham, Boxgrove) | 52.5% |
| 6 | PO20 (Selsey, Witterings) | 48.5% |
| — | GU28 (Petworth) | Not enough data |
| — | PO10 (Emsworth) | Not enough data |
GU27 (Haslemere) tops the table at 64.1%, meaning average rents of £1,885 per month consume nearly two-thirds of the local median salary. In practice, many GU27 tenants are likely to earn above the district median. Haslemere's proximity to the Surrey border means its tenant pool draws on higher regional earnings rather than local Chichester salaries alone.
PO20 (Selsey, Witterings) shows the lowest rent-to-income ratio at 48.5%. That is still above the 30% benchmark. This rent-to-income pattern across the district reflects the mismatch between Chichester's premium property prices (which drive high rents) and its local salary levels, which lag behind the wider South East.
Thinking of Buying?
We have off-market investment properties averaging 8%+ annual yield.
View Property DealsBuy-to-Let Considerations
Are House Prices High in Chichester? Price-to-Earnings Ratios
Purchasing a property in Chichester requires between 11.6 and 18.4 times the median annual salary. This is based on the Nomis Labour Market Profile for Chichester showing the median gross annual income for Chichester residents is £35,264.
The national benchmark is 7.5x (England average price of £291,865 divided by the Great Britain median salary of £39,125). Every Chichester postcode exceeds this benchmark. The lowest ratio is PO19 at 11.6x. The highest is GU27 at 18.4x.
| Rank | Area | Price-to-Earnings Ratio |
|---|---|---|
| 1 | PO19 (Chichester City Centre) | 11.6x |
| 2 | GU29 (Midhurst) | 13.1x |
| 3 | BN18 (Arundel) | 13.4x |
| 4 | PO10 (Emsworth) | 13.4x |
| 5 | PO20 (Selsey, Witterings) | 13.4x |
| 6 | PO18 (Bosham, Boxgrove) | 15.8x |
| 7 | GU28 (Petworth) | 16.5x |
| 8 | GU27 (Haslemere) | 18.4x |
PO19 at 11.6x is the most affordable entry point in the district, but it is still 55% above the national benchmark of 7.5x. This is not a market where prices are accessible relative to local earnings. The P/E ratios reflect a district where property values are driven by demand from outside the local economy. Buyers relocating from London or the Surrey commuter belt bring higher household incomes that are not captured in the Chichester median salary figure.
GU27 (Haslemere) at 18.4x represents 2.5 times the national benchmark. At that multiple, mortgage serviceability relies on household incomes well above the local median. The cluster of three postcodes (BN18, PO10, PO20) at 13.4x sits in the middle. These areas offer a different profile to both the city centre and the rural north.
Deposit Requirements in Chichester
A 30% deposit is standard for buy-to-let mortgages. In Chichester, that means deposits ranging from £123,005 to £194,570. Even the lowest entry point requires over £120,000. This positions Chichester as a market for investors with substantial capital or existing equity rather than first-time landlords. Investors purchasing here will also need to factor in stamp duty and buy-to-let costs including the 5% surcharge for additional properties. For those exploring alternatives, our guide to buying investment property with no deposit covers other entry routes.
| Rank | Area | 30% Deposit Required |
|---|---|---|
| 1 | PO19 (Chichester City Centre) | £123,005 |
| 2 | GU29 (Midhurst) | £138,178 |
| 3 | BN18 (Arundel) | £141,379 |
| 4 | PO10 (Emsworth) | £141,614 |
| 5 | PO20 (Selsey, Witterings) | £141,791 |
| 6 | PO18 (Bosham, Boxgrove) | £167,675 |
| 7 | GU28 (Petworth) | £174,515 |
| 8 | GU27 (Haslemere) | £194,570 |
The difference between PO19's £123,005 deposit and GU27's £194,570 is £71,565. That is a significant capital gap. For investors with a fixed budget, the city centre provides entry to a higher-yielding, more liquid market. Each step up the deposit table moves into postcodes with lower yields, fewer monthly sales, and a more owner-occupier-dominated market. Repossessed properties occasionally appear in the district and can offer below-average entry prices.
Three postcodes cluster tightly between £141,379 and £141,791 (BN18, PO10, PO20). Despite near-identical deposit requirements, these postcodes differ significantly in character. BN18 (Arundel) is a historic market town, PO10 (Emsworth) is a harbour town on the Hampshire border, and PO20 covers the Selsey peninsula. The deposit table does not capture these differences, but the rental data and growth figures do.
What the Chichester Data Tells Buy-to-Let Investors
PO19 (Chichester City Centre) leads the district with a 4.5% gross yield, the lowest asking price of £410,018, and 32 sales per month. It is the one postcode where yield, price, and liquidity align for buy-to-let. A 30% deposit of £123,005 secures rental income of £1,547 per month. Five-year growth of 11.8% adds capital upside. The city centre's mix of professionals, university staff, and public sector workers provides a steady tenant pool.
BN18 (Arundel) and GU29 (Midhurst) are the next tier at 4.2% and 4.1% yields respectively. Both are market towns with lower transaction volumes (13 and 12 sales per month) and a different tenant profile. Arundel's tourist economy and period housing stock attract tenants looking for character over convenience. Five-year growth of 6.0% and 3.3% respectively trails PO19, but both areas offer stable, low-void environments.
The northern postcodes (GU27, GU28) and the harbour villages (PO18) present a different picture. Yields sit at 3.5% or below. Five-year growth is mixed. GU28 (Petworth) has no rental data and just 4 sales per month. PO18 (Bosham, Boxgrove) shows the strongest five-year growth at 13.2% but the lowest yield at 3.3%.
These postcodes are capital growth plays with limited rental market depth. Investors considering investment property in this district need to decide whether they prioritise income or appreciation.
Chichester does not currently have a selective licensing scheme in place. Landlords should check the latest position with the district council, as licensing requirements can change. For investors who prefer sourced deals, off-market properties may offer opportunities below the average asking prices shown in this guide.
How Chichester Compares
Chichester's mean asking price of £509,470 is higher than three of the four comparison locations, and its top yield of 4.5% is the lowest in this group. That combination defines Chichester's position. It is a premium market where investors pay more and receive less in rental income than nearby alternatives. The comparison clarifies what Chichester offers that the others do not: lower risk tenant profiles, constrained supply, and a track record of long-term capital preservation.
| Location | Mean Asking Price | Mean Monthly Rent | Top Gross Yield |
|---|---|---|---|
| Chichester | £509,470 | £1,598 | 4.5% |
| Brighton | £420,745 | £1,825 | 6.6% |
| Portsmouth | £284,807 | £1,351 | 7.0% |
| Eastbourne | £333,016 | £1,287 | 5.4% |
| Guildford | £639,106 | £2,259 | 6.3% |
Portsmouth offers the starkest contrast. At £284,807 mean asking price, it is 44% cheaper than Chichester and delivers 7.0% top yield. Rents are lower at £1,351 per month, but the yield gap is substantial. Investors prioritising income can deploy less capital in Portsmouth and earn a higher return.
Guildford is the only location in this group more expensive than Chichester at £639,106. Yet Guildford's top yield of 6.3% is higher. Its proximity to London and the University of Surrey drive rental demand that Chichester's rural district does not match. Even in the premium South East market, Chichester's yields are unusually compressed. For more South East comparisons, see our guide to the best buy to let areas across England.
Brighton sits between Portsmouth and Chichester on price at £420,745. Its 6.6% top yield and £1,825 mean rent reflect a large, diverse rental market with strong student and young professional demand. Eastbourne at £333,016 and 5.4% yield offers a coastal alternative at a lower price point. Both deliver higher yields than Chichester at lower entry costs.
Frequently Asked Questions
Is Chichester expensive to live in?
Chichester property prices are 51.1% above the England average. The average sold price of £441,151 compares to £291,865 nationally. Asking prices range from £410,018 in PO19 (Chichester City Centre) to £648,567 in GU27 (Haslemere). Rents consume between 48.5% and 64.1% of the local median gross monthly salary of £2,939.
Local earnings at £678.20 per week sit below both the South East regional median (£800.30) and the Great Britain median (£752.40). The data points to a high cost of living relative to local incomes, particularly in the northern postcodes near the Surrey border.
What are the best places to live in Chichester district?
Chichester district spans eight postcodes, each with a distinct character. PO19 (Chichester City Centre) offers the best access to shops, restaurants, the cathedral, and transport links, with the lowest asking prices at £410,018. PO18 (Bosham, Boxgrove) covers sought-after harbour villages with the strongest five-year growth at 13.2%. BN18 (Arundel) is a market town with a Norman castle and independent shops.
PO20 (Selsey, Witterings) provides coastal living with the highest transaction volumes. GU27 (Haslemere), GU28 (Petworth), and GU29 (Midhurst) are South Downs market towns with larger properties and higher prices. The choice depends on whether proximity to the city, the coast, or the countryside matters most.
How does Chichester compare to Portsmouth for buy-to-let?
Portsmouth is 44% cheaper and delivers significantly higher yields. Portsmouth's mean asking price of £284,807 compares to Chichester's £509,470, and its top yield of 7.0% is well above Chichester's 4.5%. Portsmouth offers more accessible entry, higher rental income relative to price, and a larger tenant pool driven by the naval base and university.
Chichester offers lower yields but a different tenant demographic, constrained housing supply, and 430% price growth over 30 years. Portsmouth is an income play. Chichester is a capital preservation play. Full analysis in our Portsmouth buy-to-let guide.
Is Chichester a good place to live?
Chichester is a cathedral city in West Sussex with a population of 124,068 (2021 Census). The city centre is compact, with a medieval street plan centred on the Market Cross. The South Downs National Park borders the district to the north. Goodwood hosts internationally recognised horse racing, motor sport, and aviation events. Chichester Festival Theatre has a national reputation.
The Witterings and Selsey coast are within the district. Transport links include direct trains to London Victoria (around 90 minutes) and the A27. Employment is concentrated in tourism, hospitality, public services, and agriculture. Property prices are 51.1% above the England average, and rents take between 48.5% and 64.1% of local median income.
Does Chichester University affect the rental market?
The University of Chichester has campuses in the city centre and at Bishop Otter. The student population creates rental demand in PO19, particularly for flats and shared houses. Student lets operate differently to standard buy-to-let, with academic-year tenancies and higher management requirements. The university's presence supports PO19's position as the highest-yielding postcode in the district at 4.5%.
Are there new build flats available in Chichester?
New build development in Chichester is constrained by the South Downs National Park and the district's rural character. The Southern Gateway regeneration project is the largest current scheme, with up to 365 new residential dwellings planned south of the city centre. Persimmon Homes has planning approval for 165 homes at Madgwick Lane near Goodwood. New build flats and houses in Chichester tend to carry a premium over existing stock. The limited pipeline of new supply is one factor that supports long-term price stability in the district.
What is the average house price in Chichester?
The average sold property price in Chichester is £441,151 as of December 2025 (HM Land Registry data). Detached houses average £697,510, semi-detached £435,960, terraced £352,738, and flats £224,450. Asking prices across the eight postcodes range from £410,018 in PO19 (Chichester City Centre) to £648,567 in GU27 (Haslemere). The district sits 51.1% above the England average and 16.5% above the South East average of £378,800. Prices grew 430% over the last 30 years, from £83,232 in January 1996 to £441,151 in December 2025.