

Hertfordshire is a county in the East of England, sitting directly north of London and running from the Chiltern Hills in the west across to the Lea Valley in the east. It is one of the closest counties to the capital, and for a property investor that proximity is the whole story: London salaries feed into towns where the housing still costs a good deal less than a comparable London postcode.
The average home in Hertfordshire sold for £467,988 in the year to March 2026 (HM Land Registry). That is 61% above the England average of £289,946, so nobody should mistake this for a cheap county. What it offers instead is a wide spread. The gross rental yield reaches 6.1% in the best postcode, while the county average price would need a 30% deposit of £140,396 to buy outright. The gap between the towns that generate income and the towns that hold value is where the decisions get made here.
This hub pulls together the Hertfordshire town guides and then reads the county-wide market data underneath them, so you can see how the individual towns fit into the bigger picture before you narrow down.
Article updated: July 2026
Explore Hertfordshire town guides
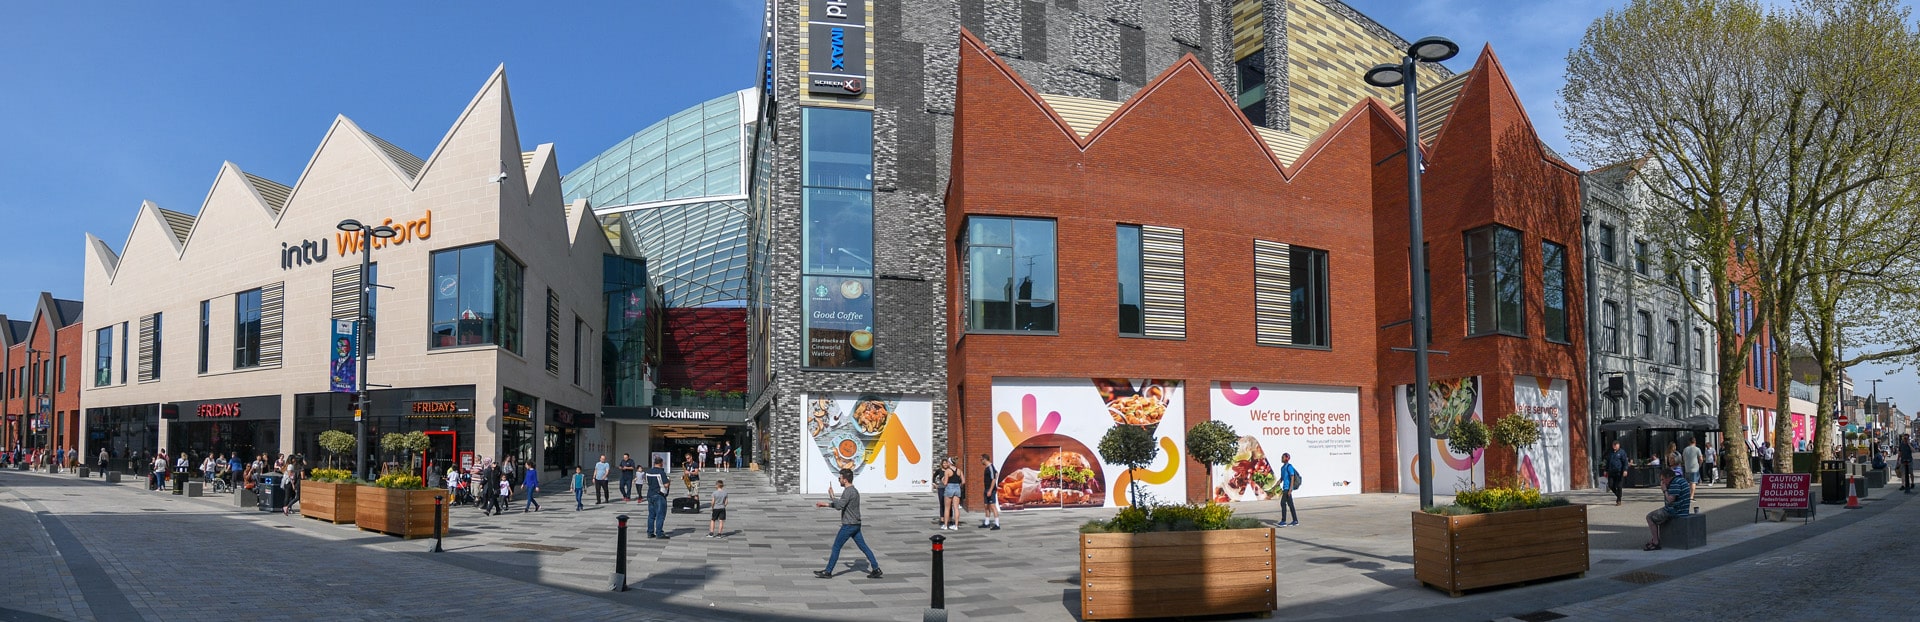
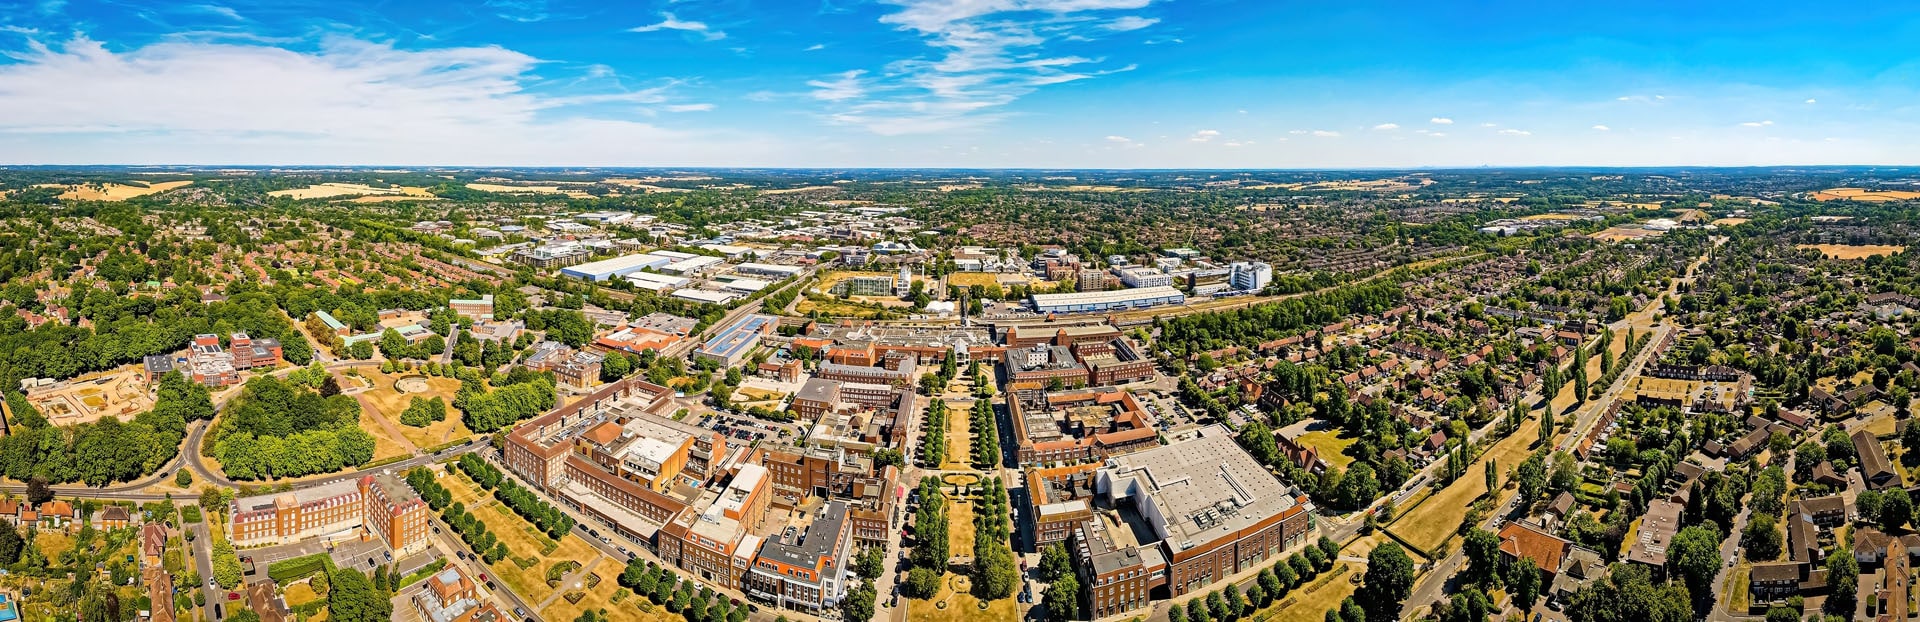
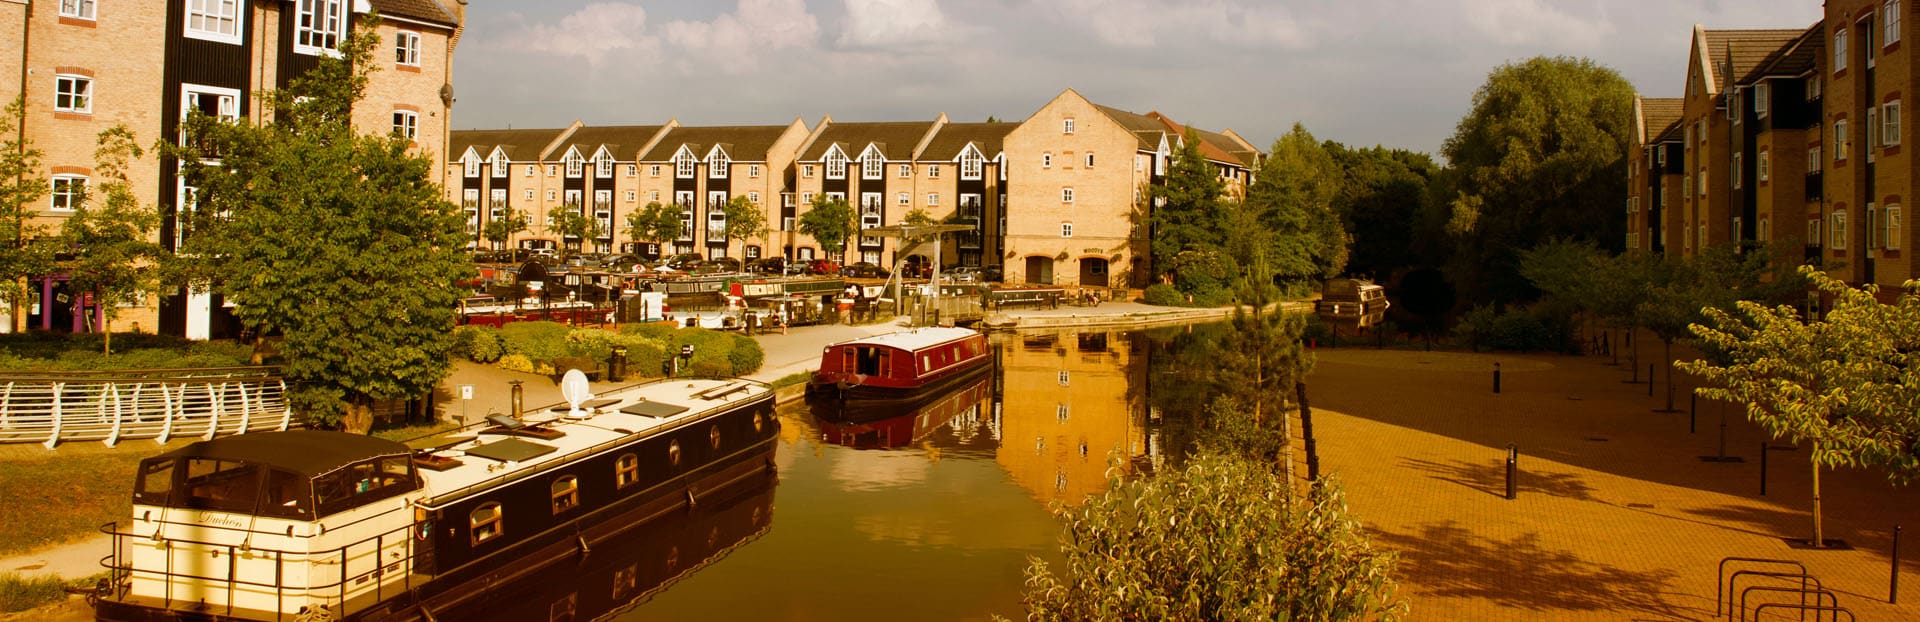
Compare local yields and sold prices across Hertfordshire's town guides before the county market analysis.


The Hertfordshire property market
Hertfordshire's Land Registry series goes back to January 1995, when the average home sold for £75,204. It has multiplied more than six times since. Following that line through the property cycles tells you more than any single headline figure, because a county this close to London tracks the capital's booms and corrections closely.
The pre-crash top came in January 2008 at £271,906. When the financial crisis hit, prices fell to £228,567 by April 2009, a drop of 15.9% over fifteen months. That was a real correction, though less brutal than parts of inner London saw. Recovery was slow. Prices did not sustainably clear the old 2008 peak until June 2013, when the average reached £272,896 and kept climbing.
What followed was the London-affordability spillover. As buyers priced out of the capital looked one train stop further out, Hertfordshire prices ran hard through the mid-2010s and again during the pandemic, reaching an all-time high of £469,572 in October 2022. Higher mortgage rates then took some heat out, but the county has held its ground: the March 2026 average of £467,988 sits within a whisker of that peak. Over five years prices are up 11.2%, and over the full 30-year record they are up 522%.
The charts below break the county series out by property type, so you can see how differently the tiers move.
- All property types
- Detached
- Semi-detached
- Terraced
- Flats
Source: HM Land Registry House Price Index
| Year | All property types | Detached | Semi-detached | Terraced | Flats |
|---|---|---|---|---|---|
| 1995-01 | £75,204 | £157,342 | £83,299 | £61,559 | £51,294 |
| 1995-02 | £75,439 | £156,095 | £83,832 | £62,003 | £51,499 |
| 1995-03 | £75,236 | £155,131 | £83,563 | £62,037 | £51,283 |
| 1995-04 | £75,095 | £153,995 | £83,486 | £62,032 | £51,266 |
| 1995-05 | £75,071 | £154,238 | £83,498 | £61,949 | £51,208 |
| 1995-06 | £74,971 | £154,045 | £83,553 | £61,676 | £51,299 |
| 1995-07 | £75,650 | £156,015 | £84,396 | £62,257 | £51,445 |
| 1995-08 | £75,759 | £156,953 | £84,558 | £62,349 | £51,218 |
| 1995-09 | £76,122 | £158,551 | £84,926 | £62,694 | £51,107 |
| 1995-10 | £75,185 | £156,804 | £83,965 | £61,774 | £50,567 |
| 1995-11 | £75,031 | £156,204 | £83,799 | £61,538 | £50,730 |
| 1995-12 | £74,764 | £155,088 | £83,524 | £61,371 | £50,661 |
| 1996-01 | £75,107 | £155,968 | £83,914 | £61,713 | £50,730 |
| 1996-02 | £74,892 | £155,463 | £83,599 | £61,681 | £50,463 |
| 1996-03 | £74,867 | £156,021 | £83,749 | £61,560 | £50,240 |
| 1996-04 | £75,111 | £155,986 | £83,857 | £61,944 | £50,473 |
| 1996-05 | £75,577 | £156,494 | £84,391 | £62,519 | £50,670 |
| 1996-06 | £76,144 | £157,270 | £84,756 | £63,007 | £51,393 |
| 1996-07 | £76,681 | £159,143 | £85,527 | £63,306 | £51,539 |
| 1996-08 | £77,504 | £162,252 | £86,543 | £63,781 | £51,772 |
| 1996-09 | £78,123 | £164,799 | £87,372 | £64,282 | £51,602 |
| 1996-10 | £78,390 | £165,790 | £87,741 | £64,470 | £51,605 |
| 1996-11 | £78,626 | £165,527 | £87,983 | £64,698 | £52,021 |
| 1996-12 | £79,174 | £165,946 | £88,799 | £65,202 | £52,427 |
| 1997-01 | £80,264 | £168,315 | £90,039 | £66,154 | £53,020 |
| 1997-02 | £81,033 | £170,712 | £90,902 | £66,651 | £53,387 |
| 1997-03 | £81,964 | £172,882 | £91,683 | £67,447 | £54,042 |
| 1997-04 | £82,321 | £173,206 | £92,146 | £67,752 | £54,360 |
| 1997-05 | £83,543 | £175,681 | £93,800 | £68,870 | £54,868 |
| 1997-06 | £85,027 | £179,392 | £95,746 | £70,047 | £55,528 |
| 1997-07 | £87,369 | £184,940 | £98,550 | £72,024 | £56,693 |
| 1997-08 | £89,512 | £190,211 | £100,997 | £73,724 | £57,911 |
| 1997-09 | £90,985 | £193,893 | £102,837 | £74,869 | £58,663 |
| 1997-10 | £92,699 | £197,823 | £104,841 | £76,091 | £59,874 |
| 1997-11 | £93,390 | £199,676 | £105,605 | £76,589 | £60,298 |
| 1997-12 | £94,608 | £201,764 | £107,054 | £77,641 | £61,137 |
| 1998-01 | £94,898 | £203,446 | £107,182 | £77,851 | £61,153 |
| 1998-02 | £95,449 | £203,733 | £107,698 | £78,297 | £61,811 |
| 1998-03 | £95,917 | £205,168 | £108,162 | £78,689 | £61,974 |
| 1998-04 | £96,801 | £205,827 | £109,322 | £79,609 | £62,551 |
| 1998-05 | £98,663 | £209,600 | £111,493 | £81,400 | £63,444 |
| 1998-06 | £100,046 | £211,748 | £112,841 | £82,540 | £64,690 |
| 1998-07 | £101,523 | £215,858 | £114,649 | £83,627 | £65,446 |
| 1998-08 | £102,269 | £219,338 | £115,459 | £83,978 | £65,739 |
| 1998-09 | £103,183 | £222,512 | £116,591 | £84,660 | £66,005 |
| 1998-10 | £103,382 | £222,592 | £116,673 | £84,753 | £66,401 |
| 1998-11 | £103,836 | £222,782 | £117,180 | £85,051 | £67,010 |
| 1998-12 | £103,507 | £221,069 | £116,890 | £84,731 | £67,097 |
| 1999-01 | £103,571 | £221,445 | £116,915 | £84,788 | £67,093 |
| 1999-02 | £103,791 | £222,404 | £117,182 | £84,829 | £67,260 |
| 1999-03 | £104,146 | £223,687 | £117,336 | £85,048 | £67,573 |
| 1999-04 | £105,076 | £224,790 | £118,178 | £86,033 | £68,270 |
| 1999-05 | £105,916 | £225,442 | £119,066 | £87,044 | £68,764 |
| 1999-06 | £107,601 | £229,222 | £121,000 | £88,486 | £69,710 |
| 1999-07 | £109,688 | £235,235 | £123,430 | £90,006 | £70,825 |
| 1999-08 | £111,256 | £239,833 | £125,035 | £91,243 | £71,654 |
| 1999-09 | £114,352 | £248,180 | £128,307 | £93,548 | £73,608 |
| 1999-10 | £116,183 | £251,402 | £130,316 | £94,830 | £75,286 |
| 1999-11 | £118,988 | £257,467 | £133,453 | £96,908 | £77,374 |
| 1999-12 | £120,573 | £258,466 | £135,205 | £98,368 | £78,882 |
| 2000-01 | £123,062 | £264,871 | £138,137 | £100,415 | £80,112 |
| 2000-02 | £124,121 | £266,741 | £139,206 | £101,449 | £80,742 |
| 2000-03 | £125,507 | £270,757 | £140,918 | £102,617 | £81,182 |
| 2000-04 | £127,978 | £274,473 | £143,515 | £104,683 | £83,210 |
| 2000-05 | £131,919 | £282,792 | £148,313 | £107,649 | £85,877 |
| 2000-06 | £134,598 | £287,948 | £151,354 | £109,695 | £87,898 |
| 2000-07 | £135,985 | £293,219 | £153,106 | £110,639 | £88,357 |
| 2000-08 | £136,854 | £296,355 | £153,925 | £111,090 | £88,983 |
| 2000-09 | £138,893 | £303,177 | £155,964 | £112,437 | £90,208 |
| 2000-10 | £139,256 | £303,279 | £156,366 | £112,598 | £90,753 |
| 2000-11 | £138,817 | £302,656 | £155,713 | £112,138 | £90,588 |
| 2000-12 | £137,758 | £298,348 | £154,471 | £111,266 | £90,428 |
| 2001-01 | £139,500 | £302,400 | £156,140 | £112,720 | £91,609 |
| 2001-02 | £141,066 | £305,167 | £157,976 | £114,192 | £92,512 |
| 2001-03 | £143,293 | £310,623 | £160,665 | £116,122 | £93,572 |
| 2001-04 | £143,320 | £309,621 | £160,408 | £116,523 | £93,551 |
| 2001-05 | £145,458 | £312,680 | £162,649 | £118,449 | £95,200 |
| 2001-06 | £147,030 | £314,867 | £164,137 | £119,733 | £96,708 |
| 2001-07 | £149,990 | £321,733 | £167,709 | £121,893 | £98,677 |
| 2001-08 | £152,238 | £327,950 | £169,939 | £123,624 | £100,100 |
| 2001-09 | £154,392 | £334,497 | £172,277 | £125,124 | £101,390 |
| 2001-10 | £155,195 | £336,418 | £173,171 | £125,474 | £102,268 |
| 2001-11 | £155,468 | £336,230 | £173,875 | £125,263 | £102,966 |
| 2001-12 | £155,829 | £334,160 | £174,373 | £125,433 | £104,063 |
| 2002-01 | £157,487 | £337,224 | £176,186 | £126,713 | £105,400 |
| 2002-02 | £158,446 | £338,195 | £176,837 | £127,827 | £106,143 |
| 2002-03 | £160,338 | £342,460 | £178,811 | £129,616 | £107,083 |
| 2002-04 | £163,386 | £346,501 | £181,749 | £132,307 | £109,769 |
| 2002-05 | £167,410 | £353,801 | £186,388 | £135,616 | £112,630 |
| 2002-06 | £171,381 | £361,088 | £190,433 | £138,980 | £115,652 |
| 2002-07 | £175,052 | £369,728 | £194,455 | £142,168 | £117,642 |
| 2002-08 | £179,388 | £378,424 | £198,866 | £145,982 | £120,554 |
| 2002-09 | £182,963 | £386,065 | £203,061 | £149,020 | £122,603 |
| 2002-10 | £187,206 | £393,287 | £208,307 | £152,242 | £125,876 |
| 2002-11 | £191,170 | £402,051 | £212,664 | £155,109 | £128,936 |
| 2002-12 | £195,254 | £408,342 | £217,420 | £158,246 | £132,424 |
| 2003-01 | £198,320 | £413,840 | £220,004 | £161,097 | £134,808 |
| 2003-02 | £199,327 | £413,262 | £221,483 | £162,180 | £135,634 |
| 2003-03 | £201,120 | £417,366 | £223,179 | £163,931 | £136,544 |
| 2003-04 | £202,993 | £419,231 | £225,837 | £165,292 | £138,221 |
| 2003-05 | £204,271 | £420,403 | £227,055 | £166,893 | £138,886 |
| 2003-06 | £204,974 | £419,759 | £227,757 | £167,462 | £140,015 |
| 2003-07 | £204,235 | £418,009 | £227,121 | £167,291 | £138,868 |
| 2003-08 | £205,575 | £421,321 | £228,957 | £168,047 | £139,847 |
| 2003-09 | £205,597 | £421,502 | £229,144 | £168,503 | £139,122 |
| 2003-10 | £206,440 | £421,671 | £229,769 | £169,409 | £140,053 |
| 2003-11 | £205,859 | £419,587 | £229,148 | £169,034 | £139,758 |
| 2003-12 | £207,267 | £418,745 | £230,524 | £170,485 | £141,513 |
| 2004-01 | £209,569 | £424,093 | £233,152 | £172,076 | £143,248 |
| 2004-02 | £212,099 | £427,982 | £235,565 | £174,258 | £145,392 |
| 2004-03 | £214,422 | £433,620 | £237,786 | £176,112 | £146,911 |
| 2004-04 | £215,029 | £431,140 | £238,436 | £177,618 | £147,038 |
| 2004-05 | £217,051 | £430,487 | £240,527 | £180,128 | £148,658 |
| 2004-06 | £220,741 | £434,029 | £244,657 | £183,590 | £151,611 |
| 2004-07 | £222,950 | £437,348 | £247,427 | £185,535 | £153,065 |
| 2004-08 | £225,914 | £445,355 | £250,743 | £187,992 | £154,563 |
| 2004-09 | £226,356 | £448,214 | £251,545 | £188,230 | £154,349 |
| 2004-10 | £228,104 | £451,202 | £252,539 | £189,482 | £156,436 |
| 2004-11 | £229,044 | £451,465 | £253,105 | £190,271 | £157,734 |
| 2004-12 | £227,652 | £445,983 | £250,933 | £189,612 | £157,236 |
| 2005-01 | £227,599 | £446,854 | £250,481 | £189,813 | £156,905 |
| 2005-02 | £226,404 | £445,940 | £249,792 | £188,689 | £155,536 |
| 2005-03 | £226,085 | £445,804 | £249,809 | £188,456 | £154,944 |
| 2005-04 | £224,197 | £438,887 | £248,398 | £187,283 | £153,613 |
| 2005-05 | £224,339 | £436,060 | £247,782 | £187,872 | £154,338 |
| 2005-06 | £226,231 | £438,684 | £249,903 | £189,792 | £155,521 |
| 2005-07 | £228,030 | £443,559 | £252,022 | £191,239 | £156,437 |
| 2005-08 | £229,191 | £448,066 | £253,408 | £192,407 | £156,470 |
| 2005-09 | £230,037 | £451,836 | £254,182 | £192,942 | £156,828 |
| 2005-10 | £230,998 | £453,135 | £254,535 | £193,689 | £158,045 |
| 2005-11 | £230,306 | £450,346 | £254,008 | £192,971 | £157,914 |
| 2005-12 | £229,872 | £445,908 | £252,801 | £192,772 | £158,659 |
| 2006-01 | £229,706 | £446,686 | £252,882 | £192,936 | £157,849 |
| 2006-02 | £230,268 | £446,495 | £253,048 | £193,629 | £158,565 |
| 2006-03 | £230,690 | £449,706 | £254,215 | £194,074 | £157,848 |
| 2006-04 | £231,564 | £449,012 | £255,301 | £195,107 | £158,632 |
| 2006-05 | £233,683 | £454,284 | £258,154 | £196,785 | £159,647 |
| 2006-06 | £235,406 | £457,144 | £260,237 | £198,330 | £160,744 |
| 2006-07 | £238,727 | £465,546 | £264,226 | £201,161 | £162,358 |
| 2006-08 | £241,939 | £472,542 | £267,781 | £204,370 | £163,855 |
| 2006-09 | £245,089 | £480,724 | £271,546 | £206,970 | £165,433 |
| 2006-10 | £246,640 | £483,598 | £272,910 | £208,121 | £166,867 |
| 2006-11 | £247,008 | £484,484 | £273,675 | £208,238 | £167,089 |
| 2006-12 | £248,107 | £483,838 | £274,428 | £209,521 | £168,360 |
| 2007-01 | £249,417 | £487,220 | £276,165 | £210,572 | £168,966 |
| 2007-02 | £252,059 | £491,682 | £278,516 | £212,560 | £171,387 |
| 2007-03 | £253,166 | £495,414 | £279,769 | £213,562 | £171,674 |
| 2007-04 | £255,868 | £498,867 | £282,370 | £216,468 | £173,498 |
| 2007-05 | £257,649 | £500,597 | £284,149 | £218,504 | £174,675 |
| 2007-06 | £261,310 | £507,566 | £288,230 | £221,385 | £177,369 |
| 2007-07 | £263,691 | £514,572 | £290,993 | £223,158 | £178,650 |
| 2007-08 | £266,678 | £523,608 | £294,861 | £225,905 | £179,537 |
| 2007-09 | £269,230 | £531,140 | £297,757 | £228,006 | £180,754 |
| 2007-10 | £270,759 | £535,345 | £298,984 | £228,988 | £182,036 |
| 2007-11 | £271,529 | £537,647 | £299,538 | £229,156 | £182,966 |
| 2007-12 | £271,713 | £535,854 | £299,453 | £229,548 | £183,454 |
| 2008-01 | £271,906 | £537,276 | £299,668 | £229,522 | £183,543 |
| 2008-02 | £269,973 | £534,050 | £297,640 | £227,813 | £182,132 |
| 2008-03 | £268,259 | £533,217 | £296,471 | £226,320 | £180,140 |
| 2008-04 | £265,584 | £528,912 | £293,890 | £224,425 | £177,636 |
| 2008-05 | £265,719 | £529,681 | £294,385 | £224,832 | £177,196 |
| 2008-06 | £264,958 | £528,425 | £293,483 | £224,167 | £176,684 |
| 2008-07 | £264,707 | £527,471 | £293,485 | £223,910 | £176,513 |
| 2008-08 | £261,627 | £522,877 | £289,856 | £221,083 | £174,453 |
| 2008-09 | £255,427 | £514,066 | £282,618 | £215,393 | £170,189 |
| 2008-10 | £248,157 | £501,286 | £274,385 | £208,763 | £165,515 |
| 2008-11 | £240,619 | £486,611 | £266,167 | £202,137 | £160,580 |
| 2008-12 | £237,592 | £477,912 | £263,007 | £200,239 | £158,404 |
| 2009-01 | £235,430 | £473,112 | £260,055 | £198,424 | £157,312 |
| 2009-02 | £234,175 | £469,144 | £258,644 | £197,491 | £156,669 |
| 2009-03 | £229,983 | £460,397 | £253,743 | £193,622 | £154,411 |
| 2009-04 | £228,567 | £454,971 | £252,988 | £193,333 | £152,707 |
| 2009-05 | £229,288 | £455,750 | £254,169 | £194,376 | £152,665 |
| 2009-06 | £231,113 | £458,617 | £256,647 | £196,498 | £153,193 |
| 2009-07 | £233,831 | £465,758 | £260,272 | £198,873 | £154,056 |
| 2009-08 | £235,364 | £471,727 | £262,314 | £200,275 | £153,939 |
| 2009-09 | £239,707 | £483,069 | £267,631 | £203,900 | £155,816 |
| 2009-10 | £241,517 | £487,467 | £269,880 | £205,345 | £156,743 |
| 2009-11 | £245,350 | £494,924 | £273,959 | £209,175 | £158,849 |
| 2009-12 | £246,370 | £494,781 | £275,491 | £210,657 | £159,242 |
| 2010-01 | £248,958 | £503,131 | £279,182 | £213,112 | £159,347 |
| 2010-02 | £249,357 | £505,783 | £280,826 | £213,055 | £158,807 |
| 2010-03 | £250,976 | £513,872 | £282,519 | £213,824 | £159,268 |
| 2010-04 | £253,069 | £517,019 | £284,807 | £215,350 | £161,225 |
| 2010-05 | £256,181 | £522,247 | £287,738 | £218,247 | £163,654 |
| 2010-06 | £259,154 | £527,163 | £291,286 | £221,163 | £165,387 |
| 2010-07 | £261,578 | £534,475 | £293,664 | £223,631 | £166,065 |
| 2010-08 | £261,383 | £536,701 | £294,327 | £223,260 | £164,820 |
| 2010-09 | £263,722 | £544,726 | £297,162 | £224,903 | £165,569 |
| 2010-10 | £261,604 | £539,681 | £295,174 | £222,747 | £164,525 |
| 2010-11 | £262,030 | £540,312 | £295,123 | £222,843 | £165,454 |
| 2010-12 | £260,216 | £535,701 | £293,489 | £221,046 | £164,558 |
| 2011-01 | £261,723 | £542,209 | £294,876 | £221,810 | £165,226 |
| 2011-02 | £260,554 | £543,072 | £292,784 | £220,600 | £164,173 |
| 2011-03 | £259,702 | £545,556 | £290,896 | £219,686 | £163,176 |
| 2011-04 | £258,624 | £542,459 | £289,101 | £219,313 | £162,502 |
| 2011-05 | £260,869 | £541,804 | £292,048 | £221,528 | £164,696 |
| 2011-06 | £260,664 | £535,376 | £292,615 | £221,931 | £165,030 |
| 2011-07 | £262,237 | £536,085 | £294,845 | £223,004 | £166,645 |
| 2011-08 | £262,460 | £540,150 | £296,090 | £223,269 | £165,260 |
| 2011-09 | £264,301 | £548,243 | £298,240 | £224,433 | £165,711 |
| 2011-10 | £263,402 | £548,345 | £297,983 | £223,619 | £164,293 |
| 2011-11 | £261,778 | £544,574 | £295,385 | £221,813 | £164,214 |
| 2011-12 | £260,203 | £537,519 | £293,757 | £220,919 | £163,642 |
| 2012-01 | £261,156 | £537,702 | £295,298 | £222,246 | £163,922 |
| 2012-02 | £262,136 | £540,192 | £296,857 | £223,575 | £163,714 |
| 2012-03 | £264,123 | £542,774 | £299,247 | £225,266 | £165,334 |
| 2012-04 | £266,021 | £545,805 | £300,476 | £226,775 | £167,402 |
| 2012-05 | £267,390 | £546,467 | £302,141 | £228,101 | £168,592 |
| 2012-06 | £267,026 | £546,222 | £301,517 | £228,458 | £167,633 |
| 2012-07 | £266,779 | £546,689 | £301,440 | £228,358 | £166,979 |
| 2012-08 | £267,706 | £548,961 | £302,681 | £229,716 | £166,743 |
| 2012-09 | £270,091 | £556,599 | £305,524 | £231,212 | £168,005 |
| 2012-10 | £269,140 | £554,227 | £304,783 | £230,444 | £167,281 |
| 2012-11 | £269,706 | £555,735 | £305,126 | £230,728 | £167,925 |
| 2012-12 | £268,975 | £553,163 | £304,309 | £230,541 | £167,277 |
| 2013-01 | £269,415 | £555,591 | £305,333 | £230,795 | £166,985 |
| 2013-02 | £269,499 | £556,439 | £305,632 | £230,726 | £166,851 |
| 2013-03 | £270,347 | £558,944 | £306,579 | £230,778 | £167,818 |
| 2013-04 | £271,022 | £559,233 | £306,672 | £231,605 | £168,592 |
| 2013-05 | £271,366 | £559,387 | £307,178 | £231,828 | £168,950 |
| 2013-06 | £272,896 | £560,975 | £309,313 | £233,566 | £169,651 |
| 2013-07 | £275,755 | £566,704 | £312,773 | £236,077 | £171,291 |
| 2013-08 | £278,037 | £571,378 | £315,707 | £238,285 | £172,294 |
| 2013-09 | £278,692 | £575,194 | £316,146 | £238,819 | £172,291 |
| 2013-10 | £279,308 | £577,560 | £317,086 | £239,335 | £172,304 |
| 2013-11 | £280,758 | £579,759 | £318,763 | £240,545 | £173,405 |
| 2013-12 | £284,383 | £583,685 | £323,397 | £243,630 | £176,253 |
| 2014-01 | £288,074 | £590,113 | £327,354 | £246,561 | £179,156 |
| 2014-02 | £291,368 | £597,754 | £331,152 | £249,204 | £181,191 |
| 2014-03 | £293,370 | £602,015 | £333,521 | £250,759 | £182,474 |
| 2014-04 | £295,673 | £605,773 | £336,359 | £253,071 | £183,740 |
| 2014-05 | £299,432 | £610,793 | £340,473 | £256,723 | £186,339 |
| 2014-06 | £304,039 | £619,866 | £345,784 | £261,053 | £188,940 |
| 2014-07 | £309,193 | £629,820 | £352,015 | £265,741 | £191,898 |
| 2014-08 | £313,560 | £640,317 | £357,477 | £269,427 | £194,140 |
| 2014-09 | £317,876 | £650,099 | £362,319 | £272,955 | £196,789 |
| 2014-10 | £321,434 | £657,609 | £366,543 | £275,476 | £199,301 |
| 2014-11 | £323,400 | £661,705 | £368,589 | £276,888 | £200,800 |
| 2014-12 | £324,365 | £663,321 | £369,657 | £277,574 | £201,598 |
| 2015-01 | £325,334 | £666,072 | £370,948 | £277,962 | £202,321 |
| 2015-02 | £327,025 | £669,377 | £372,420 | £279,284 | £203,696 |
| 2015-03 | £327,657 | £671,995 | £373,820 | £279,303 | £203,963 |
| 2015-04 | £329,448 | £674,884 | £375,171 | £281,670 | £204,847 |
| 2015-05 | £332,187 | £678,848 | £379,111 | £284,102 | £206,485 |
| 2015-06 | £337,819 | £689,218 | £385,424 | £290,158 | £209,270 |
| 2015-07 | £342,971 | £699,105 | £392,048 | £294,564 | £212,298 |
| 2015-08 | £348,901 | £712,053 | £399,113 | £300,183 | £215,243 |
| 2015-09 | £353,093 | £723,122 | £403,515 | £303,087 | £218,030 |
| 2015-10 | £358,318 | £735,536 | £409,657 | £307,775 | £220,666 |
| 2015-11 | £362,399 | £744,928 | £414,285 | £310,995 | £223,211 |
| 2015-12 | £367,158 | £753,844 | £420,621 | £315,191 | £225,863 |
| 2016-01 | £371,196 | £760,248 | £426,127 | £318,223 | £228,730 |
| 2016-02 | £374,675 | £768,349 | £430,579 | £321,054 | £230,605 |
| 2016-03 | £377,671 | £776,017 | £433,353 | £323,197 | £232,750 |
| 2016-04 | £378,933 | £777,492 | £433,695 | £325,122 | £233,538 |
| 2016-05 | £385,900 | £784,918 | £440,529 | £331,450 | £239,480 |
| 2016-06 | £391,724 | £791,679 | £446,518 | £337,441 | £243,639 |
| 2016-07 | £398,801 | £805,656 | £454,958 | £343,045 | £248,350 |
| 2016-08 | £397,496 | £805,170 | £453,541 | £342,014 | £246,968 |
| 2016-09 | £400,039 | £811,746 | £457,285 | £343,690 | £248,310 |
| 2016-10 | £400,499 | £814,208 | £457,125 | £343,283 | £249,207 |
| 2016-11 | £402,575 | £821,771 | £459,539 | £343,958 | £250,668 |
| 2016-12 | £401,762 | £820,536 | £457,882 | £342,849 | £250,714 |
| 2017-01 | £401,100 | £819,665 | £457,074 | £342,331 | £250,182 |
| 2017-02 | £401,879 | £818,751 | £456,624 | £342,802 | £251,888 |
| 2017-03 | £402,052 | £819,077 | £456,626 | £342,509 | £252,435 |
| 2017-04 | £403,410 | £821,884 | £457,497 | £343,437 | £253,745 |
| 2017-05 | £404,463 | £822,214 | £459,463 | £344,421 | £254,375 |
| 2017-06 | £406,323 | £822,904 | £461,358 | £346,740 | £255,648 |
| 2017-07 | £407,906 | £823,816 | £463,824 | £347,919 | £256,963 |
| 2017-08 | £409,934 | £829,899 | £466,154 | £350,589 | £257,059 |
| 2017-09 | £412,028 | £837,674 | £469,552 | £351,967 | £257,588 |
| 2017-10 | £411,862 | £839,320 | £469,733 | £352,435 | £256,441 |
| 2017-11 | £411,328 | £837,913 | £469,989 | £351,539 | £256,172 |
| 2017-12 | £411,926 | £837,419 | £470,755 | £352,406 | £256,559 |
| 2018-01 | £413,436 | £840,101 | £472,898 | £353,460 | £257,598 |
| 2018-02 | £414,175 | £844,172 | £473,907 | £353,933 | £257,615 |
| 2018-03 | £411,017 | £839,423 | £470,988 | £351,643 | £254,760 |
| 2018-04 | £410,352 | £838,012 | £470,870 | £352,023 | £253,391 |
| 2018-05 | £408,257 | £834,243 | £469,301 | £351,301 | £250,864 |
| 2018-06 | £409,402 | £836,448 | £471,125 | £352,094 | £251,525 |
| 2018-07 | £409,208 | £840,382 | £471,209 | £351,470 | £250,786 |
| 2018-08 | £411,813 | £846,184 | £474,068 | £353,611 | £252,423 |
| 2018-09 | £413,115 | £851,254 | £475,611 | £355,264 | £252,355 |
| 2018-10 | £413,116 | £850,203 | £475,260 | £355,168 | £252,771 |
| 2018-11 | £411,130 | £849,240 | £473,455 | £353,482 | £250,754 |
| 2018-12 | £408,045 | £840,784 | £470,142 | £350,242 | £249,599 |
| 2019-01 | £403,525 | £832,865 | £465,486 | £346,202 | £246,460 |
| 2019-02 | £402,184 | £828,284 | £463,454 | £344,650 | £246,517 |
| 2019-03 | £401,863 | £828,723 | £463,270 | £344,837 | £245,685 |
| 2019-04 | £403,753 | £830,616 | £464,920 | £347,682 | £246,520 |
| 2019-05 | £403,728 | £828,947 | £465,484 | £348,604 | £245,801 |
| 2019-06 | £403,602 | £826,950 | £465,541 | £348,669 | £245,857 |
| 2019-07 | £404,639 | £828,558 | £467,137 | £349,142 | £246,753 |
| 2019-08 | £404,769 | £830,238 | £467,520 | £349,408 | £246,300 |
| 2019-09 | £407,089 | £836,595 | £469,056 | £351,978 | £247,454 |
| 2019-10 | £406,236 | £835,962 | £469,072 | £350,979 | £246,440 |
| 2019-11 | £405,501 | £835,726 | £468,930 | £349,909 | £245,745 |
| 2019-12 | £404,238 | £834,349 | £468,676 | £348,249 | £244,609 |
| 2020-01 | £404,003 | £833,387 | £468,269 | £348,858 | £243,976 |
| 2020-02 | £404,501 | £836,518 | £468,735 | £349,608 | £243,611 |
| 2020-03 | £403,144 | £834,875 | £467,190 | £348,488 | £242,498 |
| 2020-04 | £404,189 | £842,253 | £468,330 | £349,527 | £241,933 |
| 2020-05 | £403,532 | £840,709 | £467,800 | £348,035 | £242,230 |
| 2020-06 | £405,303 | £842,462 | £471,010 | £350,373 | £242,490 |
| 2020-07 | £405,711 | £840,371 | £471,719 | £350,689 | £243,279 |
| 2020-08 | £411,097 | £853,132 | £478,903 | £356,660 | £244,653 |
| 2020-09 | £413,936 | £864,156 | £482,335 | £358,985 | £245,303 |
| 2020-10 | £416,431 | £870,978 | £485,827 | £361,807 | £245,627 |
| 2020-11 | £418,402 | £875,311 | £487,616 | £364,018 | £246,583 |
| 2020-12 | £419,565 | £877,101 | £488,547 | £365,883 | £246,914 |
| 2021-01 | £421,111 | £874,086 | £489,740 | £367,490 | £249,239 |
| 2021-02 | £420,141 | £863,801 | £487,591 | £366,970 | £250,712 |
| 2021-03 | £420,799 | £855,779 | £487,091 | £368,112 | £253,405 |
| 2021-04 | £421,176 | £856,491 | £486,608 | £368,620 | £254,009 |
| 2021-05 | £421,419 | £857,635 | £486,673 | £369,144 | £253,800 |
| 2021-06 | £426,152 | £866,657 | £491,369 | £374,280 | £256,303 |
| 2021-07 | £427,013 | £873,670 | £493,003 | £374,052 | £256,012 |
| 2021-08 | £431,801 | £889,784 | £499,944 | £377,574 | £257,057 |
| 2021-09 | £433,605 | £898,208 | £503,377 | £378,313 | £256,891 |
| 2021-10 | £436,189 | £908,042 | £507,423 | £380,424 | £256,805 |
| 2021-11 | £438,775 | £916,281 | £510,707 | £382,287 | £257,817 |
| 2021-12 | £438,331 | £919,141 | £510,876 | £381,882 | £256,190 |
| 2022-01 | £442,907 | £926,993 | £517,016 | £386,727 | £258,034 |
| 2022-02 | £444,393 | £927,211 | £518,589 | £388,349 | £259,594 |
| 2022-03 | £446,837 | £934,408 | £522,341 | £389,789 | £260,678 |
| 2022-04 | £447,899 | £933,486 | £522,184 | £392,156 | £261,517 |
| 2022-05 | £450,693 | £938,592 | £525,970 | £395,636 | £261,855 |
| 2022-06 | £454,492 | £943,536 | £529,923 | £399,716 | £264,419 |
| 2022-07 | £459,396 | £954,302 | £537,347 | £403,966 | £266,073 |
| 2022-08 | £464,758 | £964,316 | £544,123 | £409,624 | £268,146 |
| 2022-09 | £467,887 | £972,655 | £548,687 | £412,901 | £268,249 |
| 2022-10 | £469,572 | £975,852 | £550,135 | £414,645 | £269,359 |
| 2022-11 | £467,156 | £971,978 | £546,943 | £412,508 | £267,868 |
| 2022-12 | £464,274 | £963,622 | £543,075 | £410,067 | £267,115 |
| 2023-01 | £462,588 | £961,891 | £542,123 | £407,867 | £265,764 |
| 2023-02 | £463,191 | £965,525 | £543,123 | £407,299 | £266,326 |
| 2023-03 | £463,720 | £972,330 | £545,167 | £405,962 | £265,911 |
| 2023-04 | £460,599 | £966,441 | £541,317 | £403,099 | £264,168 |
| 2023-05 | £454,251 | £952,367 | £533,364 | £397,482 | £260,963 |
| 2023-06 | £451,962 | £946,343 | £529,148 | £397,172 | £259,240 |
| 2023-07 | £451,963 | £945,706 | £529,594 | £397,922 | £258,578 |
| 2023-08 | £454,403 | £952,338 | £533,153 | £401,292 | £258,370 |
| 2023-09 | £455,197 | £953,858 | £534,946 | £402,025 | £258,436 |
| 2023-10 | £454,714 | £950,669 | £534,130 | £401,191 | £259,056 |
| 2023-11 | £451,228 | £943,386 | £530,985 | £396,532 | £257,898 |
| 2023-12 | £446,471 | £930,830 | £525,598 | £391,798 | £256,074 |
| 2024-01 | £447,989 | £935,782 | £527,825 | £393,001 | £256,473 |
| 2024-02 | £445,487 | £927,250 | £524,171 | £391,992 | £255,141 |
| 2024-03 | £444,548 | £924,377 | £521,797 | £391,753 | £254,994 |
| 2024-04 | £442,359 | £917,739 | £518,278 | £390,126 | £254,422 |
| 2024-05 | £446,296 | £924,099 | £522,384 | £393,808 | £257,173 |
| 2024-06 | £449,214 | £927,605 | £526,033 | £397,373 | £258,524 |
| 2024-07 | £449,330 | £926,969 | £526,726 | £398,877 | £257,399 |
| 2024-08 | £453,725 | £938,041 | £532,809 | £403,516 | £258,430 |
| 2024-09 | £459,109 | £956,538 | £540,678 | £407,314 | £259,886 |
| 2024-10 | £462,141 | £964,980 | £543,562 | £409,007 | £262,245 |
| 2024-11 | £460,538 | £962,621 | £542,520 | £406,923 | £261,243 |
| 2024-12 | £457,935 | £956,098 | £539,547 | £404,706 | £259,898 |
| 2025-01 | £458,543 | £958,599 | £541,616 | £405,971 | £258,747 |
| 2025-02 | £457,649 | £954,847 | £539,713 | £406,341 | £258,184 |
| 2025-03 | £460,387 | £950,239 | £541,100 | £410,070 | £262,028 |
| 2025-04 | £457,675 | £953,184 | £540,020 | £406,316 | £258,611 |
| 2025-05 | £455,776 | £953,200 | £538,725 | £404,247 | £256,475 |
| 2025-06 | £454,888 | £959,368 | £540,202 | £403,446 | £252,882 |
| 2025-07 | £457,601 | £956,003 | £542,517 | £407,835 | £255,346 |
| 2025-08 | £465,079 | £969,980 | £553,147 | £415,079 | £258,648 |
| 2025-09 | £466,060 | £974,772 | £555,749 | £416,201 | £257,729 |
| 2025-10 | £469,071 | £982,205 | £559,783 | £419,109 | £258,772 |
| 2025-11 | £465,832 | £975,645 | £554,765 | £416,692 | £257,110 |
| 2025-12 | £465,326 | £970,844 | £553,814 | £416,722 | £257,481 |
| 2026-01 | £464,367 | £967,152 | £553,631 | £416,690 | £256,290 |
| 2026-02 | £466,259 | £971,493 | £557,103 | £418,289 | £256,805 |
| 2026-03 | £467,988 | £978,102 | £560,373 | £420,345 | £256,146 |
- All property types
- Detached
- Semi-detached
- Terraced
- Flats
Source: HM Land Registry House Price Index
| Year | All property types | Detached | Semi-detached | Terraced | Flats |
|---|---|---|---|---|---|
| 1996-01 | -0.1% | -0.9% | +0.7% | +0.3% | -1.1% |
| 1996-02 | -0.7% | -0.4% | -0.3% | -0.5% | -2.0% |
| 1996-03 | -0.5% | +0.6% | +0.2% | -0.8% | -2.0% |
| 1996-04 | 0.0% | +1.3% | +0.4% | -0.1% | -1.5% |
| 1996-05 | +0.7% | +1.5% | +1.1% | +0.9% | -1.1% |
| 1996-06 | +1.6% | +2.1% | +1.4% | +2.2% | +0.2% |
| 1996-07 | +1.4% | +2.0% | +1.3% | +1.7% | +0.2% |
| 1996-08 | +2.3% | +3.4% | +2.3% | +2.3% | +1.1% |
| 1996-09 | +2.6% | +3.9% | +2.9% | +2.5% | +1.0% |
| 1996-10 | +4.3% | +5.7% | +4.5% | +4.4% | +2.1% |
| 1996-11 | +4.8% | +6.0% | +5.0% | +5.1% | +2.5% |
| 1996-12 | +5.9% | +7.0% | +6.3% | +6.2% | +3.5% |
| 1997-01 | +6.9% | +7.9% | +7.3% | +7.2% | +4.5% |
| 1997-02 | +8.2% | +9.8% | +8.7% | +8.1% | +5.8% |
| 1997-03 | +9.5% | +10.8% | +9.5% | +9.6% | +7.6% |
| 1997-04 | +9.6% | +11.0% | +9.9% | +9.4% | +7.7% |
| 1997-05 | +10.5% | +12.3% | +11.1% | +10.2% | +8.3% |
| 1997-06 | +11.7% | +14.1% | +13.0% | +11.2% | +8.0% |
| 1997-07 | +13.9% | +16.2% | +15.2% | +13.8% | +10.0% |
| 1997-08 | +15.5% | +17.2% | +16.7% | +15.6% | +11.9% |
| 1997-09 | +16.5% | +17.7% | +17.7% | +16.5% | +13.7% |
| 1997-10 | +18.3% | +19.3% | +19.5% | +18.0% | +16.0% |
| 1997-11 | +18.8% | +20.6% | +20.0% | +18.4% | +15.9% |
| 1997-12 | +19.5% | +21.6% | +20.6% | +19.1% | +16.6% |
| 1998-01 | +18.2% | +20.9% | +19.0% | +17.7% | +15.3% |
| 1998-02 | +17.8% | +19.3% | +18.5% | +17.5% | +15.8% |
| 1998-03 | +17.0% | +18.7% | +18.0% | +16.7% | +14.7% |
| 1998-04 | +17.6% | +18.8% | +18.6% | +17.5% | +15.1% |
| 1998-05 | +18.1% | +19.3% | +18.9% | +18.2% | +15.6% |
| 1998-06 | +17.7% | +18.0% | +17.9% | +17.8% | +16.5% |
| 1998-07 | +16.2% | +16.7% | +16.3% | +16.1% | +15.4% |
| 1998-08 | +14.3% | +15.3% | +14.3% | +13.9% | +13.5% |
| 1998-09 | +13.4% | +14.8% | +13.4% | +13.1% | +12.5% |
| 1998-10 | +11.5% | +12.5% | +11.3% | +11.4% | +10.9% |
| 1998-11 | +11.2% | +11.6% | +11.0% | +11.0% | +11.1% |
| 1998-12 | +9.4% | +9.6% | +9.2% | +9.1% | +9.7% |
| 1999-01 | +9.1% | +8.8% | +9.1% | +8.9% | +9.7% |
| 1999-02 | +8.7% | +9.2% | +8.8% | +8.3% | +8.8% |
| 1999-03 | +8.6% | +9.0% | +8.5% | +8.1% | +9.0% |
| 1999-04 | +8.5% | +9.2% | +8.1% | +8.1% | +9.1% |
| 1999-05 | +7.4% | +7.6% | +6.8% | +6.9% | +8.4% |
| 1999-06 | +7.6% | +8.3% | +7.2% | +7.2% | +7.8% |
| 1999-07 | +8.0% | +9.0% | +7.7% | +7.6% | +8.2% |
| 1999-08 | +8.8% | +9.3% | +8.3% | +8.7% | +9.0% |
| 1999-09 | +10.8% | +11.5% | +10.0% | +10.5% | +11.5% |
| 1999-10 | +12.4% | +12.9% | +11.7% | +11.9% | +13.4% |
| 1999-11 | +14.6% | +15.6% | +13.9% | +13.9% | +15.5% |
| 1999-12 | +16.5% | +16.9% | +15.7% | +16.1% | +17.6% |
| 2000-01 | +18.8% | +19.6% | +18.2% | +18.4% | +19.4% |
| 2000-02 | +19.6% | +19.9% | +18.8% | +19.6% | +20.0% |
| 2000-03 | +20.5% | +21.0% | +20.1% | +20.7% | +20.1% |
| 2000-04 | +21.8% | +22.1% | +21.4% | +21.7% | +21.9% |
| 2000-05 | +24.6% | +25.4% | +24.6% | +23.7% | +24.9% |
| 2000-06 | +25.1% | +25.6% | +25.1% | +24.0% | +26.1% |
| 2000-07 | +24.0% | +24.6% | +24.0% | +22.9% | +24.8% |
| 2000-08 | +23.0% | +23.6% | +23.1% | +21.8% | +24.2% |
| 2000-09 | +21.5% | +22.2% | +21.6% | +20.2% | +22.6% |
| 2000-10 | +19.9% | +20.6% | +20.0% | +18.7% | +20.5% |
| 2000-11 | +16.7% | +17.6% | +16.7% | +15.7% | +17.1% |
| 2000-12 | +14.3% | +15.4% | +14.2% | +13.1% | +14.6% |
| 2001-01 | +13.4% | +14.2% | +13.0% | +12.3% | +14.4% |
| 2001-02 | +13.7% | +14.4% | +13.5% | +12.6% | +14.6% |
| 2001-03 | +14.2% | +14.7% | +14.0% | +13.2% | +15.3% |
| 2001-04 | +12.0% | +12.8% | +11.8% | +11.3% | +12.4% |
| 2001-05 | +10.3% | +10.6% | +9.7% | +10.0% | +10.9% |
| 2001-06 | +9.2% | +9.3% | +8.4% | +9.2% | +10.0% |
| 2001-07 | +10.3% | +9.7% | +9.5% | +10.2% | +11.7% |
| 2001-08 | +11.2% | +10.7% | +10.4% | +11.3% | +12.5% |
| 2001-09 | +11.2% | +10.3% | +10.5% | +11.3% | +12.4% |
| 2001-10 | +11.4% | +10.9% | +10.7% | +11.4% | +12.7% |
| 2001-11 | +12.0% | +11.1% | +11.7% | +11.7% | +13.7% |
| 2001-12 | +13.1% | +12.0% | +12.9% | +12.7% | +15.1% |
| 2002-01 | +12.9% | +11.5% | +12.8% | +12.4% | +15.1% |
| 2002-02 | +12.3% | +10.8% | +11.9% | +11.9% | +14.7% |
| 2002-03 | +11.9% | +10.2% | +11.3% | +11.6% | +14.4% |
| 2002-04 | +14.0% | +11.9% | +13.3% | +13.5% | +17.3% |
| 2002-05 | +15.1% | +13.2% | +14.6% | +14.5% | +18.3% |
| 2002-06 | +16.6% | +14.7% | +16.0% | +16.1% | +19.6% |
| 2002-07 | +16.7% | +14.9% | +15.9% | +16.6% | +19.2% |
| 2002-08 | +17.8% | +15.4% | +17.0% | +18.1% | +20.4% |
| 2002-09 | +18.5% | +15.4% | +17.9% | +19.1% | +20.9% |
| 2002-10 | +20.6% | +16.9% | +20.3% | +21.3% | +23.1% |
| 2002-11 | +23.0% | +19.6% | +22.3% | +23.8% | +25.2% |
| 2002-12 | +25.3% | +22.2% | +24.7% | +26.2% | +27.3% |
| 2003-01 | +25.9% | +22.7% | +24.9% | +27.1% | +27.9% |
| 2003-02 | +25.8% | +22.2% | +25.2% | +26.9% | +27.8% |
| 2003-03 | +25.4% | +21.9% | +24.8% | +26.5% | +27.5% |
| 2003-04 | +24.2% | +21.0% | +24.3% | +24.9% | +25.9% |
| 2003-05 | +22.0% | +18.8% | +21.8% | +23.1% | +23.3% |
| 2003-06 | +19.6% | +16.2% | +19.6% | +20.5% | +21.1% |
| 2003-07 | +16.7% | +13.1% | +16.8% | +17.7% | +18.0% |
| 2003-08 | +14.6% | +11.3% | +15.1% | +15.1% | +16.0% |
| 2003-09 | +12.4% | +9.2% | +12.8% | +13.1% | +13.5% |
| 2003-10 | +10.3% | +7.2% | +10.3% | +11.3% | +11.3% |
| 2003-11 | +7.7% | +4.4% | +7.8% | +9.0% | +8.4% |
| 2003-12 | +6.2% | +2.5% | +6.0% | +7.7% | +6.9% |
| 2004-01 | +5.7% | +2.5% | +6.0% | +6.8% | +6.3% |
| 2004-02 | +6.4% | +3.6% | +6.4% | +7.4% | +7.2% |
| 2004-03 | +6.6% | +3.9% | +6.5% | +7.4% | +7.6% |
| 2004-04 | +5.9% | +2.8% | +5.6% | +7.5% | +6.4% |
| 2004-05 | +6.3% | +2.4% | +5.9% | +7.9% | +7.0% |
| 2004-06 | +7.7% | +3.4% | +7.4% | +9.6% | +8.3% |
| 2004-07 | +9.2% | +4.6% | +8.9% | +10.9% | +10.2% |
| 2004-08 | +9.9% | +5.7% | +9.5% | +11.9% | +10.5% |
| 2004-09 | +10.1% | +6.3% | +9.8% | +11.7% | +10.9% |
| 2004-10 | +10.5% | +7.0% | +9.9% | +11.8% | +11.7% |
| 2004-11 | +11.3% | +7.6% | +10.5% | +12.6% | +12.9% |
| 2004-12 | +9.8% | +6.5% | +8.9% | +11.2% | +11.1% |
| 2005-01 | +8.6% | +5.4% | +7.4% | +10.3% | +9.5% |
| 2005-02 | +6.7% | +4.2% | +6.0% | +8.3% | +7.0% |
| 2005-03 | +5.4% | +2.8% | +5.1% | +7.0% | +5.5% |
| 2005-04 | +4.3% | +1.8% | +4.2% | +5.4% | +4.5% |
| 2005-05 | +3.4% | +1.3% | +3.0% | +4.3% | +3.8% |
| 2005-06 | +2.5% | +1.1% | +2.1% | +3.4% | +2.6% |
| 2005-07 | +2.3% | +1.4% | +1.9% | +3.1% | +2.2% |
| 2005-08 | +1.5% | +0.6% | +1.1% | +2.3% | +1.2% |
| 2005-09 | +1.6% | +0.8% | +1.0% | +2.5% | +1.6% |
| 2005-10 | +1.3% | +0.4% | +0.8% | +2.2% | +1.0% |
| 2005-11 | +0.6% | -0.2% | +0.4% | +1.4% | +0.1% |
| 2005-12 | +1.0% | 0.0% | +0.7% | +1.7% | +0.9% |
| 2006-01 | +0.9% | 0.0% | +1.0% | +1.6% | +0.6% |
| 2006-02 | +1.7% | +0.1% | +1.3% | +2.6% | +1.9% |
| 2006-03 | +2.0% | +0.9% | +1.8% | +3.0% | +1.9% |
| 2006-04 | +3.3% | +2.3% | +2.8% | +4.2% | +3.3% |
| 2006-05 | +4.2% | +4.2% | +4.2% | +4.7% | +3.4% |
| 2006-06 | +4.1% | +4.2% | +4.1% | +4.5% | +3.4% |
| 2006-07 | +4.7% | +5.0% | +4.8% | +5.2% | +3.8% |
| 2006-08 | +5.6% | +5.5% | +5.7% | +6.2% | +4.7% |
| 2006-09 | +6.5% | +6.4% | +6.8% | +7.3% | +5.5% |
| 2006-10 | +6.8% | +6.7% | +7.2% | +7.5% | +5.6% |
| 2006-11 | +7.3% | +7.6% | +7.7% | +7.9% | +5.8% |
| 2006-12 | +7.9% | +8.5% | +8.6% | +8.7% | +6.1% |
| 2007-01 | +8.6% | +9.1% | +9.2% | +9.1% | +7.0% |
| 2007-02 | +9.5% | +10.1% | +10.1% | +9.8% | +8.1% |
| 2007-03 | +9.7% | +10.2% | +10.1% | +10.0% | +8.8% |
| 2007-04 | +10.5% | +11.1% | +10.6% | +10.9% | +9.4% |
| 2007-05 | +10.3% | +10.2% | +10.1% | +11.0% | +9.4% |
| 2007-06 | +11.0% | +11.0% | +10.8% | +11.6% | +10.3% |
| 2007-07 | +10.5% | +10.5% | +10.1% | +10.9% | +10.0% |
| 2007-08 | +10.2% | +10.8% | +10.1% | +10.5% | +9.6% |
| 2007-09 | +9.8% | +10.5% | +9.7% | +10.2% | +9.3% |
| 2007-10 | +9.8% | +10.7% | +9.6% | +10.0% | +9.1% |
| 2007-11 | +9.9% | +11.0% | +9.5% | +10.0% | +9.5% |
| 2007-12 | +9.5% | +10.8% | +9.1% | +9.6% | +9.0% |
| 2008-01 | +9.0% | +10.3% | +8.5% | +9.0% | +8.6% |
| 2008-02 | +7.1% | +8.6% | +6.9% | +7.2% | +6.3% |
| 2008-03 | +6.0% | +7.6% | +6.0% | +6.0% | +4.9% |
| 2008-04 | +3.8% | +6.0% | +4.1% | +3.7% | +2.4% |
| 2008-05 | +3.1% | +5.8% | +3.6% | +2.9% | +1.4% |
| 2008-06 | +1.4% | +4.1% | +1.8% | +1.3% | -0.4% |
| 2008-07 | +0.4% | +2.5% | +0.9% | +0.3% | -1.2% |
| 2008-08 | -1.9% | -0.1% | -1.7% | -2.1% | -2.8% |
| 2008-09 | -5.1% | -3.2% | -5.1% | -5.5% | -5.8% |
| 2008-10 | -8.3% | -6.4% | -8.2% | -8.8% | -9.1% |
| 2008-11 | -11.4% | -9.5% | -11.1% | -11.8% | -12.2% |
| 2008-12 | -12.6% | -10.8% | -12.2% | -12.8% | -13.7% |
| 2009-01 | -13.4% | -11.9% | -13.2% | -13.5% | -14.3% |
| 2009-02 | -13.3% | -12.2% | -13.1% | -13.3% | -14.0% |
| 2009-03 | -14.3% | -13.7% | -14.4% | -14.4% | -14.3% |
| 2009-04 | -13.9% | -14.0% | -13.9% | -13.9% | -14.0% |
| 2009-05 | -13.7% | -14.0% | -13.7% | -13.5% | -13.8% |
| 2009-06 | -12.8% | -13.2% | -12.6% | -12.3% | -13.3% |
| 2009-07 | -11.7% | -11.7% | -11.3% | -11.2% | -12.7% |
| 2009-08 | -10.0% | -9.8% | -9.5% | -9.4% | -11.8% |
| 2009-09 | -6.2% | -6.0% | -5.3% | -5.3% | -8.4% |
| 2009-10 | -2.7% | -2.8% | -1.6% | -1.6% | -5.3% |
| 2009-11 | +2.0% | +1.7% | +2.9% | +3.5% | -1.1% |
| 2009-12 | +3.7% | +3.5% | +4.7% | +5.2% | +0.5% |
| 2010-01 | +5.7% | +6.3% | +7.4% | +7.4% | +1.3% |
| 2010-02 | +6.5% | +7.8% | +8.6% | +7.9% | +1.4% |
| 2010-03 | +9.1% | +11.6% | +11.3% | +10.4% | +3.1% |
| 2010-04 | +10.7% | +13.6% | +12.6% | +11.4% | +5.6% |
| 2010-05 | +11.7% | +14.6% | +13.2% | +12.3% | +7.2% |
| 2010-06 | +12.1% | +14.9% | +13.5% | +12.6% | +8.0% |
| 2010-07 | +11.9% | +14.8% | +12.8% | +12.4% | +7.8% |
| 2010-08 | +11.1% | +13.8% | +12.2% | +11.5% | +7.1% |
| 2010-09 | +10.0% | +12.8% | +11.0% | +10.3% | +6.3% |
| 2010-10 | +8.3% | +10.7% | +9.4% | +8.5% | +5.0% |
| 2010-11 | +6.8% | +9.2% | +7.7% | +6.5% | +4.2% |
| 2010-12 | +5.6% | +8.3% | +6.5% | +4.9% | +3.3% |
| 2011-01 | +5.1% | +7.8% | +5.6% | +4.1% | +3.7% |
| 2011-02 | +4.5% | +7.4% | +4.3% | +3.5% | +3.4% |
| 2011-03 | +3.5% | +6.2% | +3.0% | +2.7% | +2.5% |
| 2011-04 | +2.2% | +4.9% | +1.5% | +1.8% | +0.8% |
| 2011-05 | +1.8% | +3.7% | +1.5% | +1.5% | +0.6% |
| 2011-06 | +0.6% | +1.6% | +0.5% | +0.3% | -0.2% |
| 2011-07 | +0.3% | +0.3% | +0.4% | -0.3% | +0.3% |
| 2011-08 | +0.4% | +0.6% | +0.6% | 0.0% | +0.3% |
| 2011-09 | +0.2% | +0.6% | +0.4% | -0.2% | +0.1% |
| 2011-10 | +0.7% | +1.6% | +1.0% | +0.4% | -0.1% |
| 2011-11 | -0.1% | +0.8% | +0.1% | -0.5% | -0.7% |
| 2011-12 | 0.0% | +0.3% | +0.1% | -0.1% | -0.6% |
| 2012-01 | -0.2% | -0.8% | +0.1% | +0.2% | -0.8% |
| 2012-02 | +0.6% | -0.5% | +1.4% | +1.3% | -0.3% |
| 2012-03 | +1.7% | -0.5% | +2.9% | +2.5% | +1.3% |
| 2012-04 | +2.9% | +0.6% | +3.9% | +3.4% | +3.0% |
| 2012-05 | +2.5% | +0.9% | +3.5% | +3.0% | +2.4% |
| 2012-06 | +2.4% | +2.0% | +3.0% | +2.9% | +1.6% |
| 2012-07 | +1.7% | +2.0% | +2.2% | +2.4% | +0.2% |
| 2012-08 | +2.0% | +1.6% | +2.2% | +2.9% | +0.9% |
| 2012-09 | +2.2% | +1.5% | +2.4% | +3.0% | +1.4% |
| 2012-10 | +2.2% | +1.1% | +2.3% | +3.1% | +1.8% |
| 2012-11 | +3.0% | +2.0% | +3.3% | +4.0% | +2.3% |
| 2012-12 | +3.4% | +2.9% | +3.6% | +4.4% | +2.2% |
| 2013-01 | +3.2% | +3.3% | +3.4% | +3.8% | +1.9% |
| 2013-02 | +2.8% | +3.0% | +3.0% | +3.2% | +1.9% |
| 2013-03 | +2.4% | +3.0% | +2.5% | +2.4% | +1.5% |
| 2013-04 | +1.9% | +2.5% | +2.1% | +2.1% | +0.7% |
| 2013-05 | +1.5% | +2.4% | +1.7% | +1.6% | +0.2% |
| 2013-06 | +2.2% | +2.7% | +2.6% | +2.2% | +1.2% |
| 2013-07 | +3.4% | +3.7% | +3.8% | +3.4% | +2.6% |
| 2013-08 | +3.9% | +4.1% | +4.3% | +3.7% | +3.3% |
| 2013-09 | +3.2% | +3.3% | +3.5% | +3.3% | +2.6% |
| 2013-10 | +3.8% | +4.2% | +4.0% | +3.9% | +3.0% |
| 2013-11 | +4.1% | +4.3% | +4.5% | +4.3% | +3.3% |
| 2013-12 | +5.7% | +5.5% | +6.3% | +5.7% | +5.4% |
| 2014-01 | +6.9% | +6.2% | +7.2% | +6.8% | +7.3% |
| 2014-02 | +8.1% | +7.4% | +8.4% | +8.0% | +8.6% |
| 2014-03 | +8.5% | +7.7% | +8.8% | +8.7% | +8.7% |
| 2014-04 | +9.1% | +8.3% | +9.7% | +9.3% | +9.0% |
| 2014-05 | +10.3% | +9.2% | +10.8% | +10.7% | +10.3% |
| 2014-06 | +11.4% | +10.5% | +11.8% | +11.8% | +11.4% |
| 2014-07 | +12.1% | +11.1% | +12.5% | +12.6% | +12.0% |
| 2014-08 | +12.8% | +12.1% | +13.2% | +13.1% | +12.7% |
| 2014-09 | +14.1% | +13.0% | +14.6% | +14.3% | +14.2% |
| 2014-10 | +15.1% | +13.9% | +15.6% | +15.1% | +15.7% |
| 2014-11 | +15.2% | +14.1% | +15.6% | +15.1% | +15.8% |
| 2014-12 | +14.1% | +13.6% | +14.3% | +13.9% | +14.4% |
| 2015-01 | +12.9% | +12.9% | +13.3% | +12.7% | +12.9% |
| 2015-02 | +12.2% | +12.0% | +12.5% | +12.1% | +12.4% |
| 2015-03 | +11.7% | +11.6% | +12.1% | +11.4% | +11.8% |
| 2015-04 | +11.4% | +11.4% | +11.5% | +11.3% | +11.5% |
| 2015-05 | +10.9% | +11.1% | +11.3% | +10.7% | +10.8% |
| 2015-06 | +11.1% | +11.2% | +11.5% | +11.1% | +10.8% |
| 2015-07 | +10.9% | +11.0% | +11.4% | +10.8% | +10.6% |
| 2015-08 | +11.3% | +11.2% | +11.6% | +11.4% | +10.9% |
| 2015-09 | +11.1% | +11.2% | +11.4% | +11.0% | +10.8% |
| 2015-10 | +11.5% | +11.9% | +11.8% | +11.7% | +10.7% |
| 2015-11 | +12.1% | +12.6% | +12.4% | +12.3% | +11.2% |
| 2015-12 | +13.2% | +13.6% | +13.8% | +13.6% | +12.0% |
| 2016-01 | +14.1% | +14.1% | +14.9% | +14.5% | +13.1% |
| 2016-02 | +14.6% | +14.8% | +15.6% | +15.0% | +13.2% |
| 2016-03 | +15.3% | +15.5% | +15.9% | +15.7% | +14.1% |
| 2016-04 | +15.0% | +15.2% | +15.6% | +15.4% | +14.0% |
| 2016-05 | +16.2% | +15.6% | +16.2% | +16.7% | +16.0% |
| 2016-06 | +16.0% | +14.9% | +15.9% | +16.3% | +16.4% |
| 2016-07 | +16.3% | +15.2% | +16.0% | +16.5% | +17.0% |
| 2016-08 | +13.9% | +13.1% | +13.6% | +13.9% | +14.7% |
| 2016-09 | +13.3% | +12.3% | +13.3% | +13.4% | +13.9% |
| 2016-10 | +11.8% | +10.7% | +11.6% | +11.5% | +12.9% |
| 2016-11 | +11.1% | +10.3% | +10.9% | +10.6% | +12.3% |
| 2016-12 | +9.4% | +8.8% | +8.9% | +8.8% | +11.0% |
| 2017-01 | +8.1% | +7.8% | +7.3% | +7.6% | +9.4% |
| 2017-02 | +7.3% | +6.6% | +6.0% | +6.8% | +9.2% |
| 2017-03 | +6.5% | +5.5% | +5.4% | +6.0% | +8.5% |
| 2017-04 | +6.5% | +5.7% | +5.5% | +5.6% | +8.7% |
| 2017-05 | +4.8% | +4.8% | +4.3% | +3.9% | +6.2% |
| 2017-06 | +3.7% | +3.9% | +3.3% | +2.8% | +4.9% |
| 2017-07 | +2.3% | +2.3% | +1.9% | +1.4% | +3.5% |
| 2017-08 | +3.1% | +3.1% | +2.8% | +2.5% | +4.1% |
| 2017-09 | +3.0% | +3.2% | +2.7% | +2.4% | +3.7% |
| 2017-10 | +2.8% | +3.1% | +2.8% | +2.7% | +2.9% |
| 2017-11 | +2.2% | +2.0% | +2.3% | +2.2% | +2.2% |
| 2017-12 | +2.5% | +2.1% | +2.8% | +2.8% | +2.3% |
| 2018-01 | +3.1% | +2.5% | +3.5% | +3.3% | +3.0% |
| 2018-02 | +3.1% | +3.1% | +3.8% | +3.2% | +2.3% |
| 2018-03 | +2.2% | +2.5% | +3.1% | +2.7% | +0.9% |
| 2018-04 | +1.7% | +2.0% | +2.9% | +2.5% | -0.1% |
| 2018-05 | +0.9% | +1.5% | +2.1% | +2.0% | -1.4% |
| 2018-06 | +0.8% | +1.6% | +2.1% | +1.5% | -1.6% |
| 2018-07 | +0.3% | +2.0% | +1.6% | +1.0% | -2.4% |
| 2018-08 | +0.5% | +2.0% | +1.7% | +0.9% | -1.8% |
| 2018-09 | +0.3% | +1.6% | +1.3% | +0.9% | -2.0% |
| 2018-10 | +0.3% | +1.3% | +1.2% | +0.8% | -1.4% |
| 2018-11 | 0.0% | +1.4% | +0.7% | +0.6% | -2.1% |
| 2018-12 | -0.9% | +0.4% | -0.1% | -0.6% | -2.7% |
| 2019-01 | -2.4% | -0.9% | -1.6% | -2.1% | -4.3% |
| 2019-02 | -2.9% | -1.9% | -2.2% | -2.6% | -4.3% |
| 2019-03 | -2.2% | -1.3% | -1.6% | -1.9% | -3.6% |
| 2019-04 | -1.6% | -0.9% | -1.3% | -1.2% | -2.7% |
| 2019-05 | -1.1% | -0.6% | -0.8% | -0.8% | -2.0% |
| 2019-06 | -1.4% | -1.1% | -1.2% | -1.0% | -2.3% |
| 2019-07 | -1.1% | -1.4% | -0.9% | -0.7% | -1.6% |
| 2019-08 | -1.7% | -1.9% | -1.4% | -1.2% | -2.4% |
| 2019-09 | -1.5% | -1.7% | -1.4% | -0.9% | -1.9% |
| 2019-10 | -1.7% | -1.7% | -1.3% | -1.2% | -2.5% |
| 2019-11 | -1.4% | -1.6% | -1.0% | -1.0% | -2.0% |
| 2019-12 | -0.9% | -0.8% | -0.3% | -0.6% | -2.0% |
| 2020-01 | +0.1% | +0.1% | +0.6% | +0.8% | -1.0% |
| 2020-02 | +0.6% | +1.0% | +1.1% | +1.4% | -1.2% |
| 2020-03 | +0.3% | +0.7% | +0.8% | +1.1% | -1.3% |
| 2020-04 | +0.1% | +1.4% | +0.7% | +0.5% | -1.9% |
| 2020-05 | 0.0% | +1.4% | +0.5% | -0.2% | -1.5% |
| 2020-06 | +0.4% | +1.9% | +1.2% | +0.5% | -1.4% |
| 2020-07 | +0.3% | +1.4% | +1.0% | +0.4% | -1.4% |
| 2020-08 | +1.6% | +2.8% | +2.4% | +2.1% | -0.7% |
| 2020-09 | +1.7% | +3.3% | +2.8% | +2.0% | -0.9% |
| 2020-10 | +2.5% | +4.2% | +3.6% | +3.1% | -0.3% |
| 2020-11 | +3.2% | +4.7% | +4.0% | +4.0% | +0.3% |
| 2020-12 | +3.8% | +5.1% | +4.2% | +5.1% | +0.9% |
| 2021-01 | +4.2% | +4.9% | +4.6% | +5.3% | +2.2% |
| 2021-02 | +3.9% | +3.3% | +4.0% | +5.0% | +2.9% |
| 2021-03 | +4.4% | +2.5% | +4.3% | +5.6% | +4.5% |
| 2021-04 | +4.2% | +1.7% | +3.9% | +5.5% | +5.0% |
| 2021-05 | +4.4% | +2.0% | +4.0% | +6.1% | +4.8% |
| 2021-06 | +5.1% | +2.9% | +4.3% | +6.8% | +5.7% |
| 2021-07 | +5.3% | +4.0% | +4.5% | +6.7% | +5.2% |
| 2021-08 | +5.0% | +4.3% | +4.4% | +5.9% | +5.1% |
| 2021-09 | +4.8% | +3.9% | +4.4% | +5.4% | +4.7% |
| 2021-10 | +4.7% | +4.3% | +4.4% | +5.1% | +4.6% |
| 2021-11 | +4.9% | +4.7% | +4.7% | +5.0% | +4.6% |
| 2021-12 | +4.5% | +4.8% | +4.6% | +4.4% | +3.8% |
| 2022-01 | +5.2% | +6.1% | +5.6% | +5.2% | +3.5% |
| 2022-02 | +5.8% | +7.3% | +6.4% | +5.8% | +3.5% |
| 2022-03 | +6.2% | +9.2% | +7.2% | +5.9% | +2.9% |
| 2022-04 | +6.3% | +9.0% | +7.3% | +6.4% | +3.0% |
| 2022-05 | +6.9% | +9.4% | +8.1% | +7.2% | +3.2% |
| 2022-06 | +6.7% | +8.9% | +7.8% | +6.8% | +3.2% |
| 2022-07 | +7.6% | +9.2% | +9.0% | +8.0% | +3.9% |
| 2022-08 | +7.6% | +8.4% | +8.8% | +8.5% | +4.3% |
| 2022-09 | +7.9% | +8.3% | +9.0% | +9.1% | +4.4% |
| 2022-10 | +7.7% | +7.5% | +8.4% | +9.0% | +4.9% |
| 2022-11 | +6.5% | +6.1% | +7.1% | +7.9% | +3.9% |
| 2022-12 | +5.9% | +4.8% | +6.3% | +7.4% | +4.3% |
| 2023-01 | +4.4% | +3.8% | +4.9% | +5.5% | +3.0% |
| 2023-02 | +4.2% | +4.1% | +4.7% | +4.9% | +2.6% |
| 2023-03 | +3.8% | +4.1% | +4.4% | +4.1% | +2.0% |
| 2023-04 | +2.8% | +3.5% | +3.7% | +2.8% | +1.0% |
| 2023-05 | +0.8% | +1.5% | +1.4% | +0.5% | -0.3% |
| 2023-06 | -0.6% | +0.3% | -0.1% | -0.6% | -2.0% |
| 2023-07 | -1.6% | -0.9% | -1.4% | -1.5% | -2.8% |
| 2023-08 | -2.2% | -1.2% | -2.0% | -2.0% | -3.6% |
| 2023-09 | -2.7% | -1.9% | -2.5% | -2.6% | -3.7% |
| 2023-10 | -3.2% | -2.6% | -2.9% | -3.2% | -3.8% |
| 2023-11 | -3.4% | -2.9% | -2.9% | -3.9% | -3.7% |
| 2023-12 | -3.8% | -3.4% | -3.2% | -4.5% | -4.1% |
| 2024-01 | -3.2% | -2.7% | -2.6% | -3.6% | -3.5% |
| 2024-02 | -3.8% | -4.0% | -3.5% | -3.8% | -4.2% |
| 2024-03 | -4.1% | -4.9% | -4.3% | -3.5% | -4.1% |
| 2024-04 | -4.0% | -5.0% | -4.3% | -3.2% | -3.7% |
| 2024-05 | -1.8% | -3.0% | -2.1% | -0.9% | -1.5% |
| 2024-06 | -0.6% | -2.0% | -0.6% | +0.1% | -0.3% |
| 2024-07 | -0.6% | -2.0% | -0.5% | +0.2% | -0.5% |
| 2024-08 | -0.1% | -1.5% | -0.1% | +0.6% | 0.0% |
| 2024-09 | +0.9% | +0.3% | +1.1% | +1.3% | +0.6% |
| 2024-10 | +1.6% | +1.5% | +1.8% | +1.9% | +1.2% |
| 2024-11 | +2.1% | +2.0% | +2.2% | +2.6% | +1.3% |
| 2024-12 | +2.6% | +2.7% | +2.7% | +3.3% | +1.5% |
| 2025-01 | +2.4% | +2.4% | +2.6% | +3.3% | +0.9% |
| 2025-02 | +2.7% | +3.0% | +3.0% | +3.7% | +1.2% |
| 2025-03 | +3.6% | +2.8% | +3.7% | +4.7% | +2.8% |
| 2025-04 | +3.5% | +3.9% | +4.2% | +4.1% | +1.6% |
| 2025-05 | +2.1% | +3.1% | +3.1% | +2.7% | -0.3% |
| 2025-06 | +1.3% | +3.4% | +2.7% | +1.5% | -2.2% |
| 2025-07 | +1.8% | +3.1% | +3.0% | +2.2% | -0.8% |
| 2025-08 | +2.5% | +3.4% | +3.8% | +2.9% | +0.1% |
| 2025-09 | +1.5% | +1.9% | +2.8% | +2.2% | -0.8% |
| 2025-10 | +1.5% | +1.8% | +3.0% | +2.5% | -1.3% |
| 2025-11 | +1.1% | +1.4% | +2.3% | +2.4% | -1.6% |
| 2025-12 | +1.6% | +1.5% | +2.6% | +3.0% | -0.9% |
| 2026-01 | +1.3% | +0.9% | +2.2% | +2.6% | -0.9% |
| 2026-02 | +1.9% | +1.7% | +3.2% | +2.9% | -0.5% |
| 2026-03 | +1.7% | +2.9% | +3.6% | +2.5% | -2.2% |
The type spread in Hertfordshire is unusually wide. A detached home averaged £978,102 in March 2026, roughly 108% above the England detached figure of £470,492 and almost four times the price of the average Hertfordshire flat. Semi-detached houses averaged £560,373 (94% above England), terraced £420,345 (72% above), and flats and maisonettes £256,146 (19% above). The practical split: detached homes trade in an owner-occupier market, while the flats and terraces near the stations are where the rent-to-price maths actually works.

Best areas to invest in Hertfordshire
The five Hertfordshire towns with their own guides span the county's range, from Watford on the London fringe to Stevenage and Hemel Hempstead in the new-town belt. The table ranks them by the top gross yield each town reaches, alongside its average asking price and the 30% deposit that price implies.
| Area | Mean Asking Price | 30% Deposit | Top Gross Yield |
|---|---|---|---|
| Watford | £450,831 | £135,249 | 5.5% |
| Stevenage | £459,009 | £137,703 | 4.8% |
| St Albans | £719,692 | £215,908 | 4.7% |
| Welwyn Garden City | £599,684 | £179,905 | 4.5% |
| Hemel Hempstead | £538,635 | £161,590 | 4.4% |
The single highest yield anywhere in the county sits in AL10, Hatfield, at 6.1% on an average asking price of £357,326. That is the University of Hertfordshire's home postcode, and the student and young-professional demand it carries is what lifts the rent relative to the price. Watford leads the guide towns at 5.5%, with an average asking price of £450,831 keeping the deposit near £135,000. The premium towns rank lower on yield precisely because their prices are higher: St Albans reaches only 4.7% despite rents above £2,200 a month, because the asking price sits near £720,000.
Beyond the guide towns, the county page also ranks for areas worth keeping on a list. Bishop's Stortford in the east runs on Stansted Airport employment and the Liverpool Street line, Hertford as the county town carries strong rents, and the Lea Valley towns of Hoddesdon, Cheshunt and Broxbourne are the most London-accessible value markets in Hertfordshire. Each has its own market character, so treat those as areas to research rather than figures to bank here.
Hertfordshire's London commuter markets
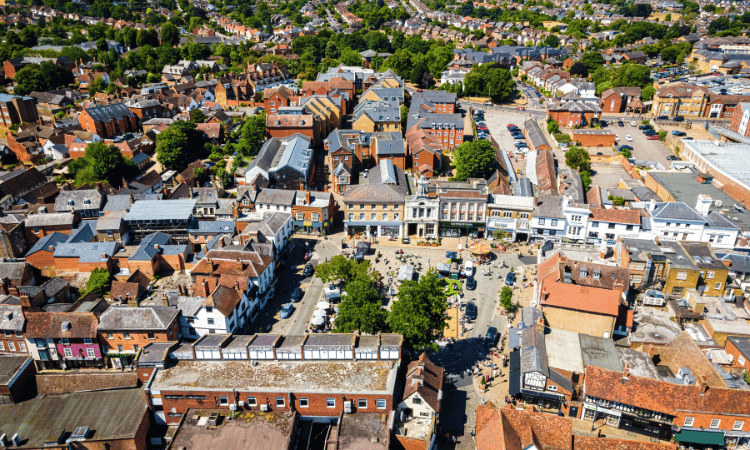
Almost every investment case in Hertfordshire runs back to one thing: the trains. The county has fast lines into all the major London terminals, and where a town sits on that map shapes both its rents and its tenant pool.
Watford and the western towns feed Euston and the London Overground, putting commuters into central London in around 20 minutes from Watford Junction. That access is a large part of why Watford reaches the highest yield of the guide towns at 5.5%: the rent it commands is anchored to central-London wages, while the average asking price of £450,831 stays well under a comparable London figure. Rickmansworth, Kings Langley and the wider WD district trade on the same Metropolitan and Overground links.
The eastern side of the county runs on the Lea Valley and the Liverpool Street services. Bishop's Stortford, out towards the Essex border, benefits from both the fast train and Stansted Airport as a local employer. The Lea Valley towns lower down, Hoddesdon, Cheshunt and Broxbourne, are the most affordable London-accessible postcodes Hertfordshire has, which is why they consistently draw buyers priced out of the capital's northern edges.
Down the middle, the Thameslink and Great Northern routes carry St Albans, Hatfield, Welwyn Garden City and Stevenage into King's Cross, St Pancras and Moorgate. St Albans is the county's blue-chip commuter town, with asking prices near £720,000 and rents to match, which is what pins its yield at 4.7%. The point of the commuter geography for an investor is that it splits the county cleanly: the towns closest to the fastest trains carry the strongest tenant demand, but the towns a notch further out are where the price leaves more room for the rent to work.
Hertfordshire's new towns and garden cities
Hertfordshire is where the planned-town movement began, and that history still shapes its rental stock. Letchworth became the world's first garden city in 1903 and Welwyn Garden City the second in 1920, both laid out to Ebenezer Howard's model of housing set among green space and its own employment. After the war the county gained several of the first New Towns, with Stevenage designated Britain's very first under the 1946 Act and Hemel Hempstead following soon after. Three of the five town guides on this page sit in that lineage, which matters to an investor because it means large tracts of purpose-built, uniformly planned housing rather than the piecemeal Victorian and interwar stock found across much of the commuter belt.
The read here is about stock and regeneration rather than a yield premium. Welwyn Garden City, on a £599,684 mean asking price and a 4.5% top gross yield, sits at the pricier, lower-yielding end, its tree-lined layout and fast trains into King's Cross holding owner-occupier demand high. Stevenage, at £459,009 and 4.8%, and Hemel Hempstead, at £538,635 and 4.4%, carry more of the county's affordable planned housing, and both run active town-centre regeneration, Stevenage around its station quarter and Hemel around the Maylands employment area. For a landlord the pull is steady demand from the employment and transport these towns were designed around, on stock that is simpler to manage at scale than older housing.
Hertfordshire's student and HMO market
Hertfordshire has one substantial university, and it explains the county's single highest yield. The University of Hertfordshire is based in Hatfield and had around 34,000 students as of 2024, including a large international cohort. That standing demand is the reason AL10 (Hatfield) reaches 6.1%, a full percentage point clear of anything else in the county, on an average asking price of £357,326.
For a landlord, a university town of that size supports both standard lets to postgraduates and staff and, where the licensing allows, shared houses aimed at students. The rest of Hertfordshire is not a student county in the way a Nottingham or a Leeds is, so the HMO opportunity is concentrated: Hatfield is the clear centre of it, with the neighbouring Welwyn Garden City postcodes benefiting from the overspill. Any HMO plan should start with the relevant council's licensing rules, since a shared house of a certain size needs a mandatory licence and some districts run wider additional schemes on top.
What a Hertfordshire buy-to-let deposit costs
At the county average sold price of £467,988, a 30% buy-to-let deposit comes to £140,396. But the average hides a very wide range, because Hertfordshire's property types are spread further apart than most counties. The table below shows the 30% deposit against each property type's average sold price.
| Property type | Average Hertfordshire price | 30% deposit |
|---|---|---|
| Detached | £978,102 | £293,431 |
| Semi-detached | £560,373 | £168,112 |
| Terraced | £420,345 | £126,104 |
| Flats and maisonettes | £256,146 | £76,844 |
| All property types | £467,988 | £140,396 |
The distance between the top and bottom of that table is the practical story of investing here. A deposit on the average Hertfordshire flat is £76,844; the same 30% on a detached house is £293,431, nearly four times as much. Most buy-to-let capital in the county goes into the terraces and flats, where the deposit stays within reach and the rent-to-price ratio is far healthier than the detached market can offer.
How to invest in Hertfordshire
Before you run any Hertfordshire deal, factor in the stamp duty. Buy-to-let and second-home purchases carry the higher rate, and on Hertfordshire's prices that is a meaningful sum. Our stamp duty calculator will give you the figure for a specific purchase price so you can build it into the numbers from the start.
When you are ready to look at stock, we work with a single vetted buy-to-let partner rather than a scattergun of agents. You can see the current investment properties available across Hertfordshire and the rest of the country, browse the wider buy-to-let investments for sale, or focus on discounted below-market-value stock if you are buying for equity as well as yield. If you want to sit above the individual towns, our guide to the best buy-to-let locations across the UK puts Hertfordshire's yields in national context.
Hertfordshire also sits alongside several counties with a similar commuter-belt shape. It is worth comparing the numbers against Essex on the eastern side of London, Surrey to the south, and Kent in the south-east, each of which trades the same London-access-versus-price question on slightly different terms.
Frequently Asked Questions
What are buy-to-let prices and yields in Hertfordshire?
The Hertfordshire figures show a county priced 61% above the England average at £467,988, with gross yields reaching 6.1% in Hatfield and 5.5% in Watford. These price and gross-yield figures describe the recorded comparison; they do not establish future price stability or which trade-off suits an individual buyer.
Where are the best buy-to-let yields in Hertfordshire?
The single highest gross yield in the county is 6.1% in AL10 (Hatfield), supported by University of Hertfordshire demand. Among the towns with their own guides, Watford leads at 5.5%, followed by Stevenage at 4.8%. The new-town belt and the towns nearer the stations tend to carry the county's stronger yields, because their prices leave more room for the rent.
How much does a buy-to-let deposit cost in Hertfordshire?
A 30% deposit on the average Hertfordshire home of £467,988 is £140,396. It varies sharply by property type: £76,844 on the average flat, £126,104 on a terraced house, and £293,431 on a detached home. Most buy-to-let purchases in the county sit in the flat and terrace tiers where the deposit stays manageable.
Why is buy-to-let in Hertfordshire more expensive than other counties?
Hertfordshire's average sold price of £467,988 reflects its position as one of the closest counties to London, with fast trains into Euston, King's Cross and Liverpool Street. High local earnings and constrained Green Belt supply hold prices up. The detached market in particular runs at £978,102, more than double the England detached average, though flats near the stations remain far more accessible.
Is St Albans or Watford better for property investment?
On the numbers they serve different aims. Watford reaches a 5.5% gross yield on an average asking price of £450,831, while St Albans reaches 4.7% on an average asking price of £719,692 with rents above £2,200 a month. Watford's lower price and higher yield lean toward income; St Albans leans toward a premium, capital-stable market. The Watford guide and St Albans guide break each town down in detail.
When did house prices last fall in Hertfordshire?
Hertfordshire's most recent major correction ran from a January 2008 peak of £271,906 to an April 2009 trough of £228,567, a fall of 15.9%. Prices did not sustainably pass the old peak again until June 2013. More recently, higher mortgage rates trimmed the market back from its October 2022 high of £469,572, though the March 2026 average of £467,988 has recovered almost all of that ground.
Ready to buy property?
Browse investment properties with prices and gross yields shown for each opportunity.
Get property alerts