

The Lake District sits in the north west of England, and since April 2023 it has been split between two councils: Cumberland in the north and west, and Westmorland and Furness in the south and east. That matters more than it sounds, because every area-level figure on this page comes from one of those two authorities, not from the national park boundary.
Across the 14 postcodes with an asking price on record, the average is £359,182, running from £254,891 in Cockermouth to £489,899 in Ambleside. Sold prices tell the same story from the other end. In May 2026 the average sold price was £227,987 across Westmorland and Furness and £173,130 across Cumberland, against £292,095 for England.
A note on what this page covers, because the Lake District has no tidy boundary. It is a national park, not a postcode area and not a council. Its edges cut straight through postcode districts, and four of the ones here sit in two councils at once. So this guide takes the wider view: the central fells and lakes, plus the gateway towns of Kendal, Penrith, Ulverston and Cockermouth where most of the buying and selling actually happens. Barrow, Carlisle and the west coast towns are outside this guide. Carlisle has its own guide; for a nearby market south of the national park, see Lancaster.
Article updated: July 2026
- Cumberland
- Westmorland and Furness
- Lake District National Park
Why the Lake District is unlike anywhere else in the data
Almost every postcode here has too few homes advertised to let long term for anyone to calculate a rental yield. Of the 15 postcodes in this guide, three have enough listings to produce one. Twelve do not.
That is worth being precise about, because it is easy to read the wrong thing into it. A missing yield is not a low yield. It is a missing measurement. Across the Lake District there are usually too few homes advertised to let long term for a reliable figure to exist at all. This data cannot tell you whether the yield on any given house in Grasmere would be good or bad, because the advertised market that would tell us is barely visible. A local agent or valuer working from actual comparable lettings may well be able to.
Achieved rents are measured separately. The Office for National Statistics measures rents on actual tenancies rather than advertised asking rents, and in June 2026 the authority averages were £808 a month across Westmorland and Furness and £670 across Cumberland. Those are modelled averages across each whole authority, drawn from tenancies rather than listings, so they describe the authority rather than any individual Lake District postcode.

Jobs, wages and people
The two councils are close on pay and further apart on employment. Median annual pay is £42,461 in Cumberland and £41,859 in Westmorland and Furness. The employment rate is 75.3% in Cumberland and 80.4% in Westmorland and Furness. Cumberland's unemployment rate is 4.5%; the sample in Westmorland and Furness is too small for the survey to publish one.
The 2021 census counted 273,257 people in Cumberland and 226,592 in Westmorland and Furness, and there is no honest ten-year comparison to set against either, because neither council existed in 2011. If you see a population change quoted for these two areas, it has been built from the old district boundaries and it is measuring something else.
The Lake District property market
The two halves of the area are at different points in the cycle. Cumberland reached its highest average sold price on record in May 2026. Westmorland and Furness peaked eighteen months earlier and has come off that high since.
Westmorland and Furness
The average sold price across Westmorland and Furness was £227,987 in May 2026, around 22% below the England average of £292,095. That covers Kendal, Windermere, Ambleside, Coniston, Grange-over-Sands, Ulverston, Penrith and the southern and eastern fells.
Its record high was £230,314 in November 2024. The May 2026 figure sits £2,327 below that, so the southern half of the area has spent about eighteen months slightly below its peak. Over five years it is up 15.2%, from £197,922 in May 2021.
Going further back, prices topped out at £173,700 in October 2007 before the financial crisis, bottomed at £145,120 in February 2009, and took until the middle of the following decade to recover. That was a fall of 16.5% from peak to trough.
- All property types
- Detached
- Semi-detached
- Terraced
- Flats
Source: HM Land Registry House Price Index
| Year | All property types | Detached | Semi-detached | Terraced | Flats |
|---|---|---|---|---|---|
| 1995-01 | £44,689 | £79,065 | £46,763 | £34,550 | £33,181 |
| 1995-02 | £46,412 | £80,311 | £48,631 | £36,492 | £33,678 |
| 1995-03 | £46,224 | £79,427 | £48,344 | £36,547 | £33,528 |
| 1995-04 | £47,191 | £80,002 | £49,231 | £37,756 | £33,851 |
| 1995-05 | £47,382 | £81,384 | £49,457 | £37,441 | £34,758 |
| 1995-06 | £47,286 | £82,093 | £49,594 | £36,906 | £35,064 |
| 1995-07 | £48,197 | £85,505 | £50,882 | £36,827 | £36,296 |
| 1995-08 | £47,625 | £84,581 | £50,229 | £36,495 | £35,436 |
| 1995-09 | £48,012 | £85,296 | £50,479 | £36,950 | £35,420 |
| 1995-10 | £46,588 | £82,279 | £48,926 | £36,052 | £34,160 |
| 1995-11 | £46,105 | £81,720 | £48,574 | £35,436 | £34,149 |
| 1995-12 | £45,599 | £80,670 | £48,147 | £34,999 | £33,862 |
| 1996-01 | £44,950 | £79,458 | £47,449 | £34,490 | £33,533 |
| 1996-02 | £45,584 | £80,375 | £48,279 | £34,946 | £33,976 |
| 1996-03 | £45,801 | £81,764 | £48,819 | £34,625 | £34,444 |
| 1996-04 | £45,980 | £82,119 | £49,106 | £34,706 | £34,551 |
| 1996-05 | £45,263 | £80,881 | £48,281 | £34,251 | £33,723 |
| 1996-06 | £45,964 | £80,973 | £48,502 | £35,415 | £34,063 |
| 1996-07 | £46,086 | £80,829 | £48,617 | £35,752 | £33,543 |
| 1996-08 | £46,692 | £82,829 | £49,207 | £35,953 | £34,241 |
| 1996-09 | £46,800 | £83,702 | £49,668 | £35,761 | £33,902 |
| 1996-10 | £48,153 | £86,727 | £51,160 | £36,567 | £35,037 |
| 1996-11 | £48,494 | £86,144 | £51,572 | £37,269 | £34,581 |
| 1996-12 | £48,354 | £86,133 | £51,571 | £36,982 | £34,645 |
| 1997-01 | £47,984 | £85,526 | £51,068 | £36,698 | £34,577 |
| 1997-02 | £47,639 | £85,403 | £50,645 | £36,269 | £34,632 |
| 1997-03 | £47,910 | £85,804 | £50,709 | £36,613 | £34,870 |
| 1997-04 | £48,668 | £87,066 | £51,635 | £37,198 | £35,214 |
| 1997-05 | £48,868 | £87,765 | £51,968 | £37,170 | £35,439 |
| 1997-06 | £48,708 | £88,149 | £51,897 | £36,844 | £35,133 |
| 1997-07 | £48,673 | £88,540 | £51,763 | £36,748 | £35,065 |
| 1997-08 | £50,019 | £91,214 | £53,140 | £37,800 | £35,704 |
| 1997-09 | £51,109 | £92,464 | £54,222 | £38,960 | £36,100 |
| 1997-10 | £50,846 | £92,093 | £54,029 | £38,677 | £35,944 |
| 1997-11 | £50,417 | £90,704 | £53,636 | £38,587 | £35,216 |
| 1997-12 | £49,865 | £90,245 | £53,216 | £37,863 | £35,092 |
| 1998-01 | £50,630 | £91,714 | £53,973 | £38,478 | £35,515 |
| 1998-02 | £50,605 | £91,194 | £54,058 | £38,509 | £35,704 |
| 1998-03 | £50,649 | £90,501 | £54,149 | £38,834 | £35,393 |
| 1998-04 | £51,050 | £90,665 | £54,690 | £39,315 | £35,384 |
| 1998-05 | £51,995 | £92,741 | £55,535 | £39,998 | £36,106 |
| 1998-06 | £52,180 | £93,573 | £55,573 | £39,979 | £36,631 |
| 1998-07 | £52,627 | £94,663 | £56,033 | £40,266 | £36,855 |
| 1998-08 | £52,179 | £94,520 | £55,476 | £39,739 | £36,655 |
| 1998-09 | £52,609 | £95,386 | £55,906 | £40,141 | £36,621 |
| 1998-10 | £52,335 | £94,813 | £55,609 | £39,856 | £36,841 |
| 1998-11 | £53,180 | £96,394 | £56,609 | £40,415 | £37,478 |
| 1998-12 | £53,377 | £96,446 | £56,928 | £40,538 | £37,844 |
| 1999-01 | £52,674 | £95,473 | £56,122 | £39,824 | £37,877 |
| 1999-02 | £51,227 | £94,314 | £54,566 | £38,158 | £37,575 |
| 1999-03 | £51,221 | £95,724 | £54,457 | £37,699 | £38,014 |
| 1999-04 | £51,301 | £95,533 | £54,459 | £37,992 | £37,734 |
| 1999-05 | £53,257 | £96,680 | £56,383 | £40,448 | £38,366 |
| 1999-06 | £53,841 | £97,083 | £56,925 | £41,140 | £38,722 |
| 1999-07 | £54,890 | £99,822 | £57,948 | £41,778 | £39,362 |
| 1999-08 | £54,632 | £100,045 | £57,579 | £41,444 | £39,126 |
| 1999-09 | £56,039 | £102,495 | £58,950 | £42,666 | £39,948 |
| 1999-10 | £56,581 | £103,354 | £59,598 | £43,036 | £40,465 |
| 1999-11 | £57,360 | £104,898 | £60,474 | £43,522 | £41,157 |
| 1999-12 | £57,154 | £103,879 | £60,284 | £43,497 | £41,165 |
| 2000-01 | £56,483 | £102,524 | £59,581 | £42,984 | £40,837 |
| 2000-02 | £55,417 | £101,130 | £58,535 | £41,819 | £40,673 |
| 2000-03 | £55,777 | £102,668 | £59,119 | £41,697 | £40,994 |
| 2000-04 | £58,017 | £106,513 | £61,526 | £43,473 | £42,461 |
| 2000-05 | £59,724 | £110,209 | £63,503 | £44,465 | £43,940 |
| 2000-06 | £59,720 | £110,232 | £63,539 | £44,383 | £44,142 |
| 2000-07 | £60,192 | £111,633 | £64,132 | £44,639 | £44,090 |
| 2000-08 | £60,921 | £112,594 | £64,910 | £45,383 | £44,176 |
| 2000-09 | £63,797 | £118,336 | £67,808 | £47,520 | £46,194 |
| 2000-10 | £63,120 | £117,620 | £67,223 | £46,623 | £46,448 |
| 2000-11 | £63,376 | £119,177 | £67,497 | £46,440 | £47,063 |
| 2000-12 | £62,203 | £116,726 | £66,420 | £45,516 | £46,336 |
| 2001-01 | £62,622 | £117,368 | £66,771 | £45,896 | £46,711 |
| 2001-02 | £63,234 | £117,592 | £67,444 | £46,628 | £46,901 |
| 2001-03 | £62,453 | £117,593 | £66,642 | £45,524 | £47,015 |
| 2001-04 | £63,248 | £118,588 | £67,377 | £46,363 | £47,291 |
| 2001-05 | £64,559 | £120,722 | £68,714 | £47,401 | £48,444 |
| 2001-06 | £66,074 | £120,958 | £70,294 | £49,375 | £48,789 |
| 2001-07 | £67,889 | £124,620 | £72,315 | £50,553 | £50,316 |
| 2001-08 | £68,170 | £125,575 | £72,534 | £50,656 | £50,691 |
| 2001-09 | £69,505 | £130,360 | £73,755 | £50,956 | £52,548 |
| 2001-10 | £69,550 | £130,790 | £73,828 | £50,832 | £52,829 |
| 2001-11 | £69,582 | £131,367 | £73,978 | £50,552 | £53,414 |
| 2001-12 | £68,893 | £129,555 | £73,465 | £49,982 | £53,325 |
| 2002-01 | £68,825 | £129,766 | £73,422 | £49,765 | £53,599 |
| 2002-02 | £68,580 | £130,122 | £73,036 | £49,337 | £53,982 |
| 2002-03 | £71,465 | £135,523 | £76,164 | £51,453 | £56,001 |
| 2002-04 | £74,693 | £141,406 | £79,534 | £53,735 | £59,217 |
| 2002-05 | £77,901 | £144,877 | £83,087 | £56,820 | £60,851 |
| 2002-06 | £78,259 | £143,852 | £83,336 | £57,686 | £60,674 |
| 2002-07 | £79,402 | £146,827 | £84,540 | £58,302 | £61,640 |
| 2002-08 | £80,455 | £149,246 | £85,599 | £58,953 | £62,601 |
| 2002-09 | £83,249 | £155,889 | £88,719 | £60,488 | £65,006 |
| 2002-10 | £83,001 | £154,848 | £88,585 | £60,301 | £65,263 |
| 2002-11 | £84,822 | £159,469 | £90,540 | £61,248 | £66,962 |
| 2002-12 | £84,408 | £157,380 | £90,146 | £61,150 | £67,224 |
| 2003-01 | £87,082 | £161,634 | £92,798 | £63,466 | £68,886 |
| 2003-02 | £87,004 | £161,024 | £92,912 | £63,313 | £69,414 |
| 2003-03 | £87,414 | £161,526 | £93,282 | £63,720 | £69,719 |
| 2003-04 | £87,915 | £162,520 | £94,157 | £63,746 | £70,905 |
| 2003-05 | £91,725 | £169,266 | £98,255 | £66,585 | £73,937 |
| 2003-06 | £93,121 | £173,901 | £99,780 | £66,964 | £75,493 |
| 2003-07 | £95,495 | £177,420 | £102,385 | £69,076 | £76,373 |
| 2003-08 | £95,957 | £178,083 | £102,825 | £69,504 | £76,658 |
| 2003-09 | £99,441 | £183,109 | £106,587 | £72,535 | £78,662 |
| 2003-10 | £101,283 | £187,249 | £108,377 | £73,597 | £81,055 |
| 2003-11 | £103,704 | £190,996 | £110,951 | £75,518 | £83,178 |
| 2003-12 | £107,851 | £197,007 | £115,303 | £78,915 | £87,021 |
| 2004-01 | £108,638 | £197,173 | £116,069 | £79,981 | £87,041 |
| 2004-02 | £108,374 | £199,140 | £116,045 | £79,056 | £87,659 |
| 2004-03 | £106,937 | £197,769 | £114,481 | £77,558 | £87,275 |
| 2004-04 | £110,987 | £202,346 | £118,682 | £81,279 | £90,104 |
| 2004-05 | £115,597 | £205,341 | £122,942 | £86,292 | £92,734 |
| 2004-06 | £121,319 | £214,723 | £128,993 | £90,829 | £96,834 |
| 2004-07 | £123,844 | £218,836 | £131,676 | £92,849 | £98,586 |
| 2004-08 | £128,505 | £225,327 | £136,191 | £97,365 | £100,109 |
| 2004-09 | £129,678 | £222,122 | £136,616 | £100,277 | £98,782 |
| 2004-10 | £133,321 | £227,671 | £140,220 | £103,206 | £102,428 |
| 2004-11 | £134,745 | £231,462 | £141,825 | £103,663 | £104,968 |
| 2004-12 | £136,312 | £235,451 | £143,775 | £103,975 | £108,500 |
| 2005-01 | £132,894 | £231,633 | £140,263 | £100,713 | £106,559 |
| 2005-02 | £130,903 | £228,043 | £138,738 | £98,905 | £105,298 |
| 2005-03 | £133,452 | £231,539 | £141,675 | £101,208 | £105,662 |
| 2005-04 | £136,480 | £232,466 | £144,989 | £104,969 | £105,185 |
| 2005-05 | £140,187 | £238,186 | £148,536 | £108,051 | £108,338 |
| 2005-06 | £143,050 | £243,303 | £151,387 | £110,444 | £109,773 |
| 2005-07 | £145,948 | £248,209 | £154,314 | £112,800 | £111,744 |
| 2005-08 | £146,217 | £248,377 | £154,330 | £113,368 | £111,048 |
| 2005-09 | £145,193 | £247,969 | £153,084 | £112,175 | £111,121 |
| 2005-10 | £145,769 | £250,742 | £153,430 | £112,087 | £112,745 |
| 2005-11 | £147,717 | £253,902 | £155,626 | £113,560 | £114,270 |
| 2005-12 | £147,324 | £250,364 | £154,874 | £114,138 | £113,539 |
| 2006-01 | £148,192 | £251,293 | £155,682 | £114,915 | £114,506 |
| 2006-02 | £149,147 | £250,363 | £156,303 | £116,531 | £114,601 |
| 2006-03 | £148,640 | £251,109 | £156,099 | £115,573 | £114,490 |
| 2006-04 | £149,287 | £251,494 | £156,799 | £116,532 | £113,571 |
| 2006-05 | £150,106 | £253,170 | £157,739 | £117,119 | £113,967 |
| 2006-06 | £154,353 | £256,896 | £161,730 | £121,808 | £115,531 |
| 2006-07 | £157,826 | £259,804 | £164,762 | £125,672 | £117,334 |
| 2006-08 | £159,582 | £263,533 | £166,581 | £126,970 | £118,288 |
| 2006-09 | £161,435 | £269,197 | £168,757 | £127,704 | £119,810 |
| 2006-10 | £159,781 | £266,519 | £167,005 | £126,343 | £118,770 |
| 2006-11 | £160,248 | £264,534 | £167,140 | £127,844 | £117,677 |
| 2006-12 | £157,854 | £258,017 | £164,253 | £126,583 | £116,449 |
| 2007-01 | £160,961 | £263,821 | £167,581 | £128,850 | £118,784 |
| 2007-02 | £160,978 | £265,260 | £167,709 | £128,008 | £120,953 |
| 2007-03 | £162,985 | £268,735 | £169,864 | £129,675 | £121,785 |
| 2007-04 | £163,363 | £266,939 | £170,033 | £130,757 | £121,393 |
| 2007-05 | £164,332 | £268,422 | £170,917 | £131,730 | £121,571 |
| 2007-06 | £167,781 | £270,999 | £174,091 | £135,670 | £122,820 |
| 2007-07 | £169,392 | £275,306 | £175,767 | £136,640 | £123,843 |
| 2007-08 | £172,382 | £279,498 | £178,693 | £139,582 | £124,678 |
| 2007-09 | £173,269 | £286,214 | £179,844 | £138,768 | £126,533 |
| 2007-10 | £173,700 | £284,526 | £180,023 | £139,981 | £125,950 |
| 2007-11 | £171,913 | £281,521 | £178,144 | £138,599 | £124,534 |
| 2007-12 | £170,905 | £275,533 | £176,769 | £139,133 | £122,691 |
| 2008-01 | £170,671 | £278,833 | £176,562 | £137,646 | £124,583 |
| 2008-02 | £170,089 | £277,723 | £175,949 | £137,356 | £124,148 |
| 2008-03 | £168,235 | £278,075 | £174,788 | £134,767 | £123,207 |
| 2008-04 | £166,304 | £273,859 | £172,893 | £133,874 | £120,454 |
| 2008-05 | £170,399 | £280,582 | £177,291 | £136,894 | £124,077 |
| 2008-06 | £171,810 | £280,053 | £178,029 | £139,270 | £124,785 |
| 2008-07 | £173,430 | £283,150 | £180,293 | £140,315 | £125,542 |
| 2008-08 | £167,923 | £275,621 | £174,702 | £135,502 | £121,260 |
| 2008-09 | £164,795 | £273,144 | £171,287 | £132,012 | £119,964 |
| 2008-10 | £163,630 | £273,545 | £170,028 | £129,840 | £121,164 |
| 2008-11 | £162,943 | £273,590 | £169,765 | £128,539 | £121,407 |
| 2008-12 | £156,439 | £262,260 | £163,356 | £123,455 | £116,204 |
| 2009-01 | £150,663 | £250,200 | £156,528 | £120,250 | £110,826 |
| 2009-02 | £145,120 | £238,151 | £149,925 | £117,243 | £105,862 |
| 2009-03 | £148,411 | £244,684 | £153,132 | £119,412 | £108,870 |
| 2009-04 | £150,994 | £248,791 | £156,240 | £121,324 | £110,608 |
| 2009-05 | £157,341 | £260,032 | £162,878 | £126,181 | £115,079 |
| 2009-06 | £156,419 | £258,597 | £162,025 | £125,431 | £114,169 |
| 2009-07 | £154,021 | £255,003 | £159,421 | £123,675 | £111,803 |
| 2009-08 | £153,423 | £253,168 | £158,942 | £123,943 | £109,818 |
| 2009-09 | £156,764 | £258,503 | £162,594 | £127,172 | £110,528 |
| 2009-10 | £160,160 | £264,525 | £166,207 | £129,790 | £112,761 |
| 2009-11 | £160,621 | £266,481 | £166,300 | £129,798 | £113,634 |
| 2009-12 | £162,193 | £267,326 | £168,044 | £131,690 | £114,478 |
| 2010-01 | £160,951 | £266,579 | £166,937 | £130,662 | £112,169 |
| 2010-02 | £162,294 | £270,688 | £168,930 | £131,296 | £111,636 |
| 2010-03 | £159,138 | £267,970 | £165,620 | £127,961 | £109,348 |
| 2010-04 | £159,915 | £268,855 | £166,526 | £128,409 | £110,613 |
| 2010-05 | £160,138 | £271,229 | £166,480 | £127,583 | £112,333 |
| 2010-06 | £161,679 | £274,417 | £168,125 | £128,530 | £113,585 |
| 2010-07 | £160,628 | £273,589 | £166,971 | £127,641 | £112,219 |
| 2010-08 | £159,297 | £268,133 | £166,131 | £127,822 | £109,691 |
| 2010-09 | £158,040 | £265,874 | £164,868 | £126,786 | £108,955 |
| 2010-10 | £158,600 | £266,792 | £165,605 | £127,106 | £109,451 |
| 2010-11 | £158,806 | £268,859 | £165,526 | £126,603 | £110,424 |
| 2010-12 | £158,411 | £268,462 | £165,329 | £126,289 | £109,489 |
| 2011-01 | £159,398 | £272,265 | £166,262 | £126,132 | £111,114 |
| 2011-02 | £160,737 | £274,120 | £167,635 | £127,197 | £112,160 |
| 2011-03 | £162,303 | £277,342 | £169,146 | £128,129 | £113,586 |
| 2011-04 | £158,329 | £269,423 | £164,973 | £125,351 | £110,675 |
| 2011-05 | £156,647 | £266,105 | £163,580 | £124,009 | £109,264 |
| 2011-06 | £152,435 | £258,186 | £159,344 | £120,706 | £106,619 |
| 2011-07 | £155,917 | £263,953 | £163,108 | £123,343 | £109,348 |
| 2011-08 | £154,339 | £260,928 | £161,610 | £122,448 | £107,096 |
| 2011-09 | £159,274 | £269,338 | £166,792 | £126,741 | £109,150 |
| 2011-10 | £161,292 | £271,887 | £169,188 | £128,885 | £108,946 |
| 2011-11 | £160,320 | £272,404 | £168,124 | £127,074 | £109,873 |
| 2011-12 | £154,225 | £261,864 | £161,934 | £122,102 | £105,940 |
| 2012-01 | £148,572 | £253,070 | £156,031 | £117,294 | £102,373 |
| 2012-02 | £146,733 | £248,512 | £153,819 | £116,661 | £100,137 |
| 2012-03 | £150,315 | £254,701 | £157,434 | £119,333 | £103,252 |
| 2012-04 | £155,812 | £264,617 | £163,079 | £123,350 | £107,793 |
| 2012-05 | £157,128 | £266,450 | £164,603 | £124,356 | £108,928 |
| 2012-06 | £155,783 | £262,809 | £162,942 | £124,129 | £107,019 |
| 2012-07 | £153,500 | £258,822 | £160,273 | £122,591 | £105,140 |
| 2012-08 | £153,477 | £259,087 | £160,219 | £122,835 | £104,098 |
| 2012-09 | £156,930 | £267,421 | £163,830 | £124,549 | £107,482 |
| 2012-10 | £155,898 | £265,433 | £163,010 | £123,639 | £106,838 |
| 2012-11 | £155,378 | £264,381 | £162,470 | £123,141 | £106,883 |
| 2012-12 | £155,129 | £263,619 | £162,444 | £123,242 | £105,688 |
| 2013-01 | £153,172 | £260,576 | £160,895 | £121,692 | £103,284 |
| 2013-02 | £152,520 | £258,453 | £160,291 | £121,481 | £102,906 |
| 2013-03 | £150,655 | £254,863 | £158,511 | £120,060 | £101,681 |
| 2013-04 | £152,502 | £257,434 | £160,130 | £121,698 | £103,540 |
| 2013-05 | £152,143 | £257,687 | £159,882 | £121,080 | £103,274 |
| 2013-06 | £152,916 | £258,358 | £160,590 | £121,748 | £104,488 |
| 2013-07 | £154,589 | £261,802 | £162,234 | £122,826 | £106,094 |
| 2013-08 | £159,178 | £270,149 | £167,072 | £126,370 | £108,947 |
| 2013-09 | £159,116 | £271,044 | £167,036 | £126,189 | £108,249 |
| 2013-10 | £156,816 | £267,612 | £164,800 | £124,339 | £105,928 |
| 2013-11 | £155,572 | £265,162 | £163,689 | £123,378 | £104,970 |
| 2013-12 | £154,317 | £262,347 | £162,700 | £122,300 | £104,482 |
| 2014-01 | £153,669 | £261,835 | £161,863 | £121,462 | £104,875 |
| 2014-02 | £150,720 | £258,374 | £158,601 | £118,577 | £103,489 |
| 2014-03 | £153,378 | £263,909 | £161,551 | £120,411 | £104,962 |
| 2014-04 | £155,609 | £266,016 | £164,003 | £122,868 | £105,643 |
| 2014-05 | £157,938 | £268,290 | £166,606 | £125,255 | £106,845 |
| 2014-06 | £157,285 | £267,041 | £165,740 | £124,754 | £106,782 |
| 2014-07 | £159,329 | £270,121 | £167,991 | £126,631 | £107,560 |
| 2014-08 | £161,367 | £275,176 | £170,106 | £127,896 | £108,600 |
| 2014-09 | £164,055 | £279,263 | £173,041 | £130,457 | £109,334 |
| 2014-10 | £163,323 | £278,545 | £172,131 | £129,509 | £109,757 |
| 2014-11 | £163,612 | £277,461 | £172,503 | £130,052 | £110,333 |
| 2014-12 | £162,626 | £275,838 | £171,323 | £129,056 | £110,531 |
| 2015-01 | £161,562 | £274,509 | £170,490 | £128,068 | £109,328 |
| 2015-02 | £160,742 | £274,949 | £169,364 | £126,937 | £109,024 |
| 2015-03 | £160,481 | £275,396 | £169,362 | £126,377 | £108,682 |
| 2015-04 | £162,234 | £278,971 | £171,088 | £127,658 | £109,868 |
| 2015-05 | £163,520 | £279,922 | £172,794 | £128,890 | £110,608 |
| 2015-06 | £164,562 | £281,553 | £173,805 | £129,848 | £111,133 |
| 2015-07 | £165,313 | £280,392 | £174,967 | £131,241 | £110,638 |
| 2015-08 | £165,765 | £282,783 | £175,306 | £131,346 | £110,465 |
| 2015-09 | £165,477 | £282,023 | £174,995 | £131,317 | £109,845 |
| 2015-10 | £164,921 | £283,029 | £174,291 | £130,354 | £109,552 |
| 2015-11 | £166,408 | £285,395 | £176,039 | £131,456 | £110,676 |
| 2015-12 | £166,675 | £285,441 | £176,531 | £132,018 | £109,697 |
| 2016-01 | £167,653 | £287,367 | £177,771 | £132,533 | £110,654 |
| 2016-02 | £166,493 | £286,449 | £176,091 | £131,453 | £110,202 |
| 2016-03 | £167,178 | £289,632 | £176,262 | £131,089 | £112,797 |
| 2016-04 | £165,633 | £285,305 | £174,534 | £130,712 | £110,664 |
| 2016-05 | £167,324 | £284,683 | £176,765 | £132,885 | £111,552 |
| 2016-06 | £168,396 | £284,434 | £178,239 | £134,510 | £110,998 |
| 2016-07 | £171,757 | £289,507 | £181,771 | £137,317 | £113,433 |
| 2016-08 | £171,181 | £290,339 | £181,067 | £136,343 | £113,220 |
| 2016-09 | £172,119 | £291,258 | £182,448 | £137,229 | £113,374 |
| 2016-10 | £168,896 | £287,195 | £179,191 | £133,937 | £112,099 |
| 2016-11 | £169,910 | £287,908 | £180,706 | £135,001 | £112,108 |
| 2016-12 | £169,349 | £286,867 | £179,968 | £134,509 | £112,221 |
| 2017-01 | £172,068 | £293,230 | £182,685 | £136,014 | £114,916 |
| 2017-02 | £171,791 | £293,792 | £181,874 | £135,455 | £115,844 |
| 2017-03 | £170,628 | £293,580 | £180,703 | £134,001 | £115,199 |
| 2017-04 | £172,591 | £296,426 | £182,615 | £135,778 | £116,536 |
| 2017-05 | £174,025 | £298,449 | £184,448 | £136,804 | £117,729 |
| 2017-06 | £175,671 | £300,788 | £186,114 | £138,210 | £119,060 |
| 2017-07 | £177,659 | £303,104 | £188,399 | £140,032 | £120,301 |
| 2017-08 | £178,636 | £304,049 | £189,358 | £141,341 | £120,025 |
| 2017-09 | £179,097 | £304,249 | £189,841 | £142,025 | £119,883 |
| 2017-10 | £176,657 | £300,977 | £187,557 | £139,986 | £117,282 |
| 2017-11 | £177,127 | £303,870 | £188,184 | £139,416 | £118,469 |
| 2017-12 | £179,652 | £307,289 | £191,266 | £141,830 | £119,065 |
| 2018-01 | £178,595 | £306,032 | £190,306 | £140,600 | £118,862 |
| 2018-02 | £177,889 | £304,268 | £189,792 | £140,653 | £116,592 |
| 2018-03 | £177,803 | £305,684 | £189,550 | £139,887 | £117,631 |
| 2018-04 | £179,753 | £306,864 | £191,671 | £142,610 | £117,250 |
| 2018-05 | £180,121 | £306,463 | £192,298 | £143,469 | £116,338 |
| 2018-06 | £180,019 | £306,039 | £192,575 | £143,473 | £115,587 |
| 2018-07 | £183,366 | £312,786 | £196,189 | £145,847 | £117,501 |
| 2018-08 | £183,935 | £313,524 | £196,769 | £146,233 | £118,374 |
| 2018-09 | £183,616 | £314,874 | £196,165 | £145,326 | £118,763 |
| 2018-10 | £179,719 | £308,868 | £191,966 | £141,762 | £117,150 |
| 2018-11 | £178,045 | £307,163 | £190,132 | £139,947 | £116,494 |
| 2018-12 | £179,274 | £307,205 | £191,710 | £141,748 | £116,310 |
| 2019-01 | £178,293 | £305,110 | £190,800 | £141,110 | £115,424 |
| 2019-02 | £182,111 | £310,551 | £194,759 | £144,677 | £117,567 |
| 2019-03 | £181,646 | £310,082 | £194,302 | £144,076 | £117,609 |
| 2019-04 | £185,021 | £316,878 | £198,157 | £146,315 | £119,677 |
| 2019-05 | £184,126 | £315,351 | £197,452 | £145,313 | £119,563 |
| 2019-06 | £186,855 | £319,867 | £200,405 | £147,638 | £120,917 |
| 2019-07 | £187,974 | £321,206 | £201,517 | £148,755 | £121,652 |
| 2019-08 | £187,251 | £321,260 | £200,657 | £148,119 | £120,189 |
| 2019-09 | £187,629 | £321,736 | £200,612 | £148,599 | £120,854 |
| 2019-10 | £186,399 | £317,953 | £199,435 | £148,080 | £120,125 |
| 2019-11 | £187,303 | £319,730 | £200,845 | £148,244 | £121,428 |
| 2019-12 | £183,686 | £313,254 | £197,388 | £145,425 | £118,509 |
| 2020-01 | £185,344 | £316,079 | £199,034 | £146,609 | £120,233 |
| 2020-02 | £182,404 | £310,741 | £195,574 | £144,513 | £118,349 |
| 2020-03 | £183,800 | £314,647 | £196,987 | £144,708 | £120,558 |
| 2020-04 | £178,908 | £306,506 | £191,665 | £141,196 | £116,149 |
| 2020-05 | £179,645 | £307,973 | £192,864 | £141,566 | £116,370 |
| 2020-06 | £181,989 | £310,825 | £195,796 | £144,077 | £116,367 |
| 2020-07 | £186,079 | £318,121 | £200,334 | £147,063 | £119,190 |
| 2020-08 | £191,078 | £326,081 | £205,793 | £151,488 | £121,416 |
| 2020-09 | £192,076 | £329,914 | £206,611 | £151,542 | £122,448 |
| 2020-10 | £197,042 | £339,591 | £211,770 | £155,327 | £125,066 |
| 2020-11 | £197,042 | £339,272 | £211,283 | £155,687 | £125,131 |
| 2020-12 | £198,496 | £341,461 | £212,512 | £157,169 | £125,908 |
| 2021-01 | £195,793 | £334,837 | £209,516 | £155,449 | £125,259 |
| 2021-02 | £198,179 | £337,503 | £211,863 | £157,591 | £127,953 |
| 2021-03 | £200,826 | £338,860 | £214,575 | £160,550 | £130,677 |
| 2021-04 | £202,273 | £341,304 | £215,771 | £161,985 | £131,385 |
| 2021-05 | £197,922 | £334,019 | £211,020 | £158,605 | £128,386 |
| 2021-06 | £202,397 | £340,470 | £215,351 | £162,901 | £131,095 |
| 2021-07 | £199,920 | £335,898 | £213,089 | £160,920 | £129,260 |
| 2021-08 | £204,013 | £343,678 | £217,812 | £164,015 | £131,013 |
| 2021-09 | £199,857 | £337,505 | £213,803 | £160,406 | £127,583 |
| 2021-10 | £200,819 | £341,659 | £214,668 | £160,624 | £127,561 |
| 2021-11 | £200,308 | £341,463 | £214,171 | £159,962 | £127,217 |
| 2021-12 | £200,651 | £343,998 | £214,487 | £159,812 | £126,799 |
| 2022-01 | £204,828 | £350,104 | £219,274 | £163,460 | £129,044 |
| 2022-02 | £210,777 | £359,380 | £225,625 | £168,464 | £133,020 |
| 2022-03 | £208,484 | £355,514 | £223,678 | £166,422 | £131,330 |
| 2022-04 | £211,872 | £360,721 | £227,040 | £169,482 | £133,429 |
| 2022-05 | £212,288 | £361,371 | £227,604 | £170,005 | £132,965 |
| 2022-06 | £217,688 | £369,122 | £233,298 | £174,776 | £136,663 |
| 2022-07 | £221,637 | £375,126 | £237,905 | £178,140 | £138,644 |
| 2022-08 | £224,896 | £380,735 | £241,260 | £180,978 | £140,160 |
| 2022-09 | £226,887 | £385,109 | £243,375 | £182,595 | £140,340 |
| 2022-10 | £226,647 | £385,662 | £242,954 | £182,195 | £140,089 |
| 2022-11 | £222,916 | £379,969 | £238,869 | £179,044 | £137,708 |
| 2022-12 | £220,451 | £375,571 | £236,225 | £177,019 | £136,529 |
| 2023-01 | £218,198 | £372,182 | £234,125 | £174,965 | £134,887 |
| 2023-02 | £217,952 | £372,312 | £233,876 | £174,513 | £134,872 |
| 2023-03 | £220,096 | £377,545 | £236,562 | £175,522 | £136,117 |
| 2023-04 | £219,356 | £377,071 | £235,693 | £174,644 | £135,929 |
| 2023-05 | £220,714 | £378,214 | £237,435 | £175,764 | £137,165 |
| 2023-06 | £217,039 | £370,838 | £233,145 | £173,403 | £134,631 |
| 2023-07 | £218,413 | £372,552 | £234,757 | £174,776 | £135,052 |
| 2023-08 | £216,199 | £369,257 | £232,239 | £173,279 | £132,808 |
| 2023-09 | £217,347 | £371,137 | £233,592 | £174,295 | £133,177 |
| 2023-10 | £219,058 | £373,242 | £235,270 | £175,865 | £134,509 |
| 2023-11 | £221,648 | £378,384 | £238,297 | £177,494 | £136,414 |
| 2023-12 | £224,143 | £382,547 | £240,916 | £179,386 | £138,372 |
| 2024-01 | £218,861 | £373,686 | £235,173 | £175,159 | £135,084 |
| 2024-02 | £216,904 | £368,714 | £233,148 | £174,099 | £133,682 |
| 2024-03 | £217,661 | £370,117 | £234,000 | £174,502 | £134,602 |
| 2024-04 | £220,323 | £373,343 | £236,826 | £176,872 | £136,773 |
| 2024-05 | £222,326 | £376,338 | £238,891 | £178,484 | £138,483 |
| 2024-06 | £218,087 | £367,520 | £234,159 | £175,767 | £135,598 |
| 2024-07 | £219,238 | £369,443 | £235,427 | £176,973 | £135,504 |
| 2024-08 | £220,629 | £371,796 | £236,678 | £178,463 | £135,667 |
| 2024-09 | £225,510 | £381,566 | £242,288 | £182,127 | £137,583 |
| 2024-10 | £227,895 | £386,294 | £244,609 | £183,870 | £139,285 |
| 2024-11 | £230,314 | £390,980 | £247,679 | £185,586 | £140,249 |
| 2024-12 | £230,151 | £391,470 | £247,317 | £185,429 | £139,824 |
| 2025-01 | £228,874 | £389,826 | £246,454 | £184,373 | £137,959 |
| 2025-02 | £226,056 | £384,837 | £243,246 | £182,307 | £136,257 |
| 2025-03 | £228,562 | £385,680 | £245,905 | £185,143 | £139,221 |
| 2025-04 | £218,318 | £369,568 | £235,171 | £176,350 | £132,636 |
| 2025-05 | £213,463 | £362,373 | £230,056 | £172,139 | £129,211 |
| 2025-06 | £207,203 | £354,284 | £223,654 | £166,445 | £123,882 |
| 2025-07 | £214,557 | £365,232 | £231,254 | £173,117 | £128,451 |
| 2025-08 | £220,135 | £373,831 | £237,436 | £177,942 | £131,522 |
| 2025-09 | £223,999 | £380,305 | £241,769 | £181,249 | £133,123 |
| 2025-10 | £228,735 | £388,785 | £247,204 | £184,946 | £135,278 |
| 2025-11 | £229,904 | £391,051 | £248,456 | £185,954 | £135,537 |
| 2025-12 | £229,439 | £390,143 | £247,913 | £185,690 | £135,149 |
| 2026-01 | £225,085 | £382,188 | £243,114 | £182,535 | £132,324 |
| 2026-02 | £222,509 | £378,033 | £240,496 | £180,360 | £130,570 |
| 2026-03 | £222,415 | £378,197 | £240,795 | £180,264 | £129,610 |
| 2026-04 | £224,138 | £381,351 | £242,972 | £181,455 | £130,460 |
| 2026-05 | £227,987 | £388,027 | £247,289 | £184,591 | £132,303 |
- All property types
- Detached
- Semi-detached
- Terraced
- Flats
Source: HM Land Registry House Price Index
| Year | All property types | Detached | Semi-detached | Terraced | Flats |
|---|---|---|---|---|---|
| 1996-01 | +0.6% | +0.5% | +1.5% | -0.2% | +1.1% |
| 1996-02 | -1.8% | +0.1% | -0.7% | -4.2% | +0.9% |
| 1996-03 | -0.9% | +2.9% | +1.0% | -5.3% | +2.7% |
| 1996-04 | -2.6% | +2.6% | -0.3% | -8.1% | +2.1% |
| 1996-05 | -4.5% | -0.6% | -2.4% | -8.5% | -3.0% |
| 1996-06 | -2.8% | -1.4% | -2.2% | -4.0% | -2.9% |
| 1996-07 | -4.4% | -5.5% | -4.5% | -2.9% | -7.6% |
| 1996-08 | -2.0% | -2.1% | -2.0% | -1.5% | -3.4% |
| 1996-09 | -2.5% | -1.9% | -1.6% | -3.2% | -4.3% |
| 1996-10 | +3.4% | +5.4% | +4.6% | +1.4% | +2.6% |
| 1996-11 | +5.2% | +5.4% | +6.2% | +5.2% | +1.3% |
| 1996-12 | +6.0% | +6.8% | +7.1% | +5.7% | +2.3% |
| 1997-01 | +6.7% | +7.6% | +7.6% | +6.4% | +3.1% |
| 1997-02 | +4.5% | +6.3% | +4.9% | +3.8% | +1.9% |
| 1997-03 | +4.6% | +4.9% | +3.9% | +5.7% | +1.2% |
| 1997-04 | +5.8% | +6.0% | +5.1% | +7.2% | +1.9% |
| 1997-05 | +8.0% | +8.5% | +7.6% | +8.5% | +5.1% |
| 1997-06 | +6.0% | +8.9% | +7.0% | +4.0% | +3.1% |
| 1997-07 | +5.6% | +9.5% | +6.5% | +2.8% | +4.5% |
| 1997-08 | +7.1% | +10.1% | +8.0% | +5.1% | +4.3% |
| 1997-09 | +9.2% | +10.5% | +9.2% | +8.9% | +6.5% |
| 1997-10 | +5.6% | +6.2% | +5.6% | +5.8% | +2.6% |
| 1997-11 | +4.0% | +5.3% | +4.0% | +3.5% | +1.8% |
| 1997-12 | +3.1% | +4.8% | +3.2% | +2.4% | +1.3% |
| 1998-01 | +5.5% | +7.2% | +5.7% | +4.9% | +2.7% |
| 1998-02 | +6.2% | +6.8% | +6.7% | +6.2% | +3.1% |
| 1998-03 | +5.7% | +5.5% | +6.8% | +6.1% | +1.5% |
| 1998-04 | +4.9% | +4.1% | +5.9% | +5.7% | +0.5% |
| 1998-05 | +6.4% | +5.7% | +6.9% | +7.6% | +1.9% |
| 1998-06 | +7.1% | +6.2% | +7.1% | +8.5% | +4.3% |
| 1998-07 | +8.1% | +6.9% | +8.2% | +9.6% | +5.1% |
| 1998-08 | +4.3% | +3.6% | +4.4% | +5.1% | +2.7% |
| 1998-09 | +2.9% | +3.2% | +3.1% | +3.0% | +1.4% |
| 1998-10 | +2.9% | +3.0% | +2.9% | +3.0% | +2.5% |
| 1998-11 | +5.5% | +6.3% | +5.5% | +4.7% | +6.4% |
| 1998-12 | +7.0% | +6.9% | +7.0% | +7.1% | +7.8% |
| 1999-01 | +4.0% | +4.1% | +4.0% | +3.5% | +6.7% |
| 1999-02 | +1.2% | +3.4% | +0.9% | -0.9% | +5.2% |
| 1999-03 | +1.1% | +5.8% | +0.6% | -2.9% | +7.4% |
| 1999-04 | +0.5% | +5.4% | -0.4% | -3.4% | +6.6% |
| 1999-05 | +2.4% | +4.2% | +1.5% | +1.1% | +6.3% |
| 1999-06 | +3.2% | +3.8% | +2.4% | +2.9% | +5.7% |
| 1999-07 | +4.3% | +5.5% | +3.4% | +3.8% | +6.8% |
| 1999-08 | +4.7% | +5.8% | +3.8% | +4.3% | +6.7% |
| 1999-09 | +6.5% | +7.5% | +5.4% | +6.3% | +9.1% |
| 1999-10 | +8.1% | +9.0% | +7.2% | +8.0% | +9.8% |
| 1999-11 | +7.9% | +8.8% | +6.8% | +7.7% | +9.8% |
| 1999-12 | +7.1% | +7.7% | +5.9% | +7.3% | +8.8% |
| 2000-01 | +7.2% | +7.4% | +6.2% | +7.9% | +7.8% |
| 2000-02 | +8.2% | +7.2% | +7.3% | +9.6% | +8.2% |
| 2000-03 | +8.9% | +7.3% | +8.6% | +10.6% | +7.8% |
| 2000-04 | +13.1% | +11.5% | +13.0% | +14.4% | +12.5% |
| 2000-05 | +12.1% | +14.0% | +12.6% | +9.9% | +14.5% |
| 2000-06 | +10.9% | +13.5% | +11.6% | +7.9% | +14.0% |
| 2000-07 | +9.7% | +11.8% | +10.7% | +6.8% | +12.0% |
| 2000-08 | +11.5% | +12.5% | +12.7% | +9.5% | +12.9% |
| 2000-09 | +13.8% | +15.5% | +15.0% | +11.4% | +15.6% |
| 2000-10 | +11.6% | +13.8% | +12.8% | +8.3% | +14.8% |
| 2000-11 | +10.5% | +13.6% | +11.6% | +6.7% | +14.4% |
| 2000-12 | +8.8% | +12.4% | +10.2% | +4.6% | +12.6% |
| 2001-01 | +10.9% | +14.5% | +12.1% | +6.8% | +14.4% |
| 2001-02 | +14.1% | +16.3% | +15.2% | +11.5% | +15.3% |
| 2001-03 | +12.0% | +14.5% | +12.7% | +9.2% | +14.7% |
| 2001-04 | +9.0% | +11.3% | +9.5% | +6.6% | +11.4% |
| 2001-05 | +8.1% | +9.5% | +8.2% | +6.6% | +10.3% |
| 2001-06 | +10.6% | +9.7% | +10.6% | +11.2% | +10.5% |
| 2001-07 | +12.8% | +11.6% | +12.8% | +13.2% | +14.1% |
| 2001-08 | +11.9% | +11.5% | +11.7% | +11.6% | +14.7% |
| 2001-09 | +8.9% | +10.2% | +8.8% | +7.2% | +13.8% |
| 2001-10 | +10.2% | +11.2% | +9.8% | +9.0% | +13.7% |
| 2001-11 | +9.8% | +10.2% | +9.6% | +8.9% | +13.5% |
| 2001-12 | +10.8% | +11.0% | +10.6% | +9.8% | +15.1% |
| 2002-01 | +9.9% | +10.6% | +10.0% | +8.4% | +14.7% |
| 2002-02 | +8.5% | +10.7% | +8.3% | +5.8% | +15.1% |
| 2002-03 | +14.4% | +15.2% | +14.3% | +13.0% | +19.1% |
| 2002-04 | +18.1% | +19.2% | +18.0% | +15.9% | +25.2% |
| 2002-05 | +20.7% | +20.0% | +20.9% | +19.9% | +25.6% |
| 2002-06 | +18.4% | +18.9% | +18.6% | +16.8% | +24.4% |
| 2002-07 | +17.0% | +17.8% | +16.9% | +15.3% | +22.5% |
| 2002-08 | +18.0% | +18.8% | +18.0% | +16.4% | +23.5% |
| 2002-09 | +19.8% | +19.6% | +20.3% | +18.7% | +23.7% |
| 2002-10 | +19.3% | +18.4% | +20.0% | +18.6% | +23.5% |
| 2002-11 | +21.9% | +21.4% | +22.4% | +21.2% | +25.4% |
| 2002-12 | +22.5% | +21.5% | +22.7% | +22.3% | +26.1% |
| 2003-01 | +26.5% | +24.6% | +26.4% | +27.5% | +28.5% |
| 2003-02 | +26.9% | +23.7% | +27.2% | +28.3% | +28.6% |
| 2003-03 | +22.3% | +19.2% | +22.5% | +23.8% | +24.5% |
| 2003-04 | +17.7% | +14.9% | +18.4% | +18.6% | +19.7% |
| 2003-05 | +17.7% | +16.8% | +18.3% | +17.2% | +21.5% |
| 2003-06 | +19.0% | +20.9% | +19.7% | +16.1% | +24.4% |
| 2003-07 | +20.3% | +20.8% | +21.1% | +18.5% | +23.9% |
| 2003-08 | +19.3% | +19.3% | +20.1% | +17.9% | +22.5% |
| 2003-09 | +19.4% | +17.5% | +20.1% | +19.9% | +21.0% |
| 2003-10 | +22.0% | +20.9% | +22.3% | +22.0% | +24.2% |
| 2003-11 | +22.3% | +19.8% | +22.5% | +23.3% | +24.2% |
| 2003-12 | +27.8% | +25.2% | +27.9% | +29.1% | +29.4% |
| 2004-01 | +24.8% | +22.0% | +25.1% | +26.0% | +26.4% |
| 2004-02 | +24.6% | +23.7% | +24.9% | +24.9% | +26.3% |
| 2004-03 | +22.3% | +22.4% | +22.7% | +21.7% | +25.2% |
| 2004-04 | +26.2% | +24.5% | +26.0% | +27.5% | +27.1% |
| 2004-05 | +26.0% | +21.3% | +25.1% | +29.6% | +25.4% |
| 2004-06 | +30.3% | +23.5% | +29.3% | +35.6% | +28.3% |
| 2004-07 | +29.7% | +23.3% | +28.6% | +34.4% | +29.1% |
| 2004-08 | +33.9% | +26.5% | +32.4% | +40.1% | +30.6% |
| 2004-09 | +30.4% | +21.3% | +28.2% | +38.2% | +25.6% |
| 2004-10 | +31.6% | +21.6% | +29.4% | +40.2% | +26.4% |
| 2004-11 | +29.9% | +21.2% | +27.8% | +37.3% | +26.2% |
| 2004-12 | +26.4% | +19.5% | +24.7% | +31.8% | +24.7% |
| 2005-01 | +22.3% | +17.5% | +20.8% | +25.9% | +22.4% |
| 2005-02 | +20.8% | +14.5% | +19.6% | +25.1% | +20.1% |
| 2005-03 | +24.8% | +17.1% | +23.8% | +30.5% | +21.1% |
| 2005-04 | +23.0% | +14.9% | +22.2% | +29.1% | +16.7% |
| 2005-05 | +21.3% | +16.0% | +20.8% | +25.2% | +16.8% |
| 2005-06 | +17.9% | +13.3% | +17.4% | +21.6% | +13.4% |
| 2005-07 | +17.8% | +13.4% | +17.2% | +21.5% | +13.3% |
| 2005-08 | +13.8% | +10.2% | +13.3% | +16.4% | +10.9% |
| 2005-09 | +12.0% | +11.6% | +12.1% | +11.9% | +12.5% |
| 2005-10 | +9.3% | +10.1% | +9.4% | +8.6% | +10.1% |
| 2005-11 | +9.6% | +9.7% | +9.7% | +9.5% | +8.9% |
| 2005-12 | +8.1% | +6.3% | +7.7% | +9.8% | +4.6% |
| 2006-01 | +11.5% | +8.5% | +11.0% | +14.1% | +7.5% |
| 2006-02 | +13.9% | +9.8% | +12.7% | +17.8% | +8.8% |
| 2006-03 | +11.4% | +8.5% | +10.2% | +14.2% | +8.4% |
| 2006-04 | +9.4% | +8.2% | +8.1% | +11.0% | +8.0% |
| 2006-05 | +7.1% | +6.3% | +6.2% | +8.4% | +5.2% |
| 2006-06 | +7.9% | +5.6% | +6.8% | +10.3% | +5.2% |
| 2006-07 | +8.1% | +4.7% | +6.8% | +11.4% | +5.0% |
| 2006-08 | +9.1% | +6.1% | +7.9% | +12.0% | +6.5% |
| 2006-09 | +11.2% | +8.6% | +10.2% | +13.8% | +7.8% |
| 2006-10 | +9.6% | +6.3% | +8.8% | +12.7% | +5.3% |
| 2006-11 | +8.5% | +4.2% | +7.4% | +12.6% | +3.0% |
| 2006-12 | +7.1% | +3.1% | +6.1% | +10.9% | +2.6% |
| 2007-01 | +8.6% | +5.0% | +7.6% | +12.1% | +3.7% |
| 2007-02 | +7.9% | +5.9% | +7.3% | +9.8% | +5.5% |
| 2007-03 | +9.7% | +7.0% | +8.8% | +12.2% | +6.4% |
| 2007-04 | +9.4% | +6.1% | +8.4% | +12.2% | +6.9% |
| 2007-05 | +9.5% | +6.0% | +8.4% | +12.5% | +6.7% |
| 2007-06 | +8.7% | +5.5% | +7.6% | +11.4% | +6.3% |
| 2007-07 | +7.3% | +6.0% | +6.7% | +8.7% | +5.5% |
| 2007-08 | +8.0% | +6.1% | +7.3% | +9.9% | +5.4% |
| 2007-09 | +7.3% | +6.3% | +6.6% | +8.7% | +5.6% |
| 2007-10 | +8.7% | +6.8% | +7.8% | +10.8% | +6.0% |
| 2007-11 | +7.3% | +6.4% | +6.6% | +8.4% | +5.8% |
| 2007-12 | +8.3% | +6.8% | +7.6% | +9.9% | +5.4% |
| 2008-01 | +6.0% | +5.7% | +5.4% | +6.8% | +4.9% |
| 2008-02 | +5.7% | +4.7% | +4.9% | +7.3% | +2.6% |
| 2008-03 | +3.2% | +3.5% | +2.9% | +3.9% | +1.2% |
| 2008-04 | +1.8% | +2.6% | +1.7% | +2.4% | -0.8% |
| 2008-05 | +3.7% | +4.5% | +3.7% | +3.9% | +2.1% |
| 2008-06 | +2.4% | +3.3% | +2.3% | +2.7% | +1.6% |
| 2008-07 | +2.4% | +2.8% | +2.6% | +2.7% | +1.4% |
| 2008-08 | -2.6% | -1.4% | -2.2% | -2.9% | -2.7% |
| 2008-09 | -4.9% | -4.6% | -4.8% | -4.9% | -5.2% |
| 2008-10 | -5.8% | -3.9% | -5.6% | -7.2% | -3.8% |
| 2008-11 | -5.2% | -2.8% | -4.7% | -7.3% | -2.5% |
| 2008-12 | -8.5% | -4.8% | -7.6% | -11.3% | -5.3% |
| 2009-01 | -11.7% | -10.3% | -11.3% | -12.6% | -11.0% |
| 2009-02 | -14.7% | -14.2% | -14.8% | -14.6% | -14.7% |
| 2009-03 | -11.8% | -12.0% | -12.4% | -11.4% | -11.6% |
| 2009-04 | -9.2% | -9.2% | -9.6% | -9.4% | -8.2% |
| 2009-05 | -7.7% | -7.3% | -8.1% | -7.8% | -7.3% |
| 2009-06 | -9.0% | -7.7% | -9.0% | -9.9% | -8.5% |
| 2009-07 | -11.2% | -9.9% | -11.6% | -11.9% | -10.9% |
| 2009-08 | -8.6% | -8.1% | -9.0% | -8.5% | -9.4% |
| 2009-09 | -4.9% | -5.4% | -5.1% | -3.7% | -7.9% |
| 2009-10 | -2.1% | -3.3% | -2.2% | 0.0% | -6.9% |
| 2009-11 | -1.4% | -2.6% | -2.0% | +1.0% | -6.4% |
| 2009-12 | +3.7% | +1.9% | +2.9% | +6.7% | -1.5% |
| 2010-01 | +6.8% | +6.5% | +6.6% | +8.7% | +1.2% |
| 2010-02 | +11.8% | +13.7% | +12.7% | +12.0% | +5.5% |
| 2010-03 | +7.2% | +9.5% | +8.2% | +7.2% | +0.4% |
| 2010-04 | +5.9% | +8.1% | +6.6% | +5.8% | 0.0% |
| 2010-05 | +1.8% | +4.3% | +2.2% | +1.1% | -2.4% |
| 2010-06 | +3.4% | +6.1% | +3.8% | +2.5% | -0.5% |
| 2010-07 | +4.3% | +7.3% | +4.7% | +3.2% | +0.4% |
| 2010-08 | +3.8% | +5.9% | +4.5% | +3.1% | -0.1% |
| 2010-09 | +0.8% | +2.9% | +1.4% | -0.3% | -1.4% |
| 2010-10 | -1.0% | +0.9% | -0.4% | -2.1% | -2.9% |
| 2010-11 | -1.1% | +0.9% | -0.5% | -2.5% | -2.8% |
| 2010-12 | -2.3% | +0.4% | -1.6% | -4.1% | -4.4% |
| 2011-01 | -1.0% | +2.1% | -0.4% | -3.5% | -0.9% |
| 2011-02 | -1.0% | +1.3% | -0.8% | -3.1% | +0.5% |
| 2011-03 | +2.0% | +3.5% | +2.1% | +0.1% | +3.9% |
| 2011-04 | -1.0% | +0.2% | -0.9% | -2.4% | +0.1% |
| 2011-05 | -2.2% | -1.9% | -1.7% | -2.8% | -2.7% |
| 2011-06 | -5.7% | -5.9% | -5.2% | -6.1% | -6.1% |
| 2011-07 | -2.9% | -3.5% | -2.3% | -3.4% | -2.6% |
| 2011-08 | -3.1% | -2.7% | -2.7% | -4.2% | -2.4% |
| 2011-09 | +0.8% | +1.3% | +1.2% | 0.0% | +0.2% |
| 2011-10 | +1.7% | +1.9% | +2.2% | +1.4% | -0.5% |
| 2011-11 | +1.0% | +1.3% | +1.6% | +0.4% | -0.5% |
| 2011-12 | -2.6% | -2.5% | -2.1% | -3.3% | -3.2% |
| 2012-01 | -6.8% | -7.1% | -6.2% | -7.0% | -7.9% |
| 2012-02 | -8.7% | -9.3% | -8.2% | -8.3% | -10.7% |
| 2012-03 | -7.4% | -8.2% | -6.9% | -6.9% | -9.1% |
| 2012-04 | -1.6% | -1.8% | -1.1% | -1.6% | -2.6% |
| 2012-05 | +0.3% | +0.1% | +0.6% | +0.3% | -0.3% |
| 2012-06 | +2.2% | +1.8% | +2.3% | +2.8% | +0.4% |
| 2012-07 | -1.5% | -1.9% | -1.7% | -0.6% | -3.8% |
| 2012-08 | -0.6% | -0.7% | -0.9% | +0.3% | -2.8% |
| 2012-09 | -1.5% | -0.7% | -1.8% | -1.7% | -1.5% |
| 2012-10 | -3.3% | -2.4% | -3.7% | -4.1% | -1.9% |
| 2012-11 | -3.1% | -2.9% | -3.4% | -3.1% | -2.7% |
| 2012-12 | +0.6% | +0.7% | +0.3% | +0.9% | -0.2% |
| 2013-01 | +3.1% | +3.0% | +3.1% | +3.7% | +0.9% |
| 2013-02 | +3.9% | +4.0% | +4.2% | +4.1% | +2.8% |
| 2013-03 | +0.2% | +0.1% | +0.7% | +0.6% | -1.5% |
| 2013-04 | -2.1% | -2.7% | -1.8% | -1.3% | -3.9% |
| 2013-05 | -3.2% | -3.3% | -2.9% | -2.6% | -5.2% |
| 2013-06 | -1.8% | -1.7% | -1.4% | -1.9% | -2.4% |
| 2013-07 | +0.7% | +1.2% | +1.2% | +0.2% | +0.9% |
| 2013-08 | +3.7% | +4.3% | +4.3% | +2.9% | +4.7% |
| 2013-09 | +1.4% | +1.4% | +2.0% | +1.3% | +0.7% |
| 2013-10 | +0.6% | +0.8% | +1.1% | +0.6% | -0.9% |
| 2013-11 | +0.1% | +0.3% | +0.8% | +0.2% | -1.8% |
| 2013-12 | -0.5% | -0.5% | +0.2% | -0.8% | -1.1% |
| 2014-01 | +0.3% | +0.5% | +0.6% | -0.2% | +1.5% |
| 2014-02 | -1.2% | 0.0% | -1.1% | -2.4% | +0.6% |
| 2014-03 | +1.8% | +3.5% | +1.9% | +0.3% | +3.2% |
| 2014-04 | +2.0% | +3.3% | +2.4% | +1.0% | +2.0% |
| 2014-05 | +3.8% | +4.1% | +4.2% | +3.4% | +3.5% |
| 2014-06 | +2.9% | +3.4% | +3.2% | +2.5% | +2.2% |
| 2014-07 | +3.1% | +3.2% | +3.5% | +3.1% | +1.4% |
| 2014-08 | +1.4% | +1.9% | +1.8% | +1.2% | -0.3% |
| 2014-09 | +3.1% | +3.0% | +3.6% | +3.4% | +1.0% |
| 2014-10 | +4.1% | +4.1% | +4.4% | +4.2% | +3.6% |
| 2014-11 | +5.2% | +4.6% | +5.4% | +5.4% | +5.1% |
| 2014-12 | +5.4% | +5.1% | +5.3% | +5.5% | +5.8% |
| 2015-01 | +5.1% | +4.8% | +5.3% | +5.4% | +4.2% |
| 2015-02 | +6.6% | +6.4% | +6.8% | +7.0% | +5.3% |
| 2015-03 | +4.6% | +4.4% | +4.8% | +5.0% | +3.5% |
| 2015-04 | +4.3% | +4.9% | +4.3% | +3.9% | +4.0% |
| 2015-05 | +3.5% | +4.3% | +3.7% | +2.9% | +3.5% |
| 2015-06 | +4.6% | +5.4% | +4.9% | +4.1% | +4.1% |
| 2015-07 | +3.8% | +3.8% | +4.2% | +3.6% | +2.9% |
| 2015-08 | +2.7% | +2.8% | +3.1% | +2.7% | +1.7% |
| 2015-09 | +0.9% | +1.0% | +1.1% | +0.7% | +0.5% |
| 2015-10 | +1.0% | +1.6% | +1.3% | +0.7% | -0.2% |
| 2015-11 | +1.7% | +2.9% | +2.1% | +1.1% | +0.3% |
| 2015-12 | +2.5% | +3.5% | +3.0% | +2.3% | -0.8% |
| 2016-01 | +3.8% | +4.7% | +4.3% | +3.5% | +1.2% |
| 2016-02 | +3.6% | +4.2% | +4.0% | +3.6% | +1.1% |
| 2016-03 | +4.2% | +5.2% | +4.1% | +3.7% | +3.8% |
| 2016-04 | +2.1% | +2.3% | +2.0% | +2.4% | +0.7% |
| 2016-05 | +2.3% | +1.7% | +2.3% | +3.1% | +0.9% |
| 2016-06 | +2.3% | +1.0% | +2.6% | +3.6% | -0.1% |
| 2016-07 | +3.9% | +3.3% | +3.9% | +4.6% | +2.5% |
| 2016-08 | +3.3% | +2.7% | +3.3% | +3.8% | +2.5% |
| 2016-09 | +4.0% | +3.3% | +4.3% | +4.5% | +3.2% |
| 2016-10 | +2.4% | +1.5% | +2.8% | +2.7% | +2.3% |
| 2016-11 | +2.1% | +0.9% | +2.7% | +2.7% | +1.3% |
| 2016-12 | +1.6% | +0.5% | +1.9% | +1.9% | +2.3% |
| 2017-01 | +2.6% | +2.0% | +2.8% | +2.6% | +3.9% |
| 2017-02 | +3.2% | +2.6% | +3.3% | +3.0% | +5.1% |
| 2017-03 | +2.1% | +1.4% | +2.5% | +2.2% | +2.1% |
| 2017-04 | +4.2% | +3.9% | +4.6% | +3.9% | +5.3% |
| 2017-05 | +4.0% | +4.8% | +4.3% | +2.9% | +5.5% |
| 2017-06 | +4.3% | +5.7% | +4.4% | +2.8% | +7.3% |
| 2017-07 | +3.4% | +4.7% | +3.6% | +2.0% | +6.1% |
| 2017-08 | +4.4% | +4.7% | +4.6% | +3.7% | +6.0% |
| 2017-09 | +4.1% | +4.5% | +4.1% | +3.5% | +5.7% |
| 2017-10 | +4.6% | +4.8% | +4.7% | +4.5% | +4.6% |
| 2017-11 | +4.2% | +5.5% | +4.1% | +3.3% | +5.7% |
| 2017-12 | +6.1% | +7.1% | +6.3% | +5.4% | +6.1% |
| 2018-01 | +3.8% | +4.4% | +4.2% | +3.4% | +3.4% |
| 2018-02 | +3.5% | +3.6% | +4.4% | +3.8% | +0.6% |
| 2018-03 | +4.2% | +4.1% | +4.9% | +4.4% | +2.1% |
| 2018-04 | +4.1% | +3.5% | +5.0% | +5.0% | +0.6% |
| 2018-05 | +3.5% | +2.7% | +4.3% | +4.9% | -1.2% |
| 2018-06 | +2.5% | +1.7% | +3.5% | +3.8% | -2.9% |
| 2018-07 | +3.2% | +3.2% | +4.1% | +4.2% | -2.3% |
| 2018-08 | +3.0% | +3.1% | +3.9% | +3.5% | -1.4% |
| 2018-09 | +2.5% | +3.5% | +3.3% | +2.3% | -0.9% |
| 2018-10 | +1.7% | +2.6% | +2.4% | +1.3% | -0.1% |
| 2018-11 | +0.5% | +1.1% | +1.0% | +0.4% | -1.7% |
| 2018-12 | -0.2% | 0.0% | +0.2% | -0.1% | -2.3% |
| 2019-01 | -0.2% | -0.3% | +0.3% | +0.4% | -2.9% |
| 2019-02 | +2.4% | +2.1% | +2.6% | +2.9% | +0.8% |
| 2019-03 | +2.2% | +1.4% | +2.5% | +3.0% | 0.0% |
| 2019-04 | +2.9% | +3.3% | +3.4% | +2.6% | +2.1% |
| 2019-05 | +2.2% | +2.9% | +2.7% | +1.3% | +2.8% |
| 2019-06 | +3.8% | +4.5% | +4.1% | +2.9% | +4.6% |
| 2019-07 | +2.5% | +2.7% | +2.7% | +2.0% | +3.5% |
| 2019-08 | +1.8% | +2.5% | +2.0% | +1.3% | +1.5% |
| 2019-09 | +2.2% | +2.2% | +2.3% | +2.3% | +1.8% |
| 2019-10 | +3.7% | +2.9% | +3.9% | +4.5% | +2.5% |
| 2019-11 | +5.2% | +4.1% | +5.6% | +5.9% | +4.2% |
| 2019-12 | +2.5% | +2.0% | +3.0% | +2.6% | +1.9% |
| 2020-01 | +4.0% | +3.6% | +4.3% | +3.9% | +4.2% |
| 2020-02 | +0.2% | +0.1% | +0.4% | -0.1% | +0.7% |
| 2020-03 | +1.2% | +1.5% | +1.4% | +0.4% | +2.5% |
| 2020-04 | -3.3% | -3.3% | -3.3% | -3.5% | -2.9% |
| 2020-05 | -2.4% | -2.3% | -2.3% | -2.6% | -2.7% |
| 2020-06 | -2.6% | -2.8% | -2.3% | -2.4% | -3.8% |
| 2020-07 | -1.0% | -1.0% | -0.6% | -1.1% | -2.0% |
| 2020-08 | +2.0% | +1.5% | +2.6% | +2.3% | +1.0% |
| 2020-09 | +2.4% | +2.5% | +3.0% | +2.0% | +1.3% |
| 2020-10 | +5.7% | +6.8% | +6.2% | +4.9% | +4.1% |
| 2020-11 | +5.2% | +6.1% | +5.2% | +5.0% | +3.0% |
| 2020-12 | +8.1% | +9.0% | +7.7% | +8.1% | +6.2% |
| 2021-01 | +5.6% | +5.9% | +5.3% | +6.0% | +4.2% |
| 2021-02 | +8.6% | +8.6% | +8.3% | +9.0% | +8.1% |
| 2021-03 | +9.3% | +7.7% | +8.9% | +10.9% | +8.4% |
| 2021-04 | +13.1% | +11.4% | +12.6% | +14.7% | +13.1% |
| 2021-05 | +10.2% | +8.5% | +9.4% | +12.0% | +10.3% |
| 2021-06 | +11.2% | +9.5% | +10.0% | +13.1% | +12.7% |
| 2021-07 | +7.4% | +5.6% | +6.4% | +9.4% | +8.4% |
| 2021-08 | +6.8% | +5.4% | +5.8% | +8.3% | +7.9% |
| 2021-09 | +4.1% | +2.3% | +3.5% | +5.8% | +4.2% |
| 2021-10 | +1.9% | +0.6% | +1.4% | +3.4% | +2.0% |
| 2021-11 | +1.7% | +0.6% | +1.4% | +2.7% | +1.7% |
| 2021-12 | +1.1% | +0.7% | +0.9% | +1.7% | +0.7% |
| 2022-01 | +4.6% | +4.6% | +4.7% | +5.2% | +3.0% |
| 2022-02 | +6.4% | +6.5% | +6.5% | +6.9% | +4.0% |
| 2022-03 | +3.8% | +4.9% | +4.2% | +3.7% | +0.5% |
| 2022-04 | +4.7% | +5.7% | +5.2% | +4.6% | +1.6% |
| 2022-05 | +7.3% | +8.2% | +7.9% | +7.2% | +3.6% |
| 2022-06 | +7.6% | +8.4% | +8.3% | +7.3% | +4.2% |
| 2022-07 | +10.9% | +11.7% | +11.6% | +10.7% | +7.3% |
| 2022-08 | +10.2% | +10.8% | +10.8% | +10.3% | +7.0% |
| 2022-09 | +13.5% | +14.1% | +13.8% | +13.8% | +10.0% |
| 2022-10 | +12.9% | +12.9% | +13.2% | +13.4% | +9.8% |
| 2022-11 | +11.3% | +11.3% | +11.5% | +11.9% | +8.2% |
| 2022-12 | +9.9% | +9.2% | +10.1% | +10.8% | +7.7% |
| 2023-01 | +6.5% | +6.3% | +6.8% | +7.0% | +4.5% |
| 2023-02 | +3.4% | +3.6% | +3.7% | +3.6% | +1.4% |
| 2023-03 | +5.6% | +6.2% | +5.8% | +5.5% | +3.6% |
| 2023-04 | +3.5% | +4.5% | +3.8% | +3.0% | +1.9% |
| 2023-05 | +4.0% | +4.7% | +4.3% | +3.4% | +3.2% |
| 2023-06 | -0.3% | +0.5% | -0.1% | -0.8% | -1.5% |
| 2023-07 | -1.5% | -0.7% | -1.3% | -1.9% | -2.6% |
| 2023-08 | -3.9% | -3.0% | -3.7% | -4.3% | -5.2% |
| 2023-09 | -4.2% | -3.6% | -4.0% | -4.5% | -5.1% |
| 2023-10 | -3.3% | -3.2% | -3.2% | -3.5% | -4.0% |
| 2023-11 | -0.6% | -0.4% | -0.2% | -0.9% | -0.9% |
| 2023-12 | +1.7% | +1.9% | +2.0% | +1.3% | +1.4% |
| 2024-01 | +0.3% | +0.4% | +0.4% | +0.1% | +0.1% |
| 2024-02 | -0.5% | -1.0% | -0.3% | -0.2% | -0.9% |
| 2024-03 | -1.1% | -2.0% | -1.1% | -0.6% | -1.1% |
| 2024-04 | +0.4% | -1.0% | +0.5% | +1.3% | +0.6% |
| 2024-05 | +0.7% | -0.5% | +0.6% | +1.5% | +1.0% |
| 2024-06 | +0.5% | -0.9% | +0.4% | +1.4% | +0.7% |
| 2024-07 | +0.4% | -0.8% | +0.3% | +1.3% | +0.3% |
| 2024-08 | +2.0% | +0.7% | +1.9% | +3.0% | +2.2% |
| 2024-09 | +3.8% | +2.8% | +3.7% | +4.5% | +3.3% |
| 2024-10 | +4.0% | +3.5% | +4.0% | +4.6% | +3.6% |
| 2024-11 | +3.9% | +3.3% | +3.9% | +4.6% | +2.8% |
| 2024-12 | +2.7% | +2.3% | +2.7% | +3.4% | +1.0% |
| 2025-01 | +4.6% | +4.3% | +4.8% | +5.3% | +2.1% |
| 2025-02 | +4.2% | +4.4% | +4.3% | +4.7% | +1.9% |
| 2025-03 | +5.0% | +4.2% | +5.1% | +6.1% | +3.4% |
| 2025-04 | -0.9% | -1.0% | -0.7% | -0.3% | -3.0% |
| 2025-05 | -4.0% | -3.7% | -3.7% | -3.6% | -6.7% |
| 2025-06 | -5.0% | -3.6% | -4.5% | -5.3% | -8.6% |
| 2025-07 | -2.1% | -1.1% | -1.8% | -2.2% | -5.2% |
| 2025-08 | -0.2% | +0.5% | +0.3% | -0.3% | -3.1% |
| 2025-09 | -0.7% | -0.3% | -0.2% | -0.5% | -3.2% |
| 2025-10 | +0.4% | +0.6% | +1.1% | +0.6% | -2.9% |
| 2025-11 | -0.2% | 0.0% | +0.3% | +0.2% | -3.4% |
| 2025-12 | -0.3% | -0.3% | +0.2% | +0.1% | -3.3% |
| 2026-01 | -1.7% | -2.0% | -1.4% | -1.0% | -4.1% |
| 2026-02 | -1.6% | -1.8% | -1.1% | -1.1% | -4.2% |
| 2026-03 | -2.7% | -1.9% | -2.1% | -2.6% | -6.9% |
| 2026-04 | +2.7% | +3.2% | +3.3% | +2.9% | -1.6% |
| 2026-05 | +6.8% | +7.1% | +7.5% | +7.2% | +2.4% |
Cumberland
Cumberland averaged £173,130 in May 2026, about 41% below the England average, and that is the highest monthly figure in its record. It covers Keswick, Cockermouth, Gosforth and the western valleys, along with Carlisle and the west coast towns that this guide does not otherwise deal with.
Its five-year change is stronger than its neighbour's at 24.9%, up from £138,610 in May 2021. In the last crash it peaked at £132,667 in October 2007 and fell to £111,800 by May 2009, a drop of 15.7%.
The gap between the two is the thing to hold on to. Cumberland is cheaper, has grown faster over five years, and is at a record high. Westmorland and Furness is dearer, has grown more slowly, and is off its peak. The premium postcodes sit in the second of those.
- All property types
- Detached
- Semi-detached
- Terraced
- Flats
Source: HM Land Registry House Price Index
| Year | All property types | Detached | Semi-detached | Terraced | Flats |
|---|---|---|---|---|---|
| 1995-01 | £40,294 | £69,273 | £40,625 | £31,940 | £29,018 |
| 1995-02 | £40,868 | £69,775 | £41,513 | £32,331 | £29,213 |
| 1995-03 | £41,143 | £69,928 | £41,801 | £32,625 | £29,378 |
| 1995-04 | £41,843 | £70,923 | £42,555 | £33,214 | £29,755 |
| 1995-05 | £42,160 | £71,569 | £42,785 | £33,510 | £29,909 |
| 1995-06 | £41,536 | £70,702 | £42,199 | £32,919 | £29,590 |
| 1995-07 | £40,886 | £69,828 | £41,534 | £32,363 | £29,013 |
| 1995-08 | £39,613 | £67,913 | £40,231 | £31,307 | £28,034 |
| 1995-09 | £40,089 | £68,983 | £40,600 | £31,732 | £28,079 |
| 1995-10 | £39,779 | £68,647 | £40,381 | £31,371 | £27,895 |
| 1995-11 | £40,292 | £69,556 | £40,973 | £31,694 | £28,487 |
| 1995-12 | £39,934 | £69,076 | £40,647 | £31,350 | £28,258 |
| 1996-01 | £39,252 | £67,780 | £40,004 | £30,800 | £27,843 |
| 1996-02 | £38,589 | £66,379 | £39,382 | £30,337 | £27,243 |
| 1996-03 | £38,205 | £65,646 | £39,100 | £29,984 | £26,982 |
| 1996-04 | £39,391 | £67,595 | £40,178 | £31,044 | £27,820 |
| 1996-05 | £39,885 | £68,576 | £40,564 | £31,469 | £28,256 |
| 1996-06 | £40,348 | £69,386 | £40,964 | £31,854 | £28,789 |
| 1996-07 | £39,787 | £68,633 | £40,406 | £31,363 | £28,203 |
| 1996-08 | £39,986 | £69,451 | £40,523 | £31,484 | £28,032 |
| 1996-09 | £40,160 | £69,958 | £40,651 | £31,621 | £27,964 |
| 1996-10 | £40,289 | £70,234 | £40,944 | £31,589 | £28,045 |
| 1996-11 | £40,112 | £69,743 | £40,820 | £31,444 | £28,062 |
| 1996-12 | £39,908 | £69,387 | £40,558 | £31,345 | £27,774 |
| 1997-01 | £40,155 | £69,827 | £40,684 | £31,632 | £27,926 |
| 1997-02 | £40,148 | £69,969 | £40,680 | £31,579 | £27,900 |
| 1997-03 | £40,141 | £70,016 | £40,608 | £31,585 | £27,905 |
| 1997-04 | £40,299 | £70,298 | £40,716 | £31,743 | £28,003 |
| 1997-05 | £40,654 | £70,689 | £41,101 | £32,096 | £28,051 |
| 1997-06 | £41,527 | £72,329 | £42,086 | £32,737 | £28,290 |
| 1997-07 | £42,264 | £73,825 | £42,784 | £33,345 | £28,392 |
| 1997-08 | £43,264 | £76,003 | £43,747 | £34,068 | £28,912 |
| 1997-09 | £43,027 | £75,640 | £43,482 | £33,875 | £28,803 |
| 1997-10 | £43,217 | £76,055 | £43,735 | £33,949 | £29,037 |
| 1997-11 | £43,866 | £77,335 | £44,333 | £34,456 | £29,491 |
| 1997-12 | £42,968 | £75,786 | £43,550 | £33,638 | £29,075 |
| 1998-01 | £42,140 | £74,453 | £42,708 | £32,919 | £28,796 |
| 1998-02 | £41,020 | £72,309 | £41,556 | £32,066 | £28,370 |
| 1998-03 | £42,716 | £75,169 | £43,164 | £33,516 | £29,420 |
| 1998-04 | £43,603 | £76,591 | £44,026 | £34,290 | £29,899 |
| 1998-05 | £43,414 | £76,151 | £43,924 | £34,123 | £29,679 |
| 1998-06 | £42,980 | £75,602 | £43,464 | £33,721 | £29,484 |
| 1998-07 | £43,144 | £75,983 | £43,639 | £33,827 | £29,507 |
| 1998-08 | £43,823 | £77,540 | £44,213 | £34,349 | £29,792 |
| 1998-09 | £44,848 | £79,532 | £45,183 | £35,146 | £30,484 |
| 1998-10 | £43,870 | £77,665 | £44,385 | £34,266 | £30,037 |
| 1998-11 | £43,874 | £77,819 | £44,469 | £34,151 | £30,200 |
| 1998-12 | £42,953 | £76,092 | £43,646 | £33,372 | £29,693 |
| 1999-01 | £43,517 | £77,314 | £43,987 | £33,924 | £29,897 |
| 1999-02 | £43,075 | £76,226 | £43,558 | £33,662 | £29,540 |
| 1999-03 | £42,940 | £75,751 | £43,441 | £33,578 | £29,628 |
| 1999-04 | £42,906 | £75,155 | £43,461 | £33,631 | £29,883 |
| 1999-05 | £44,428 | £77,766 | £44,853 | £34,933 | £30,996 |
| 1999-06 | £45,483 | £79,605 | £45,833 | £35,845 | £31,592 |
| 1999-07 | £45,608 | £80,362 | £45,810 | £35,920 | £31,449 |
| 1999-08 | £44,960 | £79,286 | £45,182 | £35,390 | £30,891 |
| 1999-09 | £45,065 | £79,956 | £45,178 | £35,424 | £30,840 |
| 1999-10 | £46,322 | £82,222 | £46,570 | £36,275 | £31,938 |
| 1999-11 | £46,373 | £82,341 | £46,637 | £36,269 | £32,148 |
| 1999-12 | £45,792 | £80,792 | £46,223 | £35,820 | £31,952 |
| 2000-01 | £45,187 | £79,645 | £45,698 | £35,343 | £31,336 |
| 2000-02 | £45,133 | £79,652 | £45,722 | £35,192 | £31,479 |
| 2000-03 | £45,032 | £79,825 | £45,560 | £35,079 | £31,227 |
| 2000-04 | £45,695 | £81,055 | £45,952 | £35,746 | £31,850 |
| 2000-05 | £46,197 | £82,042 | £46,356 | £36,180 | £32,195 |
| 2000-06 | £45,855 | £81,510 | £46,002 | £35,859 | £32,215 |
| 2000-07 | £45,461 | £81,298 | £45,705 | £35,356 | £31,826 |
| 2000-08 | £46,007 | £82,564 | £46,370 | £35,610 | £32,253 |
| 2000-09 | £47,051 | £84,753 | £47,418 | £36,351 | £32,826 |
| 2000-10 | £47,451 | £85,458 | £47,896 | £36,597 | £33,222 |
| 2000-11 | £47,101 | £84,959 | £47,505 | £36,322 | £32,918 |
| 2000-12 | £46,974 | £84,495 | £47,468 | £36,190 | £33,141 |
| 2001-01 | £47,177 | £84,720 | £47,674 | £36,363 | £33,431 |
| 2001-02 | £47,326 | £85,129 | £47,669 | £36,556 | £33,396 |
| 2001-03 | £47,606 | £85,722 | £47,859 | £36,842 | £33,328 |
| 2001-04 | £47,570 | £85,854 | £47,640 | £36,879 | £33,260 |
| 2001-05 | £46,770 | £83,837 | £46,994 | £36,289 | £32,993 |
| 2001-06 | £47,507 | £85,019 | £47,739 | £36,869 | £33,757 |
| 2001-07 | £47,276 | £84,284 | £47,717 | £36,656 | £33,554 |
| 2001-08 | £49,055 | £87,812 | £49,431 | £37,986 | £34,783 |
| 2001-09 | £49,066 | £88,366 | £49,283 | £37,931 | £34,845 |
| 2001-10 | £50,079 | £90,473 | £50,240 | £38,662 | £35,612 |
| 2001-11 | £49,145 | £88,839 | £49,315 | £37,922 | £34,925 |
| 2001-12 | £49,116 | £88,607 | £49,357 | £37,869 | £35,207 |
| 2002-01 | £49,382 | £89,288 | £49,546 | £38,062 | £35,415 |
| 2002-02 | £50,320 | £90,829 | £50,481 | £38,835 | £36,090 |
| 2002-03 | £51,061 | £91,831 | £51,302 | £39,483 | £36,409 |
| 2002-04 | £51,659 | £92,417 | £51,935 | £40,010 | £37,293 |
| 2002-05 | £53,424 | £95,120 | £53,841 | £41,401 | £38,795 |
| 2002-06 | £54,909 | £97,533 | £55,343 | £42,583 | £40,130 |
| 2002-07 | £56,299 | £100,233 | £56,690 | £43,686 | £40,683 |
| 2002-08 | £57,429 | £102,496 | £57,732 | £44,561 | £41,408 |
| 2002-09 | £58,660 | £105,119 | £58,970 | £45,420 | £42,043 |
| 2002-10 | £59,035 | £105,666 | £59,480 | £45,618 | £42,672 |
| 2002-11 | £58,326 | £104,722 | £58,674 | £44,996 | £42,440 |
| 2002-12 | £58,417 | £104,177 | £58,962 | £45,105 | £42,897 |
| 2003-01 | £59,945 | £106,381 | £60,505 | £46,448 | £43,957 |
| 2003-02 | £61,222 | £108,006 | £61,985 | £47,516 | £44,822 |
| 2003-03 | £62,858 | £111,133 | £63,442 | £48,855 | £45,876 |
| 2003-04 | £63,764 | £112,430 | £64,461 | £49,545 | £46,861 |
| 2003-05 | £67,184 | £118,177 | £67,938 | £52,287 | £49,293 |
| 2003-06 | £68,897 | £121,319 | £69,505 | £53,680 | £50,605 |
| 2003-07 | £70,244 | £123,097 | £71,120 | £54,750 | £51,581 |
| 2003-08 | £70,860 | £123,904 | £71,784 | £55,267 | £52,193 |
| 2003-09 | £72,756 | £126,626 | £73,882 | £56,832 | £53,439 |
| 2003-10 | £76,525 | £133,292 | £77,426 | £59,980 | £55,747 |
| 2003-11 | £77,664 | £134,751 | £78,757 | £60,883 | £56,885 |
| 2003-12 | £79,354 | £136,718 | £80,490 | £62,487 | £58,202 |
| 2004-01 | £78,957 | £135,882 | £80,003 | £62,196 | £58,535 |
| 2004-02 | £80,700 | £138,517 | £81,682 | £63,709 | £59,856 |
| 2004-03 | £81,438 | £139,598 | £82,261 | £64,382 | £60,540 |
| 2004-04 | £83,482 | £141,463 | £84,544 | £66,282 | £62,014 |
| 2004-05 | £86,395 | £145,165 | £86,896 | £69,334 | £63,593 |
| 2004-06 | £88,556 | £147,735 | £89,344 | £71,133 | £65,425 |
| 2004-07 | £94,514 | £157,490 | £95,027 | £76,254 | £69,218 |
| 2004-08 | £97,933 | £163,341 | £98,579 | £78,915 | £71,675 |
| 2004-09 | £100,785 | £168,431 | £101,174 | £81,357 | £73,340 |
| 2004-10 | £99,692 | £166,728 | £100,054 | £80,394 | £72,908 |
| 2004-11 | £100,625 | £167,958 | £100,930 | £81,246 | £73,695 |
| 2004-12 | £102,004 | £169,302 | £102,070 | £82,662 | £75,156 |
| 2005-01 | £100,548 | £166,612 | £100,704 | £81,404 | £74,644 |
| 2005-02 | £99,232 | £164,622 | £99,484 | £80,219 | £73,967 |
| 2005-03 | £100,068 | £166,128 | £100,733 | £80,755 | £74,024 |
| 2005-04 | £102,408 | £169,311 | £103,155 | £82,841 | £75,409 |
| 2005-05 | £104,543 | £172,788 | £105,174 | £84,665 | £76,980 |
| 2005-06 | £105,346 | £173,276 | £105,803 | £85,658 | £77,469 |
| 2005-07 | £107,287 | £176,754 | £107,604 | £87,334 | £78,562 |
| 2005-08 | £109,411 | £180,264 | £109,621 | £89,176 | £79,914 |
| 2005-09 | £109,783 | £181,443 | £109,808 | £89,371 | £80,604 |
| 2005-10 | £110,649 | £183,029 | £110,348 | £90,281 | £81,091 |
| 2005-11 | £110,313 | £182,192 | £109,919 | £90,078 | £81,119 |
| 2005-12 | £111,984 | £184,361 | £111,351 | £91,691 | £82,576 |
| 2006-01 | £111,554 | £182,741 | £111,221 | £91,300 | £82,584 |
| 2006-02 | £112,594 | £183,480 | £112,458 | £92,258 | £83,269 |
| 2006-03 | £111,841 | £182,601 | £111,922 | £91,475 | £82,338 |
| 2006-04 | £114,771 | £187,565 | £114,635 | £94,089 | £83,891 |
| 2006-05 | £116,180 | £190,098 | £116,044 | £95,315 | £84,336 |
| 2006-06 | £118,245 | £192,751 | £118,226 | £97,199 | £85,483 |
| 2006-07 | £119,677 | £194,984 | £119,441 | £98,652 | £85,984 |
| 2006-08 | £120,049 | £195,520 | £119,890 | £98,939 | £86,216 |
| 2006-09 | £122,478 | £200,404 | £122,077 | £100,915 | £87,662 |
| 2006-10 | £123,119 | £202,015 | £122,818 | £101,242 | £88,123 |
| 2006-11 | £123,828 | £203,403 | £123,380 | £101,922 | £88,327 |
| 2006-12 | £122,265 | £199,914 | £121,760 | £100,852 | £87,442 |
| 2007-01 | £121,722 | £198,036 | £121,437 | £100,502 | £87,161 |
| 2007-02 | £123,063 | £199,670 | £122,871 | £101,628 | £88,416 |
| 2007-03 | £123,761 | £200,387 | £123,814 | £102,261 | £88,537 |
| 2007-04 | £124,422 | £201,435 | £124,133 | £103,019 | £89,032 |
| 2007-05 | £124,039 | £200,202 | £123,604 | £102,948 | £88,799 |
| 2007-06 | £126,442 | £203,977 | £125,908 | £104,953 | £90,858 |
| 2007-07 | £127,368 | £205,697 | £126,888 | £105,636 | £91,474 |
| 2007-08 | £130,558 | £211,867 | £129,966 | £108,288 | £92,757 |
| 2007-09 | £131,656 | £214,682 | £130,821 | £109,189 | £92,975 |
| 2007-10 | £132,667 | £216,742 | £131,703 | £109,988 | £93,718 |
| 2007-11 | £130,807 | £213,720 | £129,894 | £108,297 | £92,962 |
| 2007-12 | £129,706 | £211,882 | £128,717 | £107,418 | £92,314 |
| 2008-01 | £127,845 | £208,899 | £126,798 | £105,917 | £90,941 |
| 2008-02 | £126,720 | £207,018 | £125,679 | £105,026 | £89,984 |
| 2008-03 | £125,181 | £203,690 | £124,604 | £103,836 | £88,205 |
| 2008-04 | £126,588 | £205,408 | £126,216 | £105,125 | £88,757 |
| 2008-05 | £127,285 | £205,841 | £127,082 | £105,826 | £89,052 |
| 2008-06 | £127,254 | £205,921 | £126,887 | £105,780 | £89,422 |
| 2008-07 | £126,314 | £205,068 | £125,988 | £104,853 | £88,501 |
| 2008-08 | £124,751 | £202,784 | £124,504 | £103,466 | £87,277 |
| 2008-09 | £123,523 | £202,147 | £123,174 | £102,149 | £86,403 |
| 2008-10 | £121,952 | £199,456 | £121,747 | £100,697 | £85,705 |
| 2008-11 | £118,962 | £194,628 | £118,877 | £98,029 | £84,060 |
| 2008-12 | £119,226 | £194,708 | £119,081 | £98,498 | £83,751 |
| 2009-01 | £115,763 | £189,652 | £115,465 | £95,517 | £81,586 |
| 2009-02 | £117,551 | £193,170 | £116,958 | £97,157 | £82,351 |
| 2009-03 | £113,364 | £186,189 | £112,951 | £93,464 | £80,132 |
| 2009-04 | £114,360 | £186,830 | £114,126 | £94,621 | £80,197 |
| 2009-05 | £111,800 | £182,517 | £111,631 | £92,513 | £78,343 |
| 2009-06 | £114,109 | £186,445 | £113,912 | £94,637 | £79,022 |
| 2009-07 | £114,930 | £188,612 | £114,577 | £95,297 | £79,144 |
| 2009-08 | £117,374 | £193,159 | £117,009 | £97,439 | £79,798 |
| 2009-09 | £120,017 | £197,729 | £119,679 | £99,563 | £81,505 |
| 2009-10 | £122,436 | £201,753 | £122,238 | £101,553 | £82,760 |
| 2009-11 | £122,459 | £201,850 | £122,185 | £101,447 | £83,388 |
| 2009-12 | £122,624 | £201,045 | £122,472 | £101,920 | £83,151 |
| 2010-01 | £119,797 | £197,105 | £119,697 | £99,446 | £80,786 |
| 2010-02 | £123,184 | £203,681 | £123,277 | £102,203 | £81,486 |
| 2010-03 | £121,033 | £201,436 | £121,209 | £99,999 | £80,102 |
| 2010-04 | £122,517 | £203,325 | £122,853 | £101,198 | £81,552 |
| 2010-05 | £118,733 | £196,451 | £118,950 | £98,125 | £80,075 |
| 2010-06 | £120,772 | £199,731 | £120,857 | £100,072 | £80,788 |
| 2010-07 | £120,753 | £200,481 | £120,674 | £100,022 | £80,313 |
| 2010-08 | £123,032 | £204,877 | £123,242 | £101,702 | £80,891 |
| 2010-09 | £122,166 | £204,306 | £122,415 | £100,697 | £80,243 |
| 2010-10 | £123,467 | £206,427 | £123,918 | £101,624 | £81,187 |
| 2010-11 | £121,188 | £202,760 | £121,535 | £99,712 | £79,987 |
| 2010-12 | £122,877 | £205,303 | £123,379 | £101,135 | £80,846 |
| 2011-01 | £120,727 | £202,500 | £121,028 | £99,351 | £78,981 |
| 2011-02 | £120,201 | £201,535 | £120,516 | £98,955 | £78,531 |
| 2011-03 | £115,585 | £194,160 | £115,945 | £94,953 | £75,753 |
| 2011-04 | £116,965 | £195,879 | £117,345 | £96,242 | £76,737 |
| 2011-05 | £115,899 | £193,632 | £116,457 | £95,305 | £76,413 |
| 2011-06 | £120,604 | £201,149 | £121,193 | £99,330 | £79,231 |
| 2011-07 | £118,724 | £197,658 | £119,461 | £97,794 | £77,915 |
| 2011-08 | £120,425 | £201,092 | £121,216 | £99,159 | £78,120 |
| 2011-09 | £116,342 | £195,053 | £116,992 | £95,712 | £75,108 |
| 2011-10 | £117,358 | £197,778 | £117,990 | £96,283 | £75,601 |
| 2011-11 | £116,063 | £195,718 | £116,651 | £95,103 | £75,308 |
| 2011-12 | £116,002 | £195,132 | £116,943 | £94,852 | £75,756 |
| 2012-01 | £112,963 | £189,684 | £114,089 | £92,373 | £73,502 |
| 2012-02 | £112,554 | £188,783 | £113,553 | £92,290 | £72,837 |
| 2012-03 | £114,142 | £190,806 | £114,876 | £94,144 | £73,362 |
| 2012-04 | £116,578 | £194,873 | £117,100 | £96,214 | £75,532 |
| 2012-05 | £118,067 | £197,308 | £118,573 | £97,485 | £76,474 |
| 2012-06 | £117,386 | £196,440 | £117,909 | £96,809 | £76,045 |
| 2012-07 | £115,643 | £193,054 | £116,234 | £95,520 | £74,665 |
| 2012-08 | £117,230 | £195,564 | £117,796 | £96,983 | £75,262 |
| 2012-09 | £117,404 | £196,067 | £118,023 | £97,042 | £75,225 |
| 2012-10 | £115,017 | £192,394 | £115,530 | £94,979 | £73,988 |
| 2012-11 | £114,815 | £192,391 | £115,234 | £94,822 | £73,570 |
| 2012-12 | £114,244 | £191,673 | £114,633 | £94,279 | £73,267 |
| 2013-01 | £114,473 | £191,800 | £115,134 | £94,403 | £73,125 |
| 2013-02 | £111,991 | £186,970 | £112,998 | £92,204 | £72,147 |
| 2013-03 | £112,263 | £187,466 | £113,396 | £92,317 | £72,333 |
| 2013-04 | £115,606 | £193,299 | £116,657 | £95,126 | £74,158 |
| 2013-05 | £114,992 | £192,285 | £115,994 | £94,638 | £73,815 |
| 2013-06 | £115,527 | £192,884 | £116,458 | £95,296 | £73,854 |
| 2013-07 | £116,409 | £194,276 | £117,163 | £96,207 | £74,307 |
| 2013-08 | £118,158 | £197,426 | £118,941 | £97,649 | £74,981 |
| 2013-09 | £117,163 | £196,193 | £117,959 | £96,693 | £74,203 |
| 2013-10 | £115,516 | £193,691 | £116,615 | £95,005 | £73,249 |
| 2013-11 | £113,637 | £190,805 | £114,883 | £93,203 | £72,281 |
| 2013-12 | £114,598 | £191,683 | £116,258 | £93,937 | £73,027 |
| 2014-01 | £117,420 | £196,397 | £119,033 | £96,361 | £74,592 |
| 2014-02 | £119,375 | £200,028 | £120,847 | £98,021 | £75,528 |
| 2014-03 | £119,213 | £200,427 | £120,423 | £97,898 | £75,181 |
| 2014-04 | £117,912 | £197,902 | £119,137 | £96,936 | £74,333 |
| 2014-05 | £117,871 | £197,024 | £119,210 | £97,049 | £74,598 |
| 2014-06 | £117,147 | £195,131 | £118,696 | £96,481 | £74,456 |
| 2014-07 | £119,424 | £199,029 | £120,936 | £98,440 | £75,569 |
| 2014-08 | £118,699 | £198,160 | £120,138 | £97,853 | £74,713 |
| 2014-09 | £121,359 | £203,075 | £122,561 | £100,096 | £76,199 |
| 2014-10 | £118,598 | £198,310 | £119,915 | £97,686 | £74,868 |
| 2014-11 | £119,285 | £199,572 | £120,737 | £98,062 | £75,585 |
| 2014-12 | £117,790 | £196,993 | £119,495 | £96,639 | £74,824 |
| 2015-01 | £117,165 | £196,036 | £118,999 | £96,009 | £74,399 |
| 2015-02 | £119,159 | £199,286 | £120,983 | £97,667 | £75,837 |
| 2015-03 | £116,858 | £196,208 | £118,438 | £95,599 | £74,668 |
| 2015-04 | £118,417 | £199,309 | £119,843 | £96,919 | £75,271 |
| 2015-05 | £115,524 | £194,382 | £117,064 | £94,527 | £73,171 |
| 2015-06 | £117,729 | £197,170 | £119,612 | £96,567 | £73,907 |
| 2015-07 | £118,036 | £197,326 | £120,041 | £96,809 | £74,315 |
| 2015-08 | £119,511 | £200,160 | £121,399 | £98,014 | £75,152 |
| 2015-09 | £120,832 | £203,438 | £122,470 | £98,930 | £75,966 |
| 2015-10 | £120,775 | £203,370 | £122,655 | £98,782 | £75,596 |
| 2015-11 | £121,814 | £205,100 | £123,984 | £99,545 | £75,827 |
| 2015-12 | £122,775 | £206,574 | £125,228 | £100,312 | £75,908 |
| 2016-01 | £122,370 | £205,987 | £124,863 | £99,938 | £75,569 |
| 2016-02 | £124,133 | £209,442 | £126,288 | £101,391 | £77,019 |
| 2016-03 | £124,622 | £210,597 | £126,483 | £101,774 | £77,835 |
| 2016-04 | £123,941 | £209,510 | £125,565 | £101,318 | £77,551 |
| 2016-05 | £121,403 | £204,201 | £123,245 | £99,389 | £76,064 |
| 2016-06 | £119,320 | £200,308 | £121,157 | £97,809 | £74,686 |
| 2016-07 | £121,585 | £203,777 | £123,500 | £99,739 | £76,137 |
| 2016-08 | £123,363 | £207,241 | £125,221 | £101,148 | £77,008 |
| 2016-09 | £125,881 | £211,660 | £127,969 | £103,084 | £78,289 |
| 2016-10 | £125,057 | £211,285 | £127,083 | £102,074 | £77,934 |
| 2016-11 | £124,754 | £211,903 | £126,817 | £101,425 | £77,772 |
| 2016-12 | £123,783 | £210,446 | £125,774 | £100,528 | £77,538 |
| 2017-01 | £125,342 | £213,443 | £127,387 | £101,691 | £78,379 |
| 2017-02 | £125,635 | £213,557 | £127,543 | £102,012 | £79,216 |
| 2017-03 | £124,571 | £212,203 | £126,495 | £100,951 | £78,670 |
| 2017-04 | £124,084 | £210,849 | £125,992 | £100,712 | £78,451 |
| 2017-05 | £123,492 | £209,358 | £125,623 | £100,277 | £77,843 |
| 2017-06 | £123,913 | £209,207 | £126,017 | £100,905 | £78,185 |
| 2017-07 | £125,368 | £211,441 | £127,544 | £102,122 | £79,136 |
| 2017-08 | £127,989 | £216,286 | £129,819 | £104,431 | £80,610 |
| 2017-09 | £129,647 | £219,592 | £131,628 | £105,556 | £81,538 |
| 2017-10 | £129,617 | £219,926 | £131,665 | £105,385 | £81,410 |
| 2017-11 | £129,087 | £218,786 | £131,572 | £104,747 | £80,960 |
| 2017-12 | £128,716 | £218,217 | £131,083 | £104,503 | £80,731 |
| 2018-01 | £127,703 | £216,379 | £130,321 | £103,546 | £80,041 |
| 2018-02 | £126,451 | £214,919 | £129,020 | £102,431 | £78,804 |
| 2018-03 | £126,979 | £216,066 | £129,671 | £102,801 | £78,700 |
| 2018-04 | £127,953 | £217,641 | £130,561 | £103,784 | £78,939 |
| 2018-05 | £127,505 | £216,859 | £130,033 | £103,561 | £78,333 |
| 2018-06 | £127,746 | £216,737 | £130,496 | £103,769 | £78,574 |
| 2018-07 | £128,411 | £218,374 | £131,065 | £104,202 | £78,981 |
| 2018-08 | £132,254 | £224,653 | £135,150 | £107,261 | £81,476 |
| 2018-09 | £132,187 | £225,249 | £134,943 | £107,142 | £81,035 |
| 2018-10 | £132,600 | £225,972 | £135,486 | £107,345 | £81,418 |
| 2018-11 | £129,341 | £220,589 | £132,242 | £104,581 | £79,404 |
| 2018-12 | £128,371 | £218,106 | £131,505 | £103,794 | £79,316 |
| 2019-01 | £127,160 | £216,542 | £130,254 | £102,626 | £78,630 |
| 2019-02 | £127,970 | £218,043 | £131,241 | £103,083 | £79,318 |
| 2019-03 | £128,702 | £219,843 | £132,119 | £103,494 | £79,292 |
| 2019-04 | £129,207 | £220,019 | £132,848 | £104,143 | £79,013 |
| 2019-05 | £127,843 | £217,201 | £131,450 | £103,327 | £77,767 |
| 2019-06 | £126,273 | £214,070 | £129,785 | £102,249 | £76,977 |
| 2019-07 | £126,708 | £214,850 | £130,045 | £102,675 | £77,472 |
| 2019-08 | £129,546 | £220,012 | £132,797 | £105,054 | £78,745 |
| 2019-09 | £131,901 | £224,367 | £134,930 | £107,042 | £80,118 |
| 2019-10 | £131,401 | £222,948 | £134,900 | £106,538 | £79,680 |
| 2019-11 | £129,532 | £219,106 | £133,529 | £104,856 | £78,677 |
| 2019-12 | £128,605 | £217,086 | £132,905 | £104,068 | £77,980 |
| 2020-01 | £127,644 | £216,080 | £131,739 | £103,237 | £77,093 |
| 2020-02 | £127,309 | £215,880 | £131,151 | £102,975 | £77,030 |
| 2020-03 | £127,199 | £216,153 | £130,993 | £102,783 | £76,770 |
| 2020-04 | £130,006 | £220,704 | £134,022 | £105,111 | £78,079 |
| 2020-05 | £129,200 | £219,931 | £133,127 | £104,263 | £77,593 |
| 2020-06 | £129,602 | £219,814 | £133,823 | £104,762 | £77,541 |
| 2020-07 | £129,054 | £219,087 | £133,041 | £104,305 | £77,711 |
| 2020-08 | £130,371 | £220,768 | £134,681 | £105,492 | £77,946 |
| 2020-09 | £131,813 | £224,415 | £135,813 | £106,489 | £78,507 |
| 2020-10 | £131,688 | £224,356 | £135,715 | £106,406 | £77,893 |
| 2020-11 | £134,710 | £229,931 | £138,328 | £109,049 | £79,733 |
| 2020-12 | £136,807 | £233,354 | £140,258 | £111,025 | £80,787 |
| 2021-01 | £137,748 | £233,567 | £141,184 | £112,238 | £82,197 |
| 2021-02 | £138,099 | £232,765 | £141,637 | £112,867 | £83,291 |
| 2021-03 | £137,433 | £230,069 | £141,042 | £112,662 | £84,162 |
| 2021-04 | £137,487 | £230,251 | £140,947 | £112,800 | £84,131 |
| 2021-05 | £138,610 | £232,108 | £142,052 | £113,773 | £84,787 |
| 2021-06 | £142,699 | £238,125 | £146,062 | £117,627 | £87,333 |
| 2021-07 | £142,375 | £237,297 | £146,018 | £117,310 | £86,909 |
| 2021-08 | £142,224 | £237,342 | £145,996 | £117,057 | £86,362 |
| 2021-09 | £141,345 | £236,198 | £145,358 | £116,067 | £85,448 |
| 2021-10 | £141,784 | £238,514 | £145,476 | £116,061 | £85,496 |
| 2021-11 | £142,518 | £240,380 | £146,180 | £116,464 | £85,800 |
| 2021-12 | £141,339 | £239,586 | £144,764 | £115,239 | £84,671 |
| 2022-01 | £144,482 | £244,074 | £148,194 | £118,043 | £86,322 |
| 2022-02 | £146,264 | £246,318 | £150,167 | £119,634 | £87,709 |
| 2022-03 | £147,202 | £247,991 | £151,486 | £120,141 | £88,017 |
| 2022-04 | £146,918 | £247,161 | £151,064 | £120,144 | £87,811 |
| 2022-05 | £148,474 | £249,699 | £152,625 | £121,575 | £88,246 |
| 2022-06 | £150,752 | £252,597 | £154,894 | £123,813 | £89,792 |
| 2022-07 | £155,279 | £259,511 | £159,756 | £127,697 | £92,186 |
| 2022-08 | £156,512 | £261,645 | £160,854 | £128,884 | £92,536 |
| 2022-09 | £157,400 | £263,582 | £161,677 | £129,628 | £92,465 |
| 2022-10 | £158,057 | £265,436 | £162,258 | £129,965 | £92,770 |
| 2022-11 | £158,309 | £266,183 | £162,549 | £130,038 | £92,858 |
| 2022-12 | £158,097 | £265,778 | £162,373 | £129,813 | £92,919 |
| 2023-01 | £154,701 | £260,423 | £159,094 | £126,774 | £90,738 |
| 2023-02 | £154,065 | £259,511 | £158,638 | £126,000 | £90,456 |
| 2023-03 | £152,062 | £257,205 | £156,934 | £123,763 | £89,147 |
| 2023-04 | £150,586 | £255,143 | £155,398 | £122,432 | £88,392 |
| 2023-05 | £149,769 | £253,281 | £154,590 | £121,834 | £88,043 |
| 2023-06 | £151,139 | £254,780 | £155,625 | £123,441 | £88,699 |
| 2023-07 | £153,868 | £258,882 | £158,419 | £125,891 | £89,980 |
| 2023-08 | £155,001 | £260,831 | £159,433 | £127,030 | £90,157 |
| 2023-09 | £153,932 | £258,965 | £158,436 | £126,174 | £89,275 |
| 2023-10 | £156,499 | £262,900 | £161,000 | £128,362 | £91,009 |
| 2023-11 | £156,874 | £264,250 | £161,555 | £128,355 | £91,301 |
| 2023-12 | £159,694 | £268,908 | £164,476 | £130,582 | £93,309 |
| 2024-01 | £158,798 | £267,456 | £163,575 | £129,828 | £92,751 |
| 2024-02 | £156,727 | £262,729 | £161,528 | £128,419 | £91,553 |
| 2024-03 | £154,082 | £258,443 | £158,746 | £126,219 | £90,186 |
| 2024-04 | £152,298 | £254,354 | £156,872 | £125,015 | £89,588 |
| 2024-05 | £153,345 | £255,928 | £157,898 | £125,880 | £90,557 |
| 2024-06 | £155,979 | £259,195 | £160,574 | £128,436 | £92,011 |
| 2024-07 | £158,988 | £264,055 | £163,653 | £131,113 | £93,167 |
| 2024-08 | £160,346 | £266,127 | £164,826 | £132,558 | £93,460 |
| 2024-09 | £161,066 | £268,174 | £165,755 | £132,926 | £93,177 |
| 2024-10 | £161,891 | £270,235 | £166,495 | £133,446 | £93,763 |
| 2024-11 | £163,047 | £272,495 | £168,082 | £134,112 | £94,067 |
| 2024-12 | £165,028 | £276,310 | £170,033 | £135,710 | £94,954 |
| 2025-01 | £163,984 | £274,840 | £169,350 | £134,672 | £93,632 |
| 2025-02 | £165,473 | £277,304 | £170,818 | £135,970 | £94,559 |
| 2025-03 | £167,280 | £277,886 | £172,891 | £137,966 | £96,688 |
| 2025-04 | £164,290 | £273,780 | £169,981 | £135,128 | £94,633 |
| 2025-05 | £163,032 | £272,384 | £168,620 | £133,970 | £93,504 |
| 2025-06 | £160,941 | £270,666 | £166,404 | £131,858 | £91,232 |
| 2025-07 | £165,502 | £277,013 | £170,832 | £136,209 | £94,169 |
| 2025-08 | £165,899 | £276,878 | £171,353 | £136,766 | £94,315 |
| 2025-09 | £166,274 | £277,377 | £171,920 | £137,097 | £94,024 |
| 2025-10 | £167,658 | £279,904 | £173,607 | £138,091 | £94,241 |
| 2025-11 | £172,049 | £287,440 | £178,203 | £141,675 | £96,349 |
| 2025-12 | £172,409 | £287,808 | £178,567 | £142,078 | £96,490 |
| 2026-01 | £171,800 | £286,293 | £177,878 | £141,849 | £95,938 |
| 2026-02 | £170,259 | £283,739 | £176,455 | £140,477 | £94,829 |
| 2026-03 | £171,325 | £285,809 | £177,829 | £141,206 | £94,621 |
| 2026-04 | £172,555 | £288,141 | £179,350 | £141,973 | £95,058 |
| 2026-05 | £173,130 | £289,036 | £179,942 | £142,542 | £95,097 |
- All property types
- Detached
- Semi-detached
- Terraced
- Flats
Source: HM Land Registry House Price Index
| Year | All property types | Detached | Semi-detached | Terraced | Flats |
|---|---|---|---|---|---|
| 1996-01 | -2.6% | -2.2% | -1.5% | -3.6% | -4.0% |
| 1996-02 | -5.6% | -4.9% | -5.1% | -6.2% | -6.7% |
| 1996-03 | -7.1% | -6.1% | -6.5% | -8.1% | -8.2% |
| 1996-04 | -5.9% | -4.7% | -5.6% | -6.5% | -6.5% |
| 1996-05 | -5.4% | -4.2% | -5.2% | -6.1% | -5.5% |
| 1996-06 | -2.9% | -1.9% | -2.9% | -3.2% | -2.7% |
| 1996-07 | -2.7% | -1.7% | -2.7% | -3.1% | -2.8% |
| 1996-08 | +0.9% | +2.3% | +0.7% | +0.6% | 0.0% |
| 1996-09 | +0.2% | +1.4% | +0.1% | -0.3% | -0.4% |
| 1996-10 | +1.3% | +2.3% | +1.4% | +0.7% | +0.5% |
| 1996-11 | -0.4% | +0.3% | -0.4% | -0.8% | -1.5% |
| 1996-12 | -0.1% | +0.4% | -0.2% | 0.0% | -1.7% |
| 1997-01 | +2.3% | +3.0% | +1.7% | +2.7% | +0.3% |
| 1997-02 | +4.0% | +5.4% | +3.3% | +4.1% | +2.4% |
| 1997-03 | +5.1% | +6.7% | +3.9% | +5.3% | +3.4% |
| 1997-04 | +2.3% | +4.0% | +1.3% | +2.3% | +0.7% |
| 1997-05 | +1.9% | +3.1% | +1.3% | +2.0% | -0.7% |
| 1997-06 | +2.9% | +4.2% | +2.7% | +2.8% | -1.7% |
| 1997-07 | +6.2% | +7.6% | +5.9% | +6.3% | +0.7% |
| 1997-08 | +8.2% | +9.4% | +8.0% | +8.2% | +3.1% |
| 1997-09 | +7.1% | +8.1% | +7.0% | +7.1% | +3.0% |
| 1997-10 | +7.3% | +8.3% | +6.8% | +7.5% | +3.5% |
| 1997-11 | +9.4% | +10.9% | +8.6% | +9.6% | +5.1% |
| 1997-12 | +7.7% | +9.2% | +7.4% | +7.3% | +4.7% |
| 1998-01 | +4.9% | +6.6% | +5.0% | +4.1% | +3.1% |
| 1998-02 | +2.2% | +3.3% | +2.2% | +1.5% | +1.7% |
| 1998-03 | +6.4% | +7.4% | +6.3% | +6.1% | +5.4% |
| 1998-04 | +8.2% | +9.0% | +8.1% | +8.0% | +6.8% |
| 1998-05 | +6.8% | +7.7% | +6.9% | +6.3% | +5.8% |
| 1998-06 | +3.5% | +4.5% | +3.3% | +3.0% | +4.2% |
| 1998-07 | +2.1% | +2.9% | +2.0% | +1.4% | +3.9% |
| 1998-08 | +1.3% | +2.0% | +1.1% | +0.8% | +3.0% |
| 1998-09 | +4.2% | +5.1% | +3.9% | +3.8% | +5.8% |
| 1998-10 | +1.5% | +2.1% | +1.5% | +0.9% | +3.4% |
| 1998-11 | 0.0% | +0.6% | +0.3% | -0.9% | +2.4% |
| 1998-12 | 0.0% | +0.4% | +0.2% | -0.8% | +2.1% |
| 1999-01 | +3.3% | +3.8% | +3.0% | +3.1% | +3.8% |
| 1999-02 | +5.0% | +5.4% | +4.8% | +5.0% | +4.1% |
| 1999-03 | +0.5% | +0.8% | +0.6% | +0.2% | +0.7% |
| 1999-04 | -1.6% | -1.9% | -1.3% | -1.9% | -0.1% |
| 1999-05 | +2.3% | +2.1% | +2.1% | +2.4% | +4.4% |
| 1999-06 | +5.8% | +5.3% | +5.4% | +6.3% | +7.2% |
| 1999-07 | +5.7% | +5.8% | +5.0% | +6.2% | +6.6% |
| 1999-08 | +2.6% | +2.3% | +2.2% | +3.0% | +3.7% |
| 1999-09 | +0.5% | +0.5% | 0.0% | +0.8% | +1.2% |
| 1999-10 | +5.6% | +5.9% | +4.9% | +5.9% | +6.3% |
| 1999-11 | +5.7% | +5.8% | +4.9% | +6.2% | +6.4% |
| 1999-12 | +6.6% | +6.2% | +5.9% | +7.3% | +7.6% |
| 2000-01 | +3.8% | +3.0% | +3.9% | +4.2% | +4.8% |
| 2000-02 | +4.8% | +4.5% | +5.0% | +4.5% | +6.6% |
| 2000-03 | +4.9% | +5.4% | +4.9% | +4.5% | +5.4% |
| 2000-04 | +6.5% | +7.9% | +5.7% | +6.3% | +6.6% |
| 2000-05 | +4.0% | +5.5% | +3.3% | +3.6% | +3.9% |
| 2000-06 | +0.8% | +2.4% | +0.4% | 0.0% | +2.0% |
| 2000-07 | -0.3% | +1.2% | -0.2% | -1.6% | +1.2% |
| 2000-08 | +2.3% | +4.1% | +2.6% | +0.6% | +4.4% |
| 2000-09 | +4.4% | +6.0% | +5.0% | +2.6% | +6.4% |
| 2000-10 | +2.4% | +3.9% | +2.8% | +0.9% | +4.0% |
| 2000-11 | +1.6% | +3.2% | +1.9% | +0.1% | +2.4% |
| 2000-12 | +2.6% | +4.6% | +2.7% | +1.0% | +3.7% |
| 2001-01 | +4.4% | +6.4% | +4.3% | +2.9% | +6.7% |
| 2001-02 | +4.9% | +6.9% | +4.3% | +3.9% | +6.1% |
| 2001-03 | +5.7% | +7.4% | +5.0% | +5.0% | +6.7% |
| 2001-04 | +4.1% | +5.9% | +3.7% | +3.2% | +4.4% |
| 2001-05 | +1.2% | +2.2% | +1.4% | +0.3% | +2.5% |
| 2001-06 | +3.6% | +4.3% | +3.8% | +2.8% | +4.8% |
| 2001-07 | +4.0% | +3.7% | +4.4% | +3.7% | +5.4% |
| 2001-08 | +6.6% | +6.4% | +6.6% | +6.7% | +7.8% |
| 2001-09 | +4.3% | +4.3% | +3.9% | +4.3% | +6.2% |
| 2001-10 | +5.5% | +5.9% | +4.9% | +5.6% | +7.2% |
| 2001-11 | +4.3% | +4.6% | +3.8% | +4.4% | +6.1% |
| 2001-12 | +4.6% | +4.9% | +4.0% | +4.6% | +6.2% |
| 2002-01 | +4.7% | +5.4% | +3.9% | +4.7% | +5.9% |
| 2002-02 | +6.3% | +6.7% | +5.9% | +6.2% | +8.1% |
| 2002-03 | +7.3% | +7.1% | +7.2% | +7.2% | +9.2% |
| 2002-04 | +8.6% | +7.6% | +9.0% | +8.5% | +12.1% |
| 2002-05 | +14.2% | +13.5% | +14.6% | +14.1% | +17.6% |
| 2002-06 | +15.6% | +14.7% | +15.9% | +15.5% | +18.9% |
| 2002-07 | +19.1% | +18.9% | +18.8% | +19.2% | +21.2% |
| 2002-08 | +17.1% | +16.7% | +16.8% | +17.3% | +19.0% |
| 2002-09 | +19.6% | +19.0% | +19.7% | +19.7% | +20.7% |
| 2002-10 | +17.9% | +16.8% | +18.4% | +18.0% | +19.8% |
| 2002-11 | +18.7% | +17.9% | +19.0% | +18.7% | +21.5% |
| 2002-12 | +18.9% | +17.6% | +19.5% | +19.1% | +21.8% |
| 2003-01 | +21.4% | +19.1% | +22.1% | +22.0% | +24.1% |
| 2003-02 | +21.7% | +18.9% | +22.8% | +22.4% | +24.2% |
| 2003-03 | +23.1% | +21.0% | +23.7% | +23.7% | +26.0% |
| 2003-04 | +23.4% | +21.7% | +24.1% | +23.8% | +25.7% |
| 2003-05 | +25.8% | +24.2% | +26.2% | +26.3% | +27.1% |
| 2003-06 | +25.5% | +24.4% | +25.6% | +26.1% | +26.1% |
| 2003-07 | +24.8% | +22.8% | +25.5% | +25.3% | +26.8% |
| 2003-08 | +23.4% | +20.9% | +24.3% | +24.0% | +26.0% |
| 2003-09 | +24.0% | +20.5% | +25.3% | +25.1% | +27.1% |
| 2003-10 | +29.6% | +26.1% | +30.2% | +31.5% | +30.6% |
| 2003-11 | +33.2% | +28.7% | +34.2% | +35.3% | +34.0% |
| 2003-12 | +35.8% | +31.2% | +36.5% | +38.5% | +35.7% |
| 2004-01 | +31.7% | +27.7% | +32.2% | +33.9% | +33.2% |
| 2004-02 | +31.8% | +28.2% | +31.8% | +34.1% | +33.5% |
| 2004-03 | +29.6% | +25.6% | +29.7% | +31.8% | +32.0% |
| 2004-04 | +30.9% | +25.8% | +31.2% | +33.8% | +32.3% |
| 2004-05 | +28.6% | +22.8% | +27.9% | +32.6% | +29.0% |
| 2004-06 | +28.5% | +21.8% | +28.5% | +32.5% | +29.3% |
| 2004-07 | +34.6% | +27.9% | +33.6% | +39.3% | +34.2% |
| 2004-08 | +38.2% | +31.8% | +37.3% | +42.8% | +37.3% |
| 2004-09 | +38.5% | +33.0% | +36.9% | +43.2% | +37.2% |
| 2004-10 | +30.3% | +25.1% | +29.2% | +34.0% | +30.8% |
| 2004-11 | +29.6% | +24.6% | +28.2% | +33.4% | +29.6% |
| 2004-12 | +28.5% | +23.8% | +26.8% | +32.3% | +29.1% |
| 2005-01 | +27.3% | +22.6% | +25.9% | +30.9% | +27.5% |
| 2005-02 | +23.0% | +18.8% | +21.8% | +25.9% | +23.6% |
| 2005-03 | +22.9% | +19.0% | +22.5% | +25.4% | +22.3% |
| 2005-04 | +22.7% | +19.7% | +22.0% | +25.0% | +21.6% |
| 2005-05 | +21.0% | +19.0% | +21.0% | +22.1% | +21.0% |
| 2005-06 | +19.0% | +17.3% | +18.4% | +20.4% | +18.4% |
| 2005-07 | +13.5% | +12.2% | +13.2% | +14.5% | +13.5% |
| 2005-08 | +11.7% | +10.4% | +11.2% | +13.0% | +11.5% |
| 2005-09 | +8.9% | +7.7% | +8.5% | +9.8% | +9.9% |
| 2005-10 | +11.0% | +9.8% | +10.3% | +12.3% | +11.2% |
| 2005-11 | +9.6% | +8.5% | +8.9% | +10.9% | +10.1% |
| 2005-12 | +9.8% | +8.9% | +9.1% | +10.9% | +9.9% |
| 2006-01 | +10.9% | +9.7% | +10.4% | +12.2% | +10.6% |
| 2006-02 | +13.5% | +11.5% | +13.0% | +15.0% | +12.6% |
| 2006-03 | +11.8% | +9.9% | +11.1% | +13.3% | +11.2% |
| 2006-04 | +12.1% | +10.8% | +11.1% | +13.6% | +11.2% |
| 2006-05 | +11.1% | +10.0% | +10.3% | +12.6% | +9.6% |
| 2006-06 | +12.2% | +11.2% | +11.7% | +13.5% | +10.3% |
| 2006-07 | +11.5% | +10.3% | +11.0% | +13.0% | +9.4% |
| 2006-08 | +9.7% | +8.5% | +9.4% | +10.9% | +7.9% |
| 2006-09 | +11.6% | +10.4% | +11.2% | +12.9% | +8.8% |
| 2006-10 | +11.3% | +10.4% | +11.3% | +12.1% | +8.7% |
| 2006-11 | +12.3% | +11.6% | +12.2% | +13.1% | +8.9% |
| 2006-12 | +9.2% | +8.4% | +9.3% | +10.0% | +5.9% |
| 2007-01 | +9.1% | +8.4% | +9.2% | +10.1% | +5.5% |
| 2007-02 | +9.3% | +8.8% | +9.3% | +10.2% | +6.2% |
| 2007-03 | +10.7% | +9.7% | +10.6% | +11.8% | +7.5% |
| 2007-04 | +8.4% | +7.4% | +8.3% | +9.5% | +6.1% |
| 2007-05 | +6.8% | +5.3% | +6.5% | +8.0% | +5.3% |
| 2007-06 | +6.9% | +5.8% | +6.5% | +8.0% | +6.3% |
| 2007-07 | +6.4% | +5.5% | +6.2% | +7.1% | +6.4% |
| 2007-08 | +8.8% | +8.4% | +8.4% | +9.4% | +7.6% |
| 2007-09 | +7.5% | +7.1% | +7.2% | +8.2% | +6.1% |
| 2007-10 | +7.8% | +7.3% | +7.2% | +8.6% | +6.3% |
| 2007-11 | +5.6% | +5.1% | +5.3% | +6.3% | +5.2% |
| 2007-12 | +6.1% | +6.0% | +5.7% | +6.5% | +5.6% |
| 2008-01 | +5.0% | +5.5% | +4.4% | +5.4% | +4.3% |
| 2008-02 | +3.0% | +3.7% | +2.3% | +3.3% | +1.8% |
| 2008-03 | +1.1% | +1.6% | +0.6% | +1.5% | -0.4% |
| 2008-04 | +1.7% | +2.0% | +1.7% | +2.0% | -0.3% |
| 2008-05 | +2.6% | +2.8% | +2.8% | +2.8% | +0.3% |
| 2008-06 | +0.6% | +1.0% | +0.8% | +0.8% | -1.6% |
| 2008-07 | -0.8% | -0.3% | -0.7% | -0.7% | -3.2% |
| 2008-08 | -4.4% | -4.3% | -4.2% | -4.5% | -5.9% |
| 2008-09 | -6.2% | -5.8% | -5.8% | -6.4% | -7.1% |
| 2008-10 | -8.1% | -8.0% | -7.6% | -8.4% | -8.6% |
| 2008-11 | -9.1% | -8.9% | -8.5% | -9.5% | -9.6% |
| 2008-12 | -8.1% | -8.1% | -7.5% | -8.3% | -9.3% |
| 2009-01 | -9.4% | -9.2% | -8.9% | -9.8% | -10.3% |
| 2009-02 | -7.2% | -6.7% | -6.9% | -7.5% | -8.5% |
| 2009-03 | -9.4% | -8.6% | -9.4% | -10.0% | -9.2% |
| 2009-04 | -9.7% | -9.0% | -9.6% | -10.0% | -9.6% |
| 2009-05 | -12.2% | -11.3% | -12.2% | -12.6% | -12.0% |
| 2009-06 | -10.3% | -9.5% | -10.2% | -10.5% | -11.6% |
| 2009-07 | -9.0% | -8.0% | -9.1% | -9.1% | -10.6% |
| 2009-08 | -5.9% | -4.7% | -6.0% | -5.8% | -8.6% |
| 2009-09 | -2.8% | -2.2% | -2.8% | -2.5% | -5.7% |
| 2009-10 | +0.4% | +1.2% | +0.4% | +0.9% | -3.4% |
| 2009-11 | +2.9% | +3.7% | +2.8% | +3.5% | -0.8% |
| 2009-12 | +2.9% | +3.3% | +2.8% | +3.5% | -0.7% |
| 2010-01 | +3.5% | +3.9% | +3.7% | +4.1% | -1.0% |
| 2010-02 | +4.8% | +5.4% | +5.4% | +5.2% | -1.1% |
| 2010-03 | +6.8% | +8.2% | +7.3% | +7.0% | 0.0% |
| 2010-04 | +7.1% | +8.8% | +7.6% | +7.0% | +1.7% |
| 2010-05 | +6.2% | +7.6% | +6.6% | +6.1% | +2.2% |
| 2010-06 | +5.8% | +7.1% | +6.1% | +5.7% | +2.2% |
| 2010-07 | +5.1% | +6.3% | +5.3% | +5.0% | +1.5% |
| 2010-08 | +4.8% | +6.1% | +5.3% | +4.4% | +1.4% |
| 2010-09 | +1.8% | +3.3% | +2.3% | +1.1% | -1.5% |
| 2010-10 | +0.8% | +2.3% | +1.4% | +0.1% | -1.9% |
| 2010-11 | -1.0% | +0.5% | -0.5% | -1.7% | -4.1% |
| 2010-12 | +0.2% | +2.1% | +0.7% | -0.8% | -2.8% |
| 2011-01 | +0.8% | +2.7% | +1.1% | -0.1% | -2.2% |
| 2011-02 | -2.4% | -1.1% | -2.2% | -3.2% | -3.6% |
| 2011-03 | -4.5% | -3.6% | -4.3% | -5.0% | -5.4% |
| 2011-04 | -4.5% | -3.7% | -4.5% | -4.9% | -5.9% |
| 2011-05 | -2.4% | -1.4% | -2.1% | -2.9% | -4.6% |
| 2011-06 | -0.1% | +0.7% | +0.3% | -0.7% | -1.9% |
| 2011-07 | -1.7% | -1.4% | -1.0% | -2.2% | -3.0% |
| 2011-08 | -2.1% | -1.8% | -1.6% | -2.5% | -3.4% |
| 2011-09 | -4.8% | -4.5% | -4.4% | -5.0% | -6.4% |
| 2011-10 | -4.9% | -4.2% | -4.8% | -5.3% | -6.9% |
| 2011-11 | -4.2% | -3.5% | -4.0% | -4.6% | -5.8% |
| 2011-12 | -5.6% | -5.0% | -5.2% | -6.2% | -6.3% |
| 2012-01 | -6.4% | -6.3% | -5.7% | -7.0% | -6.9% |
| 2012-02 | -6.4% | -6.3% | -5.8% | -6.7% | -7.3% |
| 2012-03 | -1.2% | -1.7% | -0.9% | -0.9% | -3.2% |
| 2012-04 | -0.3% | -0.5% | -0.2% | 0.0% | -1.6% |
| 2012-05 | +1.9% | +1.9% | +1.8% | +2.3% | +0.1% |
| 2012-06 | -2.7% | -2.3% | -2.7% | -2.5% | -4.0% |
| 2012-07 | -2.6% | -2.3% | -2.7% | -2.3% | -4.2% |
| 2012-08 | -2.7% | -2.7% | -2.8% | -2.2% | -3.7% |
| 2012-09 | +0.9% | +0.5% | +0.9% | +1.4% | +0.2% |
| 2012-10 | -2.0% | -2.7% | -2.1% | -1.4% | -2.1% |
| 2012-11 | -1.1% | -1.7% | -1.2% | -0.3% | -2.3% |
| 2012-12 | -1.5% | -1.8% | -2.0% | -0.6% | -3.3% |
| 2013-01 | +1.3% | +1.1% | +0.9% | +2.2% | -0.5% |
| 2013-02 | -0.5% | -1.0% | -0.5% | -0.1% | -0.9% |
| 2013-03 | -1.6% | -1.8% | -1.3% | -1.9% | -1.4% |
| 2013-04 | -0.8% | -0.8% | -0.4% | -1.1% | -1.8% |
| 2013-05 | -2.6% | -2.5% | -2.2% | -2.9% | -3.5% |
| 2013-06 | -1.6% | -1.8% | -1.2% | -1.6% | -2.9% |
| 2013-07 | +0.7% | +0.6% | +0.8% | +0.7% | -0.5% |
| 2013-08 | +0.8% | +1.0% | +1.0% | +0.7% | -0.4% |
| 2013-09 | -0.2% | +0.1% | -0.1% | -0.4% | -1.4% |
| 2013-10 | +0.4% | +0.7% | +0.9% | 0.0% | -1.0% |
| 2013-11 | -1.0% | -0.8% | -0.3% | -1.7% | -1.8% |
| 2013-12 | +0.3% | 0.0% | +1.4% | -0.4% | -0.3% |
| 2014-01 | +2.6% | +2.4% | +3.4% | +2.1% | +2.0% |
| 2014-02 | +6.6% | +7.0% | +6.9% | +6.3% | +4.7% |
| 2014-03 | +6.2% | +6.9% | +6.2% | +6.0% | +3.9% |
| 2014-04 | +2.0% | +2.4% | +2.1% | +1.9% | +0.2% |
| 2014-05 | +2.5% | +2.5% | +2.8% | +2.5% | +1.1% |
| 2014-06 | +1.4% | +1.2% | +1.9% | +1.2% | +0.8% |
| 2014-07 | +2.6% | +2.4% | +3.2% | +2.3% | +1.7% |
| 2014-08 | +0.5% | +0.4% | +1.0% | +0.2% | -0.4% |
| 2014-09 | +3.6% | +3.5% | +3.9% | +3.5% | +2.7% |
| 2014-10 | +2.7% | +2.4% | +2.8% | +2.8% | +2.2% |
| 2014-11 | +5.0% | +4.6% | +5.1% | +5.2% | +4.6% |
| 2014-12 | +2.8% | +2.8% | +2.8% | +2.9% | +2.5% |
| 2015-01 | -0.2% | -0.2% | 0.0% | -0.4% | -0.3% |
| 2015-02 | -0.2% | -0.4% | +0.1% | -0.4% | +0.4% |
| 2015-03 | -2.0% | -2.1% | -1.6% | -2.3% | -0.7% |
| 2015-04 | +0.4% | +0.7% | +0.6% | 0.0% | +1.3% |
| 2015-05 | -2.0% | -1.3% | -1.8% | -2.6% | -1.9% |
| 2015-06 | +0.5% | +1.0% | +0.8% | +0.1% | -0.7% |
| 2015-07 | -1.2% | -0.9% | -0.7% | -1.7% | -1.7% |
| 2015-08 | +0.7% | +1.0% | +1.0% | +0.2% | +0.6% |
| 2015-09 | -0.4% | +0.2% | -0.1% | -1.2% | -0.3% |
| 2015-10 | +1.8% | +2.6% | +2.3% | +1.1% | +1.0% |
| 2015-11 | +2.1% | +2.8% | +2.7% | +1.5% | +0.3% |
| 2015-12 | +4.2% | +4.9% | +4.8% | +3.8% | +1.4% |
| 2016-01 | +4.4% | +5.1% | +4.9% | +4.1% | +1.6% |
| 2016-02 | +4.2% | +5.1% | +4.4% | +3.8% | +1.6% |
| 2016-03 | +6.6% | +7.3% | +6.8% | +6.5% | +4.2% |
| 2016-04 | +4.7% | +5.1% | +4.8% | +4.5% | +3.0% |
| 2016-05 | +5.1% | +5.1% | +5.3% | +5.1% | +4.0% |
| 2016-06 | +1.4% | +1.6% | +1.3% | +1.3% | +1.1% |
| 2016-07 | +3.0% | +3.3% | +2.9% | +3.0% | +2.5% |
| 2016-08 | +3.2% | +3.5% | +3.1% | +3.2% | +2.5% |
| 2016-09 | +4.2% | +4.0% | +4.5% | +4.2% | +3.1% |
| 2016-10 | +3.5% | +3.9% | +3.6% | +3.3% | +3.1% |
| 2016-11 | +2.4% | +3.3% | +2.3% | +1.9% | +2.6% |
| 2016-12 | +0.8% | +1.9% | +0.4% | +0.2% | +2.1% |
| 2017-01 | +2.4% | +3.6% | +2.0% | +1.8% | +3.7% |
| 2017-02 | +1.2% | +2.0% | +1.0% | +0.6% | +2.9% |
| 2017-03 | 0.0% | +0.8% | 0.0% | -0.8% | +1.1% |
| 2017-04 | +0.1% | +0.6% | +0.3% | -0.6% | +1.2% |
| 2017-05 | +1.7% | +2.5% | +1.9% | +0.9% | +2.3% |
| 2017-06 | +3.8% | +4.4% | +4.0% | +3.2% | +4.7% |
| 2017-07 | +3.1% | +3.8% | +3.3% | +2.4% | +3.9% |
| 2017-08 | +3.8% | +4.4% | +3.7% | +3.2% | +4.7% |
| 2017-09 | +3.0% | +3.7% | +2.9% | +2.4% | +4.2% |
| 2017-10 | +3.6% | +4.1% | +3.6% | +3.2% | +4.5% |
| 2017-11 | +3.5% | +3.2% | +3.8% | +3.3% | +4.1% |
| 2017-12 | +4.0% | +3.7% | +4.2% | +4.0% | +4.1% |
| 2018-01 | +1.9% | +1.4% | +2.3% | +1.8% | +2.1% |
| 2018-02 | +0.6% | +0.6% | +1.2% | +0.4% | -0.5% |
| 2018-03 | +1.9% | +1.8% | +2.5% | +1.8% | 0.0% |
| 2018-04 | +3.1% | +3.2% | +3.6% | +3.1% | +0.6% |
| 2018-05 | +3.2% | +3.6% | +3.5% | +3.3% | +0.6% |
| 2018-06 | +3.1% | +3.6% | +3.6% | +2.8% | +0.5% |
| 2018-07 | +2.4% | +3.3% | +2.8% | +2.0% | -0.2% |
| 2018-08 | +3.3% | +3.9% | +4.1% | +2.7% | +1.1% |
| 2018-09 | +2.0% | +2.6% | +2.5% | +1.5% | -0.6% |
| 2018-10 | +2.3% | +2.7% | +2.9% | +1.9% | 0.0% |
| 2018-11 | +0.2% | +0.8% | +0.5% | -0.2% | -1.9% |
| 2018-12 | -0.3% | -0.1% | +0.3% | -0.7% | -1.8% |
| 2019-01 | -0.4% | +0.1% | -0.1% | -0.9% | -1.8% |
| 2019-02 | +1.2% | +1.5% | +1.7% | +0.6% | +0.7% |
| 2019-03 | +1.4% | +1.7% | +1.9% | +0.7% | +0.8% |
| 2019-04 | +1.0% | +1.1% | +1.8% | +0.3% | +0.1% |
| 2019-05 | +0.3% | +0.2% | +1.1% | -0.2% | -0.7% |
| 2019-06 | -1.2% | -1.2% | -0.5% | -1.5% | -2.0% |
| 2019-07 | -1.3% | -1.6% | -0.8% | -1.5% | -1.9% |
| 2019-08 | -2.0% | -2.1% | -1.7% | -2.1% | -3.4% |
| 2019-09 | -0.2% | -0.4% | 0.0% | -0.1% | -1.1% |
| 2019-10 | -0.9% | -1.3% | -0.4% | -0.8% | -2.1% |
| 2019-11 | +0.1% | -0.7% | +1.0% | +0.3% | -0.9% |
| 2019-12 | +0.2% | -0.5% | +1.1% | +0.3% | -1.7% |
| 2020-01 | +0.4% | -0.2% | +1.1% | +0.6% | -2.0% |
| 2020-02 | -0.5% | -1.0% | -0.1% | -0.1% | -2.9% |
| 2020-03 | -1.2% | -1.7% | -0.9% | -0.7% | -3.2% |
| 2020-04 | +0.6% | +0.3% | +0.9% | +0.9% | -1.2% |
| 2020-05 | +1.1% | +1.3% | +1.3% | +0.9% | -0.2% |
| 2020-06 | +2.6% | +2.7% | +3.1% | +2.5% | +0.7% |
| 2020-07 | +1.9% | +2.0% | +2.3% | +1.6% | +0.3% |
| 2020-08 | +0.6% | +0.3% | +1.4% | +0.4% | -1.0% |
| 2020-09 | -0.1% | 0.0% | +0.7% | -0.5% | -2.0% |
| 2020-10 | +0.2% | +0.6% | +0.6% | -0.1% | -2.2% |
| 2020-11 | +4.0% | +4.9% | +3.6% | +4.0% | +1.3% |
| 2020-12 | +6.4% | +7.5% | +5.5% | +6.7% | +3.6% |
| 2021-01 | +7.9% | +8.1% | +7.2% | +8.7% | +6.6% |
| 2021-02 | +8.5% | +7.8% | +8.0% | +9.6% | +8.1% |
| 2021-03 | +8.0% | +6.4% | +7.7% | +9.6% | +9.6% |
| 2021-04 | +5.8% | +4.3% | +5.2% | +7.3% | +7.8% |
| 2021-05 | +7.3% | +5.5% | +6.7% | +9.1% | +9.3% |
| 2021-06 | +10.1% | +8.3% | +9.1% | +12.3% | +12.6% |
| 2021-07 | +10.3% | +8.3% | +9.8% | +12.5% | +11.8% |
| 2021-08 | +9.1% | +7.5% | +8.4% | +11.0% | +10.8% |
| 2021-09 | +7.2% | +5.3% | +7.0% | +9.0% | +8.8% |
| 2021-10 | +7.7% | +6.3% | +7.2% | +9.1% | +9.8% |
| 2021-11 | +5.8% | +4.5% | +5.7% | +6.8% | +7.6% |
| 2021-12 | +3.3% | +2.7% | +3.2% | +3.8% | +4.8% |
| 2022-01 | +4.9% | +4.5% | +5.0% | +5.2% | +5.0% |
| 2022-02 | +5.9% | +5.8% | +6.0% | +6.0% | +5.3% |
| 2022-03 | +7.1% | +7.8% | +7.4% | +6.6% | +4.6% |
| 2022-04 | +6.9% | +7.3% | +7.2% | +6.5% | +4.4% |
| 2022-05 | +7.1% | +7.6% | +7.4% | +6.9% | +4.1% |
| 2022-06 | +5.6% | +6.1% | +6.0% | +5.3% | +2.8% |
| 2022-07 | +9.1% | +9.4% | +9.4% | +8.9% | +6.1% |
| 2022-08 | +10.0% | +10.2% | +10.2% | +10.1% | +7.1% |
| 2022-09 | +11.4% | +11.6% | +11.2% | +11.7% | +8.2% |
| 2022-10 | +11.5% | +11.3% | +11.5% | +12.0% | +8.5% |
| 2022-11 | +11.1% | +10.7% | +11.2% | +11.7% | +8.2% |
| 2022-12 | +11.9% | +10.9% | +12.2% | +12.6% | +9.7% |
| 2023-01 | +7.1% | +6.7% | +7.4% | +7.4% | +5.1% |
| 2023-02 | +5.3% | +5.4% | +5.6% | +5.3% | +3.1% |
| 2023-03 | +3.3% | +3.7% | +3.6% | +3.0% | +1.3% |
| 2023-04 | +2.5% | +3.2% | +2.9% | +1.9% | +0.7% |
| 2023-05 | +0.9% | +1.4% | +1.3% | +0.2% | -0.2% |
| 2023-06 | +0.3% | +0.9% | +0.5% | -0.3% | -1.2% |
| 2023-07 | -0.9% | -0.2% | -0.8% | -1.4% | -2.4% |
| 2023-08 | -1.0% | -0.3% | -0.9% | -1.4% | -2.6% |
| 2023-09 | -2.2% | -1.8% | -2.0% | -2.7% | -3.5% |
| 2023-10 | -1.0% | -1.0% | -0.8% | -1.2% | -1.9% |
| 2023-11 | -0.9% | -0.7% | -0.6% | -1.3% | -1.7% |
| 2023-12 | +1.0% | +1.2% | +1.3% | +0.6% | +0.4% |
| 2024-01 | +2.6% | +2.7% | +2.8% | +2.4% | +2.2% |
| 2024-02 | +1.7% | +1.2% | +1.8% | +1.9% | +1.2% |
| 2024-03 | +1.3% | +0.5% | +1.2% | +2.0% | +1.2% |
| 2024-04 | +1.1% | -0.3% | +0.9% | +2.1% | +1.4% |
| 2024-05 | +2.4% | +1.0% | +2.1% | +3.3% | +2.9% |
| 2024-06 | +3.2% | +1.7% | +3.2% | +4.0% | +3.7% |
| 2024-07 | +3.3% | +2.0% | +3.3% | +4.1% | +3.5% |
| 2024-08 | +3.4% | +2.0% | +3.4% | +4.4% | +3.7% |
| 2024-09 | +4.6% | +3.6% | +4.6% | +5.4% | +4.4% |
| 2024-10 | +3.4% | +2.8% | +3.4% | +4.0% | +3.0% |
| 2024-11 | +3.9% | +3.1% | +4.0% | +4.5% | +3.0% |
| 2024-12 | +3.3% | +2.8% | +3.4% | +3.9% | +1.8% |
| 2025-01 | +3.3% | +2.8% | +3.5% | +3.7% | +0.9% |
| 2025-02 | +5.6% | +5.5% | +5.8% | +5.9% | +3.3% |
| 2025-03 | +8.6% | +7.5% | +8.9% | +9.3% | +7.2% |
| 2025-04 | +7.9% | +7.6% | +8.4% | +8.1% | +5.6% |
| 2025-05 | +6.3% | +6.4% | +6.8% | +6.4% | +3.3% |
| 2025-06 | +3.2% | +4.4% | +3.6% | +2.7% | -0.8% |
| 2025-07 | +4.1% | +4.9% | +4.4% | +3.9% | +1.1% |
| 2025-08 | +3.5% | +4.0% | +4.0% | +3.2% | +0.9% |
| 2025-09 | +3.2% | +3.4% | +3.7% | +3.1% | +0.9% |
| 2025-10 | +3.6% | +3.6% | +4.3% | +3.5% | +0.5% |
| 2025-11 | +5.5% | +5.5% | +6.0% | +5.6% | +2.4% |
| 2025-12 | +4.5% | +4.2% | +5.0% | +4.7% | +1.6% |
| 2026-01 | +4.8% | +4.2% | +5.0% | +5.3% | +2.5% |
| 2026-02 | +2.9% | +2.3% | +3.3% | +3.3% | +0.3% |
| 2026-03 | +2.4% | +2.9% | +2.9% | +2.3% | -2.1% |
| 2026-04 | +5.0% | +5.2% | +5.5% | +5.1% | +0.4% |
| 2026-05 | +6.2% | +6.1% | +6.7% | +6.4% | +1.7% |
What it costs to buy across the Lake District
Asking prices across the 14 postcodes with one on record run from £254,891 in Cockermouth to £489,899 in Ambleside, a spread of £235,008. A 30% deposit therefore ranges from roughly £76,467 to £146,970 depending on which valley you are in.
| Rank | Area | Asking Price |
|---|---|---|
| 1 | CA13 (Cockermouth) | £254,891 |
| 2 | CA20 (Gosforth, Wasdale) | £265,747 |
| 3 | CA11 (Penrith) | £287,578 |
| 4 | LA9 (Kendal) | £297,282 |
| 5 | LA7 (Milnthorpe) | £323,043 |
| 6 | LA12 (Ulverston) | £329,574 |
| 7 | CA10 (Askham, Bampton) | £331,755 |
| 8 | LA11 (Grange-over-Sands) | £332,778 |
| 9 | LA20 (Broughton) | £406,071 |
| 10 | LA8 (Crosthwaite, Lyth) | £406,206 |
| 11 | CA12 (Keswick) | £415,769 |
| 12 | LA23 (Windermere, Bowness) | £437,597 |
| 13 | LA21 (Coniston) | £450,357 |
| 14 | LA22 (Ambleside, Hawkshead) | £489,899 |
| — | CA19 (Eskdale, Drigg) | Not enough data |
The order is close to a map of the central fells. The cheapest entries sit on the western and northern edges, at Cockermouth and Gosforth. The dearest sit in the middle, around Ambleside, Coniston and Windermere. Penrith and Kendal, the two biggest towns, come in third and fourth cheapest despite being the places with the most going on. Cockermouth also carries the shortest queue of unsold homes in the guide, which is not a combination that usually turns up together. Few homes come to market here: the busiest postcode sells 32 a month and three sell three or fewer. Below market value property is one of the routes buyers use where open-market supply is limited.
Price per square foot
Measured by the square foot, which strips out how big the houses are, Ambleside costs £447 and Gosforth £199. It is the closest thing here to a like-for-like comparison, because it removes floor area from the difference and leaves location, condition and property type.
| Rank | Area | Price Per Sq Ft |
|---|---|---|
| 1 | CA20 (Gosforth, Wasdale) | £199 |
| 2 | CA11 (Penrith) | £236 |
| 3 | LA20 (Broughton) | £241 |
| 4 | CA13 (Cockermouth) | £249 |
| 5 | CA10 (Askham, Bampton) | £253 |
| 6 | LA12 (Ulverston) | £260 |
| 7 | LA11 (Grange-over-Sands) | £281 |
| 8 | LA7 (Milnthorpe) | £290 |
| 9 | LA9 (Kendal) | £303 |
| 10 | LA8 (Crosthwaite, Lyth) | £327 |
| 11 | CA12 (Keswick) | £371 |
| 12 | LA23 (Windermere, Bowness) | £374 |
| 13 | LA22 (Ambleside, Hawkshead) | £447 |
| — | CA19, LA21 | Not enough data |
Ambleside costs more than twice as much per square foot as Gosforth, and the two are about twenty miles apart. Kendal at £303 sits almost exactly in the middle of the range while being the busiest market in the guide.
House price growth
Over five years the strongest growth in the guide is Gosforth at 14.1%, and the weakest is Broughton at minus 16.0%. The pattern does not follow price. Several of the dearest postcodes have gone backwards.
| Area | 1 Year | 3 Years | 5 Years |
|---|---|---|---|
| CA20 (Gosforth, Wasdale) | 1.8% | 8.3% | 14.1% |
| LA9 (Kendal) | -6.1% | -1.0% | 10.6% |
| CA13 (Cockermouth) | 6.7% | 1.8% | 9.8% |
| LA8 (Crosthwaite, Lyth) | -2.9% | -2.5% | 8.2% |
| CA10 (Askham, Bampton) | -5.9% | -8.8% | 5.7% |
| LA12 (Ulverston) | -3.2% | -2.4% | 5.6% |
| CA12 (Keswick) | -8.3% | -10.9% | 3.1% |
| LA11 (Grange-over-Sands) | -2.7% | 0.7% | 1.9% |
| CA11 (Penrith) | -7.6% | -6.5% | -0.3% |
| LA22 (Ambleside, Hawkshead) | 0.5% | -17.2% | -2.8% |
| LA23 (Windermere, Bowness) | -10.5% | -8.4% | -2.8% |
| LA7 (Milnthorpe) | -19.1% | -18.2% | -7.6% |
| LA20 (Broughton) | Not enough data | -22.0% | -16.0% |
| CA19, LA21 | Not enough data | Not enough data | Not enough data |
Read the top and the bottom of that table together. Gosforth, Kendal and Cockermouth lead on five-year growth. Gosforth and Cockermouth are also among the cheapest places to buy space, at £199 and £249 per square foot, while Kendal sits in the middle at £303. Ambleside and Windermere are down 2.8% each, and they are the two dearest at £447 and £374. Whatever the premium in the central lakes has bought over the last five years, it has not been capital growth.
Keswick is worth separating from its neighbours over the five-year window. CA12, which covers Keswick and Braithwaite, is up 3.1% across those five years while Ambleside, Grasmere and Hawkshead in LA22 and Windermere and Bowness in LA23 are both down 2.8%. It also moves more: 9 sales a month against 3 in LA22, and monthly sales that come to 8% of the homes advertised against 2% in LA22 and 5% in LA23. The twelve-month column runs the other way, with CA12 down 8.3% and LA22 up 0.5%, so the five-year figure describes the longer direction rather than the current one. At £415,769 average asking against £489,899 in LA22, its monthly sales are a larger share of what is advertised than in either neighbour, on 9 sales a month.
Coniston sits apart again. LA21 carries an average asking price of £450,357, which puts it in the same bracket as Windermere, but its price per square foot, its per-postcode sales count and its growth figures are all unreported. Its unsold-stock figure comes from a separate demand measure that does carry one. That is an absence of measurement rather than a reading of zero, and it is the same thinness that runs through the yield table: too few transactions in the window for a figure to be published.
How much actually changes hands
Kendal sells 32 homes a month. Ambleside sells three. That gap is the practical difference between the two ends of this market: Ambleside records about as many sales in a year as Kendal records in a month. The middle column below shows each postcode's monthly sales as a share of the homes advertised for sale there, which is the cleaner way to compare a large town against a small village.
| Area | Sales Per Month | Stock Sold a Year | Asking Price |
|---|---|---|---|
| LA9 (Kendal) | 32 | 12% | £297,282 |
| CA11 (Penrith) | 24 | 10% | £287,578 |
| LA12 (Ulverston) | 21 | 7% | £329,574 |
| CA13 (Cockermouth) | 17 | 16% | £254,891 |
| CA10 (Askham, Bampton) | 13 | 8% | £331,755 |
| LA23 (Windermere, Bowness) | 10 | 5% | £437,597 |
| CA12 (Keswick) | 9 | 8% | £415,769 |
| LA7 (Milnthorpe) | 8 | 11% | £323,043 |
| LA11 (Grange-over-Sands) | 8 | 4% | £332,778 |
| CA20 (Gosforth, Wasdale) | 4 | 10% | £265,747 |
| LA8 (Crosthwaite, Lyth) | 3 | 2% | £406,206 |
| LA22 (Ambleside, Hawkshead) | 3 | 2% | £489,899 |
| LA20 (Broughton) | 2 | 10% | £406,071 |
| LA21 (Coniston) | Not enough data | Not enough data | £450,357 |
| CA19 (Eskdale, Drigg) | Not enough data | Not enough data | Not enough data |
What Type of Property Can You Buy in the Lake District?
Detached houses make up 70.9% of the stock in Broughton and 29.7% in Kendal. That range is the housing equivalent of the price table: the further into the fells you go, the more the stock becomes large detached property, and the fewer flats and terraces there are to buy at the cheaper end.
| Area | Detached | Semi-detached | Terraced | Flats |
|---|---|---|---|---|
| LA20 (Broughton) | 70.9% | 19.5% | 7.6% | 2.0% |
| CA19 (Eskdale, Drigg) | 67.5% | 22.7% | 9.1% | 0.7% |
| CA20 (Gosforth, Wasdale) | 66.0% | 20.0% | 6.8% | 6.6% |
| CA13 (Cockermouth) | 61.8% | 22.8% | 11.0% | 4.3% |
| CA11 (Penrith) | 61.0% | 25.1% | 7.7% | 4.7% |
| CA10 (Askham, Bampton) | 55.8% | 26.9% | 13.7% | 3.1% |
| LA8 (Crosthwaite, Lyth) | 55.7% | 28.5% | 10.5% | 4.2% |
| LA23 (Windermere, Bowness) | 51.9% | 26.6% | 9.3% | 11.7% |
| LA7 (Milnthorpe) | 49.7% | 27.2% | 17.8% | 4.0% |
| LA21 (Coniston) | 49.5% | 27.1% | 19.4% | 4.0% |
| LA11 (Grange-over-Sands) | 48.0% | 28.0% | 14.3% | 7.6% |
| LA12 (Ulverston) | 47.4% | 29.1% | 19.2% | 3.5% |
| CA12 (Keswick) | 45.2% | 27.4% | 20.8% | 5.5% |
| LA22 (Ambleside, Hawkshead) | 44.2% | 24.2% | 17.9% | 12.9% |
| LA9 (Kendal) | 29.7% | 34.8% | 20.9% | 14.2% |
Rows may not total 100%, as a small share of mobile and temporary dwellings is not shown. Kendal is the outlier and it is the useful one. It has the lowest detached share, the highest proportion of flats at 14.2% and the most semi-detached housing at 34.8%. It is also the one place here with both a calculable yield and thirty-plus sales a month. Ambleside and Windermere carry the next highest flat shares, at 12.9% and 11.7%, though the stock data records the property type only and not how any of it is used.
How much unsold stock is sitting in the Lake District
At the current rate of sale, Ambleside is carrying 33.3 months of unsold homes. Cockermouth is carrying 6.3. That is more than five times the overhang inside one guide.
Months of unsold stock is the for-sale pool divided by the rate at which homes are actually selling. It is not an observed selling time for any individual house. What it measures is the depth of the for-sale pool relative to the current rate of sale, so at Ambleside's three sales a month the pool itself represents about 33 months of supply.
A days-on-market figure is also published for these postcodes. Across all fifteen it is the months-of-stock figure expressed in days rather than an independently observed measure, so this guide uses months of stock and states what it counts.
| Area | Months of Unsold Stock | Market |
|---|---|---|
| CA13 (Cockermouth) | 6.3 | Balanced |
| LA9 (Kendal) | 7.7 | Balanced |
| CA11 (Penrith) | 8.3 | Balanced |
| LA7 (Milnthorpe) | 9.1 | Balanced |
| CA12 (Keswick) | 10.0 | Balanced |
| CA19 (Eskdale, Drigg) | 10.0 | Balanced |
| CA20 (Gosforth, Wasdale) | 10.0 | Balanced |
| LA21 (Coniston) | 12.5 | Buyer's market |
| LA12 (Ulverston) | 14.3 | Buyer's market |
| LA20 (Broughton) | 16.7 | Buyer's market |
| CA10 (Askham, Bampton) | 20.0 | Buyer's market |
| LA23 (Windermere, Bowness) | 20.0 | Buyer's market |
| LA11 (Grange-over-Sands) | 25.0 | Buyer's market |
| LA8 (Crosthwaite, Lyth) | 33.3 | Buyer's market |
| LA22 (Ambleside, Hawkshead) | 33.3 | Buyer's market |
The three smallest pools are Cockermouth, Kendal and Penrith, all working towns with an economy that is not mainly about visitors. The largest are Ambleside, Crosthwaite and Grange-over-Sands, each at 25 months or more against single-figure monthly sales.
The Lake District rental market
The postcodes with the most rented housing are the ones where no rental yield can be calculated at all. That sounds like a contradiction. It is the most useful thing in this guide.
How Big Is the Lake District's Private Rented Sector?
Windermere has the highest share of privately rented homes of any postcode here, at 31.0%. Ambleside is next at 27.4%, then Coniston at 23.1%. Kendal, the biggest and busiest market in the guide, has the third lowest at 14.6%.
| Area | Owned Outright | Owned with Mortgage | Private Rented | Social Rented |
|---|---|---|---|---|
| LA23 (Windermere, Bowness) | 44.0% | 13.6% | 31.0% | 11.1% |
| LA22 (Ambleside, Hawkshead) | 36.4% | 11.1% | 27.4% | 24.8% |
| LA21 (Coniston) | 45.7% | 13.6% | 23.1% | 17.6% |
| CA11 (Penrith) | 52.7% | 23.6% | 20.8% | 2.4% |
| CA10 (Askham, Bampton) | 51.0% | 21.9% | 20.2% | 6.4% |
| LA12 (Ulverston) | 50.5% | 25.4% | 19.2% | 4.5% |
| CA12 (Keswick) | 53.7% | 13.8% | 19.0% | 11.0% |
| LA7 (Milnthorpe) | 48.3% | 28.7% | 18.7% | 4.0% |
| CA13 (Cockermouth) | 55.4% | 22.6% | 18.2% | 3.4% |
| CA20 (Gosforth, Wasdale) | 51.7% | 23.3% | 18.2% | 6.3% |
| LA11 (Grange-over-Sands) | 51.1% | 22.5% | 17.9% | 8.3% |
| LA8 (Crosthwaite, Lyth) | 56.5% | 23.7% | 16.3% | 3.0% |
| LA9 (Kendal) | 45.6% | 29.6% | 14.6% | 9.1% |
| LA20 (Broughton) | 55.9% | 23.5% | 11.4% | 8.1% |
| CA19 (Eskdale, Drigg) | 65.8% | 19.8% | 9.3% | 4.5% |
Now put that beside the yields. The three postcodes that carry enough long-term rental listings to produce a yield figure are Kendal, Cockermouth and Ulverston, and their private rented shares sit at the lower end of the range, at 14.6%, 18.2% and 19.2%. Windermere and Ambleside, at 31.0% and 27.4%, produce nothing. The area with the most rented housing is the area where the long-term rental market is hardest to see.
There is an explanation that fits, and it is the one the Lake District is known for. A privately rented home in Windermere is not necessarily let to somebody who lives there. The census counts the tenure; it does not ask how long the tenancy runs. The national park authority is explicit about the problem in its own planning policy, and its Windermere Gateway proposals for 200 to 250 homes at Orrest Head Farm specify that they would be secured for permanent occupancy, not second homes or holiday lets.
This page cannot tell you what any individual owner in Windermere is doing, and does not try to. What the data supports is narrower and still useful: the long-term rental stock visible on the open market in the central lakes is very thin, and the overall private rented share is not. If you are looking at short lets, our guide to the best place to buy a holiday let covers the national picture, while a separate walkthrough explains buying a holiday let.
What Tenants Actually Pay
Measured across the whole council area, private rents in June 2026 averaged £808 a month in Westmorland and Furness and £670 in Cumberland. These are figures for rent being paid, published by the ONS, and they are a different measure from the advertised rents behind the yield table below. Both are useful, but they answer different questions and should not be read as one number.
| Property Size | Westmorland and Furness | Cumberland |
|---|---|---|
| One bedroom | £598 | £499 |
| Two bedrooms | £765 | £632 |
| Three bedrooms | £933 | £772 |
| Four or more bedrooms | £1,310 | £1,076 |
| All properties | £808 | £670 |
Rents rose 6.3% in Westmorland and Furness and 6.7% in Cumberland over the year to June 2026. For comparison, the North West average was £961 and England £1,446, so both councils sit below their region as well as the country.
Is Lake District Rent High?
Measured against local pay, rent takes 23.2% of gross median earnings in Westmorland and Furness and 18.9% in Cumberland. Both are under a quarter of gross pay. Two figures sit behind that ratio: median pay of £41,859 and £42,461, which is higher than the rural setting might suggest, and average rents of £808 and £670, which are below both the North West and England averages.
The median gross annual salary is £41,859 across Westmorland and Furness, which works out at £3,488 a month before tax, against an average rent of £808. In Cumberland the median is £42,461, or £3,538 a month, against £670. Both figures come from the Nomis Labour Market Profile using ASHE 2025 data, and the rents are the ONS measured figures for June 2026.
What that ratio hides is which homes those rents are attached to. It is calculated at authority level, and both authorities include large populations well outside the national park, in Barrow, Workington and Carlisle. The rent a tenant would actually pay for a two-bedroom flat in Bowness is not in that average.
Where a Yield Can Be Calculated
Three postcodes have enough advertised lettings to produce a gross yield: Cockermouth at 3.9%, Ulverston at 3.5% and Kendal at 3.3%. These use advertised asking rents against advertised asking prices, so they are a different basis from the ONS figures above.
All three are gateway towns rather than lakeside villages. For the other twelve postcodes the figure is not low, it is absent. That distinction matters the moment you set this area against the best buy-to-let areas elsewhere in the country, because you would be comparing a number against a blank.
Local Housing Allowance Rates in the Lake District
Local Housing Allowance caps how much rent a tenant on housing support can have covered. Eligible rent is the lower of the actual rent or the allowance rate, so the rate is a ceiling on what the benefit meets rather than a floor under what landlords charge. The Lake District straddles two allowance areas, and they are not close. In the Kendal area the 2026 two-bedroom rate is £149.59 a week; in West Cumbria it is £109.32. Three-bedroom rates run £178.36 and £126.58. Quoting one figure for the whole national park would be wrong by about a third. You can check the current rate for any specific address on the VOA Local Housing Allowance calculator.
Buy-to-let considerations
Deposit requirements
At 30% down, deposits across the guide run from £76,467 in Cockermouth to £146,970 in Ambleside. The £70,503 difference between those two is more than the total deposit on a house in plenty of northern towns.
| Rank | Area | 30% Deposit Required |
|---|---|---|
| 1 | CA13 (Cockermouth) | £76,467 |
| 2 | CA20 (Gosforth, Wasdale) | £79,724 |
| 3 | CA11 (Penrith) | £86,273 |
| 4 | LA9 (Kendal) | £89,185 |
| 5 | LA7 (Milnthorpe) | £96,913 |
| 6 | LA12 (Ulverston) | £98,872 |
| 7 | CA10 (Askham, Bampton) | £99,527 |
| 8 | LA11 (Grange-over-Sands) | £99,833 |
| 9 | LA20 (Broughton) | £121,821 |
| 10 | LA8 (Crosthwaite, Lyth) | £121,862 |
| 11 | CA12 (Keswick) | £124,731 |
| 12 | LA23 (Windermere, Bowness) | £131,279 |
| 13 | LA21 (Coniston) | £135,107 |
| 14 | LA22 (Ambleside, Hawkshead) | £146,970 |
| — | CA19 (Eskdale, Drigg) | Not enough data |
Stamp duty on a second property is charged on top of that, and these are England rates, so the stamp duty calculator applies across the whole area. The standard running costs are set out in buy-to-let costs. Several things here sit outside that standard list and are worth checking property by property: Kendal's flood history and what it means for insurance, the age and exposure of stock in the fell villages, winter access on the higher roads, and any occupancy condition attached to a property inside the national park.
The second home council tax premium
Both councils charge a 100% council tax premium on second homes, which takes the bill to 200% of the standard charge. Cumberland applies it to furnished property that is no one's sole or main residence, with 200% payable from 1 April 2025. Westmorland and Furness began charging on the same date and defines a second home as a property that is furnished but not used as someone's sole or main residence.
The wording is what matters. A home occupied by a long-term tenant is that tenant's sole or main residence, so the premium does not reach a standard buy-to-let. What it is aimed at is furnished property that stands empty between owner visits. Property run as a genuine holiday-let business sits under a different assessment again, which buying a holiday let covers rather than this guide. For a buy-to-let in this area the point is the narrow one: this is a cost of holding a second home, not of letting a property to a tenant, and it does not appear anywhere in the yield tables above.
Supply, planning and why so little comes up
Development inside a national park is tightly controlled. The biggest housing proposal in the central lakes is the Windermere Gateway scheme, 200 to 250 homes at Orrest Head Farm. It is not proceeding on its original timetable: after Westmorland and Furness Council decided not to go ahead with the Homes England grant funding agreement, the national park authority states the highways programme cannot progress in its current form and the housing application timelines are under review.
Two other funded projects in the area are infrastructure rather than housing. The Kendal Flood Risk Management Scheme is a multi-phase Environment Agency programme running through the town after more than 2,276 properties suffered significant impacts in Storm Desmond in 2015, with Phase 1 drawing £5.34 million of European Regional Development Fund money. In Penrith, the council has approved a plan for the town hall with an outline budget of £5.740 million, subject to the full business case. Members also agreed not to take forward the Eden Enterprise Hub, and up to £2.03 million of the funding originally allocated to it will support other regeneration priorities in Penrith and Eden.
Kendal is both the busiest market in this guide and the town with the defences going in, so the scheme covers the postcode with the most transactions in the area.
Because so much of the private rented stock in the central lakes is not on the long-term market, buyers looking at this area on short-let terms are usually shopping a different set of properties. Those come through holiday lets for sale and Airbnb property for sale rather than the standard rental listings the yield figures above are drawn from.
What the Lake District data tells buy-to-let investors
The measurable long-term rental market in this area is in the gateway towns, and over the last five years the dearest central-lakes postcodes have recorded negative growth alongside deep pools of unsold stock. The three postcodes with a calculable yield are Cockermouth, Ulverston and Kendal. The four busiest markets are Kendal, Penrith, Ulverston and Cockermouth. The shortest queues of unsold stock are Cockermouth at 6.3 months, Kendal at 7.7 and Penrith at 8.3. Those are three different lists, and the gateway towns are what they have in common.
The central lakes look different on every measure. Ambleside and Windermere are the dearest space per square foot at £447 and £374, they are down 2.8% each over five years, they sell three and ten homes a month, and they carry 33.3 and 20.0 months of unsold stock respectively. They also have the highest private rented shares in the guide, at 27.4% and 31.0%, with no calculable long-term yield behind either.
At council level the same split shows up. Cumberland is cheaper, up 24.9% over five years and at a record high in the latest month on record, May 2026. Westmorland and Furness is dearer, up 15.2%, and still £2,327 below its November 2024 peak.
None of that says where to buy. It says the two halves of this area behave differently enough that a figure from one tells you very little about the other. If you are weighing whether buy-to-let is worth it here, the honest starting point is that the usual yield comparison mostly cannot be run. On the measures that are available, growth, liquidity and price per square foot, the working towns and the central lakes read differently, and the figures for each are in the tables above. The same figures sit behind investment property elsewhere and behind building a wider property portfolio, and they are the ones to compare against when weighing this area with anywhere else.
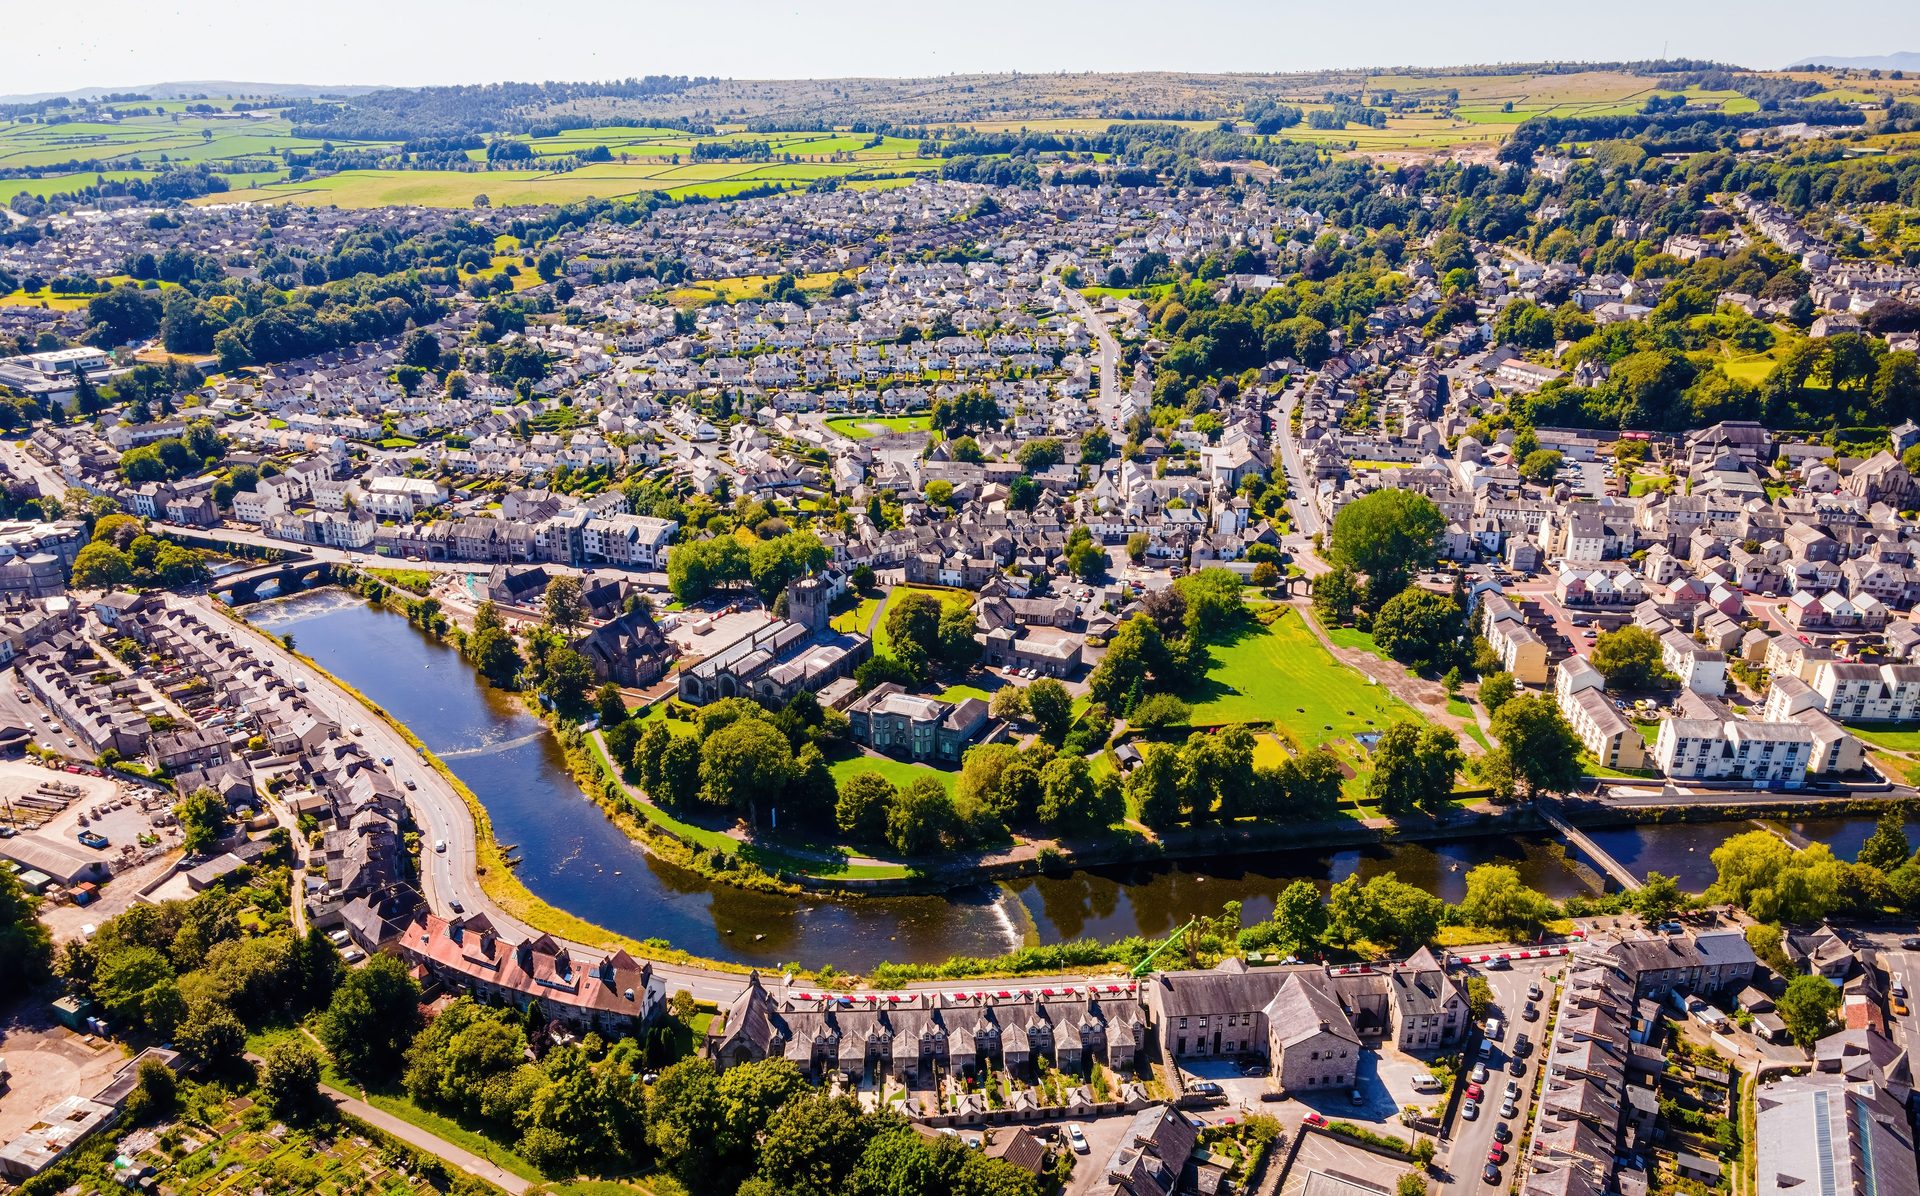
How the Lake District compares
Set against the nearest towns with their own guides, the Lake District is second dearest of the six and last on yield.
| Location | Mean Asking Price | Top Yield |
|---|---|---|
| Blackpool | £203,741 | 6.5% |
| Preston | £254,452 | 6.1% |
| Lancaster | £282,106 | 5.3% |
| Carlisle | £284,807 | 5.6% |
| Lake District | £359,182 | 3.9% |
| York | £369,455 | 5.2% |
The Lake District sits second dearest of the six and last on yield, and its 3.9% comes from a single postcode rather than a spread. Lancaster is the closest comparison geographically, immediately south and sharing the LA postcode area, at £282,106 with a 5.3% top yield. Carlisle sits in the same council as the northern lakes at £284,807 and 5.6%. Both are roughly £75,000 cheaper than the Lake District average with a yield that can actually be calculated across multiple postcodes.
So the trade is visible in the numbers. Buying here costs more and gives up the measurable income comparison, and what it buys sits inside a national park boundary, where development is tightly controlled. Those are different figures to weigh rather than better or worse ones. Yields across the wider North West are set out in buy-to-let property for sale.
Frequently Asked Questions
What is the average property price in the Lake District?
That depends on whether you mean what sellers are asking or what buyers actually paid, and the two are a long way apart here. Across the 14 postcodes with an asking price on record the average is £359,182, from £254,891 in Cockermouth up to £489,899 in Ambleside. Sold prices, which are the better guide to value, averaged £227,987 across Westmorland and Furness and £173,130 across Cumberland in May 2026. The two councils split the national park between them, so there is no single sold-price figure for the Lake District as such.
Why do most Lake District postcodes have no rental yield figure?
There are too few homes advertised to let long term for a reliable figure to be calculated. Twelve of the fifteen postcodes here fall below that threshold. It is a gap in the measurement rather than a low return, and the two are easy to confuse. Rents are certainly being paid, the ONS records £808 a month across Westmorland and Furness and £670 across Cumberland, but the open market in long lets is very thin.
Where are the highest yields in the Lake District?
Of the three postcodes with a calculable figure, Cockermouth leads at 3.9%, then Ulverston at 3.5% and Kendal at 3.3%. All three are gateway towns with their own local economies rather than lakeside villages. No yield can be calculated for Windermere, Ambleside, Coniston or Keswick.
How hard is it to sell a property in the Lake District?
No observed selling time is published for postcodes this thin. What can be measured is the size of the for-sale pool relative to the rate of sale. Cockermouth carries 6.3 months of it and Kendal 7.7. Ambleside and Crosthwaite both carry 33.3 months against three sales a month. The gap between the smallest and largest pool here is wider than the gap in asking price.
Is the Lake District expensive compared with nearby towns?
Yes, and on both measures at once. Average asking of £359,182 sits around £75,000 above Lancaster and Carlisle, while the calculable top yield of 3.9% is the lowest of the six areas compared above. Per square foot the range runs from £199 in Gosforth to £447 in Ambleside.
Which parts of the Lake District have grown most in value?
Not the postcodes most people would name first. Over five years Gosforth is up 14.1%, Kendal 10.6% and Cockermouth 9.8%, while Ambleside and Windermere are both down 2.8% and Milnthorpe down 7.6%. Growth has run against price here, with the cheaper working towns ahead of the premium villages.
How much deposit do I need to buy in the Lake District?
A 30% deposit runs from about £76,467 in Cockermouth to £146,970 in Ambleside, with stamp duty on an additional property charged on top at England rates. The timeline matters as much as the cash here. Several postcodes here record three or fewer sales a month, so fewer properties reach the market in a year than in a single month of a city market.
What type of property can you buy in the Lake District?
Detached houses dominate nearly everywhere, ranging from 70.9% of the stock in Broughton down to 29.7% in Kendal, with the fell postcodes weighted heaviest towards large detached property. Flats are scarce almost everywhere, at under 5% in nine of the fifteen postcodes, with the largest shares in Kendal at 14.2%, Ambleside at 12.9% and Windermere at 11.7%. If you are looking for a smaller, cheaper unit to let, the choice is concentrated in those three postcodes.
How do you buy an investment property in the Lake District?
The same way as anywhere, with two practical differences. Stock is thin: several postcodes here record only two or three sales a month. The for-sale pool is deep too: Ambleside carries 33.3 months of unsold stock against three sales a month. A 30% deposit runs from £76,467 to £146,970 depending on the postcode, with stamp duty on an additional property charged on top at England rates. Off-market and below market value routes are the ones buyers use where so little reaches the open market.
Can I buy a holiday let in the Lake District?
The tenure data points that way without settling it. Private rented shares in Windermere at 31.0% and Ambleside at 27.4% are the highest in the guide, despite no long-term yield being calculable in either. That pattern is consistent with a sizeable short-let market, though the tenure data records only that a home is privately rented, not how long the tenancy runs. One scheme points the other way: the national park's proposed Windermere Gateway homes are specified for permanent occupancy rather than second homes or holiday lets. That condition attaches to that development, not to the area as a whole.
Ready to buy property?
Browse investment properties with prices and gross yields shown for each opportunity.
Get property alerts