Where to Buy Property Investments in Bicester: Yields of 4.1%
Bicester is a market town in Oxfordshire, 15 miles northeast of Oxford on the M40 corridor with direct trains to London Marylebone. The town's top gross rental yield is 4.1% in OX26, the only one of its three postcodes with current rental data. Average sold prices across the Cherwell district sit 21.7% above the England average, and the district's population grew 13.5% to 161,016 between the 2011 and 2021 censuses.
Cherwell's average sold price of £355,186 places Bicester in a different bracket from most buy-to-let locations in this series. This is a premium South East market where prices exceed the national average rather than sit below it. That position reflects Oxford proximity, direct rail links to London Marylebone, and the draw of Bicester Village as one of the UK's most visited retail destinations. Rental data is limited to 1 of 3 postcodes, which narrows the investment picture but makes the analysis more focused. Investors looking for buy-to-let property in this part of the South East will find the postcode-level data below covers what is available.
This guide covers all 3 Bicester postcodes (OX25, OX26, OX27) under the Cherwell district council (ONS code E07000177). Cherwell includes Bicester, Banbury, Kidlington, and the surrounding rural parishes, so Land Registry sold prices are reported at the district level rather than for Bicester alone. Investors comparing options in the region may also consider Oxford, Milton Keynes, Reading, Swindon, or High Wycombe. Browse all our South East location guides.
Article updated: March 2026
Bicester Buy-to-Let Market Overview 2026
Bicester is a premium South East market town sitting above the England average for sold prices, with limited but focused rental data in the town centre postcode.
- Average sold price: £355,186 (21.7% above England's £291,865)
- Asking price range: £399,639 (OX26) to £487,827 (OX25)
- Rental yields: 4.1% in OX26, the only postcode with rental data
- Rental income: £1,377 per month in OX26
- Price per sq ft: Sold prices from £376/sq ft (OX25) to £407/sq ft (OX26)
- Market activity: Sales ranging from 8 per month (OX27) to 44 per month (OX26)
- Deposit requirements: 30% deposits range from £119,892 (OX26) to £146,348 (OX25)
- Affordability ratios: Property prices from 9.8 to 12.0 times Cherwell's median annual salary of £40,742
Contents

-
by Robert Jones, Founder of Property Investments UK
With two decades in UK property, Rob has been investing in buy-to-let since 2005, and uses property data to develop tools for property market analysis.

Property Data Sources
Our location guide relies on diverse, authoritative datasets including:
- HM Land Registry UK House Price Index
- Ministry of Housing, Communities and Local Government
- Ordnance Survey Data Hub
- Propertydata.co.uk
We update our property data quarterly to ensure accuracy. Last update: March 2026. All data is presented as provided by our sources without adjustments or amendments.
Why Invest in Bicester?
Cherwell's population grew 13.5% between censuses (141,868 to 161,016), more than double England's 6.6% average, and the district's employment rate of 84.0% sits well above the national 75.4%. Bicester's investment case rests on location and connectivity rather than cheap entry prices. The town sits on the M40 corridor, with direct trains to London Marylebone in under an hour. That combination of Oxford proximity and London commuter access puts Bicester in a structural demand bracket that most market towns cannot match.
Bicester Village draws over 7 million visitors per year, making it one of the UK's most visited retail destinations outside central London. The shopping village and its associated hospitality sector are a major local employer. Beyond retail, Bicester Motion is developing the former RAF Bicester site into a technology and innovation campus, with YASA (a Mercedes-Benz Group company) building its new headquarters there.
Between the 2011 and 2021 censuses, the Cherwell district population grew from 141,868 to 161,016, a rise of 13.5%. That is well above the England average of 6.6% and reflects Bicester's position in the Oxford-Cambridge Arc growth corridor. The NW Bicester eco-town development alone has planning consent for 6,000 homes, which will add significant population over the coming decades.
Earnings in Cherwell sit above the Great Britain median but below the South East regional average. The median annual salary is £40,742, compared to £42,390 across the South East and £39,863 for Great Britain. Higher local wages support property prices and rental affordability, but the South East premium means Cherwell workers are not among the region's top earners.
The employment picture is strong. Cherwell's employment rate of 84.0% is above the Great Britain average of 75.4%. Unemployment stands at 2.9%, well below the national 4.3%. The combination of low unemployment and above-average earnings creates a tenant base that landlords in lower-wage locations do not have.
Bicester Economic Summary
- Population: 161,016 (2021 Census). Growth of 13.5% from 2011. Cherwell district figure.
- Median annual salary: £40,742 (Cherwell), £42,390 (South East), £39,863 (Great Britain)
- Employment rate: 84.0% (Cherwell), 79.5% (South East), 75.4% (Great Britain)
- Unemployment rate: 2.9% (Cherwell), 3.1% (South East), 4.3% (Great Britain)
- Key employment sectors: Retail and hospitality (Bicester Village), automotive technology (Bicester Motion), logistics and distribution (M40 corridor), professional services
Source: ONS Census 2021, Nomis Labour Market Profile (ASHE 2025, Employment Oct 2024-Sep 2025)
Regeneration and Investment in Bicester
Three major projects are reshaping Bicester: a £26.8m technology campus at the former RAF base, planning consent for 6,000 eco-town homes, and a £5.1m town centre regeneration. Investment is driven by the town's position in the Oxford-Cambridge Arc and its transition from a traditional market town to a technology and innovation hub.
- Bicester Motion (under construction, £26.8m funding secured): The former RAF Bicester airfield is being transformed into an innovation campus for automotive and mobility technology. YASA, owned by Mercedes-Benz Group, is relocating its 400-strong team to a new headquarters at Phase 1, with practical completion targeted for 2025 and four further buildings in Phase 2. Updates at Oxfordshire LEP.
- NW Bicester Eco Town (planning approved, 6,000 homes): One of four government-designated eco-towns, NW Bicester is a zero-carbon development on 1,000 acres to the northwest of the town. Firethorn has planning consent for the next phase of 392 homes including 142 affordable units. The full masterplan includes 40% green space, three local centres, and a country park. Updates at Oxfordshire Live.
- Bicester Market Square Regeneration (approved, £5.1m): Cherwell District Council's town centre transformation includes redesigned public space, improved pedestrian access, and infrastructure for events and markets. Technical studies and detailed design are underway with construction targeted for summer 2026. Updates at Cherwell District Council.

Bicester Property Market Analysis
When Was the Last House Price Crash in Bicester?
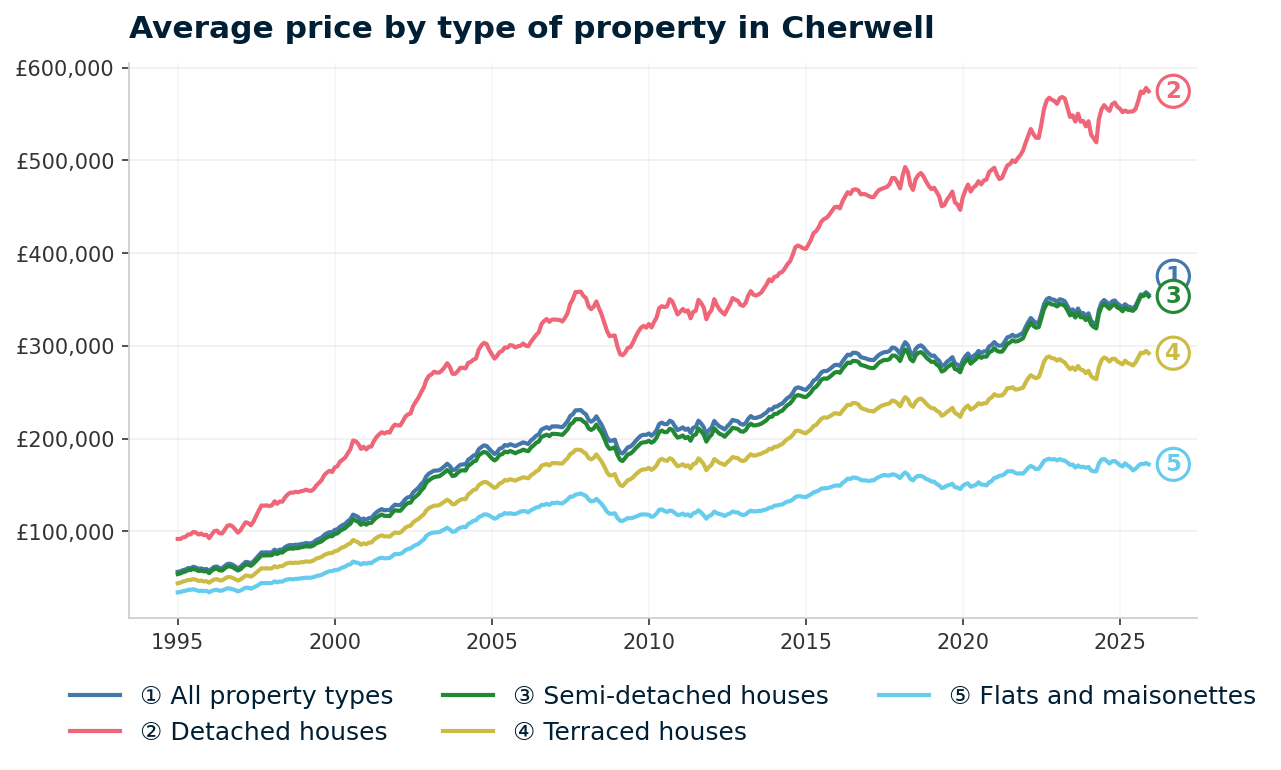
Cherwell property prices fell 20.3% from their November 2007 peak of £230,850 to a March 2009 trough of £184,043, and took 6 years to recover. All sold prices come from the HM Land Registry House Price Index, reported at district level. The data runs from January 1995 to December 2025.
- 1995-2000 (Early growth): Cherwell started 1995 at £56,569. Growth was slow initially. By January 1996, prices had barely moved to £57,308 (annual change +1.3%). The late 1990s saw acceleration, with annual change hitting 25.3% by January 1998. Prices reached £101,688 by January 2000, nearly doubling in five years.
- 2000-2007 (The boom): Prices more than doubled again. Annual change peaked at 26.5% in January 2003. By January 2005, the average had reached £186,095. Growth continued at a more moderate pace through 2006-2007. Prices peaked at £230,850 in November 2007, up 308.1% from January 1995. Cheap credit, limited housing supply, and the South East's structural demand all played a role.
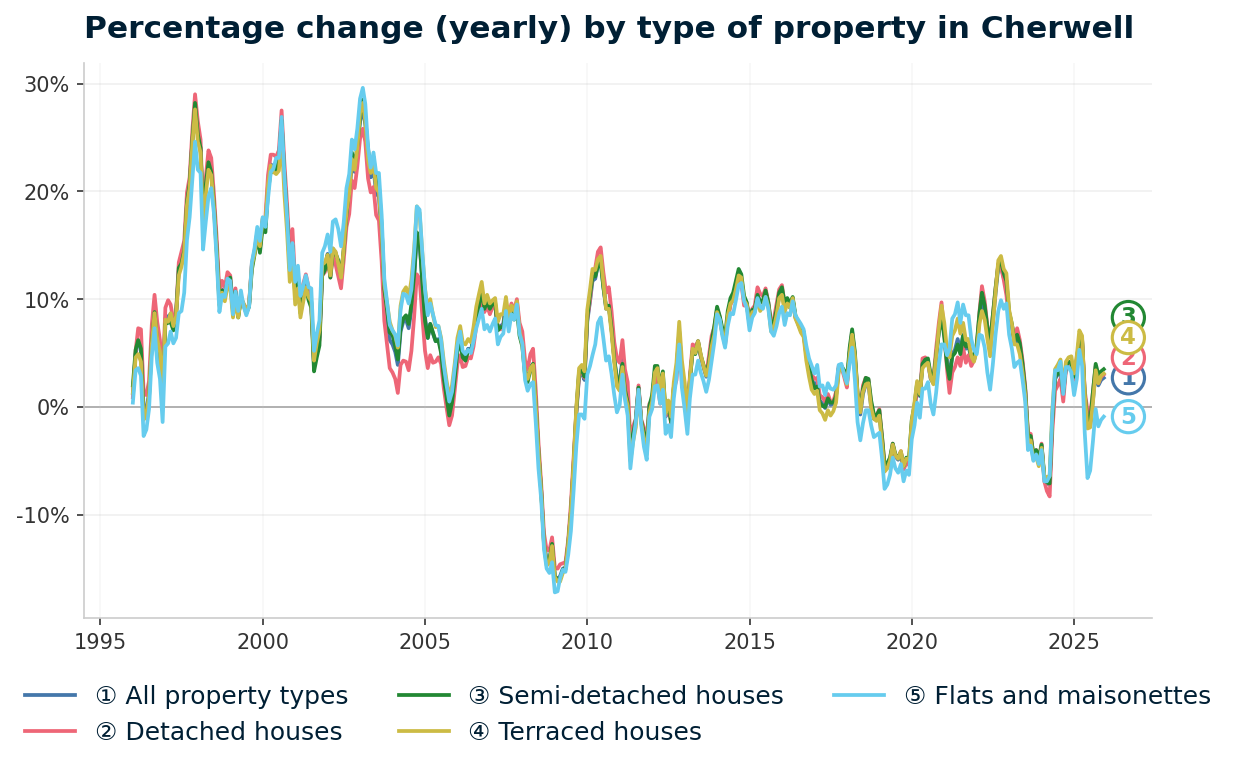
- 2007-2009 (The financial crisis): From the peak of £230,850 in November 2007 to the trough of £184,043 in March 2009, Cherwell lost 20.3% of its value in 16 months. The worst annual change reading was -16.0% in February 2009. By property type, flats fell hardest (-21.0%), followed by terraced (-20.7%), semi-detached (-20.4%), and detached (-19.1%). Cherwell's decline of 20.3% was slightly worse than England overall (-18.2%) and close to the South East regional decline (-20.0%).
- 2009-2013 (Recovery): Cherwell bounced quickly. By June 2010, prices had recovered to £217,370. Growth then moderated through 2011-2012, with prices settling around £210,000-£215,000. Annual change stayed low but positive. Prices first passed the pre-crash peak of £230,850 in November 2013 at £231,744. That recovery took 6 years from the peak and 4 years and 8 months from the trough. Faster than many northern cities, reflecting the South East's deeper demand base.
- 2014-2016 (Strong growth): Annual change hit 9.0% in January 2014 and accelerated to 10.7% by January 2016. Prices reached £279,671 by that point. The Help to Buy scheme and continued low interest rates drove the South East housing market hard during this period.
- 2017-2019 (Pre-pandemic correction): Growth stalled and turned negative. By January 2017, prices were £285,230 with annual growth of just 2.0%. By December 2019, prices had actually fallen to £276,643 with annual change at -5.2%. This correction was more pronounced in Cherwell than in many locations and likely reflected Brexit uncertainty hitting the commuter belt harder than urban centres.
- 2020-2022 (Pandemic surge): The stamp duty holiday and the remote working shift reversed the decline sharply. From £291,884 in March 2020, prices surged to £349,719 by December 2022. That is 19.8% growth in under three years. Bicester's appeal as a commuter town with space and green surroundings benefited directly from changed working patterns.
- 2023 (Rate shock): Interest rate rises cooled the market. Prices fell from £349,719 in December 2022 to £332,153 by December 2023. A decline of 5.0%. More pronounced than the 2023 dip nationally, consistent with the South East pattern of sharper corrections in premium markets.
- 2024-2025 (Recovery): Prices stabilised and grew again. By December 2025, the average reached £355,186 with annual growth of 2.7%. Cherwell now sits 53.9% above its pre-crash peak of November 2007.
Long-Term Property Value Growth in Cherwell
- 5 years (2020-2025): +18.0% (£301,107 to £355,186)
- 10 years (2015-2025): +27.1% (£279,360 to £355,186)
- 15 years (2010-2025): +69.7% (£209,332 to £355,186)
- 20 years (2005-2025): +82.4% (£194,677 to £355,186)
- 30 years (1995-2025): +496.3% (£59,562 to £355,186)
The 2008 crash is the reference point for assessing downside risk. A 20.3% decline took 6 years to recover. The pre-pandemic correction of 2017-2019 showed that even a premium location can lose value when sentiment shifts. The difference today is structural: the Oxford-Cambridge Arc designation, Bicester Motion, NW Bicester eco-town, and improved rail connections all strengthen the demand base compared to the 2007 market.
Source: HM Land Registry House Price Index for Cherwell, January 1995 to December 2025.
Thinking of Buying?
We have off-market investment properties averaging 8%+ annual yield.
View Property DealsSold House Prices in Bicester
Bicester is one of the few locations in this series where sold prices sit above the national average. Cherwell's average sold price of £355,186 is 21.7% above England's £291,865 and 6.2% below the South East regional average of £378,800. That positions Bicester as expensive by national standards but relatively affordable within the South East.
The spread across property types reveals a striking exception. Every house type sits above the England average, but flats do not.
| Property Type | Cherwell Average | England Average | Difference |
|---|---|---|---|
| Detached houses | £574,504 | £471,667 | +21.8% |
| Semi-detached houses | £353,441 | £289,135 | +22.2% |
| Terraced houses | £292,180 | £244,830 | +19.3% |
| Flats and maisonettes | £172,368 | £219,340 | -21.4% |
| All property types | £355,186 | £291,865 | +21.7% |
Semi-detached houses show the largest premium at +22.2% above England. Semis are the core family housing stock in Bicester's residential areas and the surrounding villages. The premium reflects consistent demand from families commuting to Oxford, London, and the M40 corridor employment centres.
Detached houses at £574,504 sit 21.8% above England but 15.5% below the South East average of £679,828. Cherwell's detached stock sits 15.5% below the South East average despite being 21.8% above England. That regional discount is distinctive for a district with direct Oxford and London rail links. These are not typical buy-to-let purchases, but the gap positions Cherwell within the wider South East context.
Terraced houses at £292,180 carry the smallest premium at +19.3%. Terraced stock in Bicester town centre forms the more affordable end of the local market and is the property type most likely to appeal to buy-to-let investors. Annual growth for terraced properties is +3.1%, the second strongest behind semis.
Flats are the outlier. At £172,368, they sit 21.4% below the England average of £219,340. This is the only property type in Cherwell that is cheaper than the national figure. Annual change for flats is -0.9%, the only type in negative territory. The flat market in a rural district like Cherwell lacks the density and urban demand that supports flat prices in city centres. That discount puts flats well below the headline Cherwell average, though the negative growth trend is part of the picture. Browse renovation properties in the South East.
Property Data Sources
Our location guide relies on diverse, authoritative datasets including:
- HM Land Registry UK House Price Index
- Ministry of Housing, Communities and Local Government
- Ordnance Survey Data Hub
- Propertydata.co.uk
We update our property data quarterly to ensure accuracy. Last update: March 2026. All data is presented as provided by our sources without adjustments or amendments.
Price Per Square Foot in Bicester
Bicester's price per square foot ranges from £376 in OX25 to £407 in OX26, a spread of just £31 across three postcodes. Price per square foot strips out the size bias in average asking prices. A postcode might look cheaper simply because it has smaller properties. This measure uses transaction data rather than listing estimates.
That narrow range tells you per-foot land values across the Bicester area are broadly similar, with variation driven more by property size than by location within the district. Most locations in this series show wider spreads.
| Rank | Area | Price Per Sq Ft |
|---|---|---|
| 1 | OX25 (Upper Heyford, Ambrosden) | £376 |
| 2 | OX27 (Fringford, Stratton Audley) | £383 |
| 3 | OX26 (Bicester Town Centre) | £407 |
OX26 at £407 per square foot is the most expensive space in the Bicester area. The town centre postcode commands a premium because smaller properties (terraced houses and flats) dominate the housing mix. Smaller properties typically cost more per foot than larger detached homes in rural postcodes.
OX25 at £376 and OX27 at £383 are nearly identical. Both are predominantly rural postcodes with larger properties on larger plots. The similar per-foot values confirm that these villages and hamlets trade at comparable rates. OX25 includes Upper Heyford, where the former USAF base has been redeveloped into a mixed residential community, while OX27 covers Fringford and Stratton Audley.
Figures reflect averages across all property types and ages. Individual values depend on condition, location within the postcode, and building age.
Houses for Sale: Asking Prices in Bicester
Bicester's asking prices range from £399,639 in OX26 to £487,827 in OX25, with the mean across all three postcodes at £449,912. Asking prices are not the same as sold prices. In a premium market like Bicester, sellers test the upper range of what the market will bear, so asking prices can sit significantly above completed transaction values.
| Rank | Area | Average Asking Price |
|---|---|---|
| 1 | OX26 (Bicester Town Centre) | £399,639 |
| 2 | OX27 (Fringford, Stratton Audley) | £462,271 |
| 3 | OX25 (Upper Heyford, Ambrosden) | £487,827 |
OX26 at £399,639 is the only postcode below £400,000. It is also the only postcode with rental data, making it the only postcode where yield can be calculated from live rental data. The gap between OX26 and OX27 is £62,632. That additional cost buys rural character and larger properties but removes access to the rental market data that buy-to-let decisions depend on.
OX25 at £487,827 is the most expensive entry point. Upper Heyford's redevelopment and the surrounding Oxfordshire villages carry asking prices that reflect lifestyle demand from Oxford commuters rather than rental investment logic. At these prices with no rental data, buy-to-let investors are working blind on income projections. Monitoring repossessed houses for sale in the area could surface opportunities below these asking price averages.
The mean asking price across all three Bicester postcodes is £449,912. That figure appears in the comparison section below, where Bicester is measured against Oxford, Milton Keynes, Reading, and Swindon. The gap between OX26's asking price and the district's average sold price suggests scope for negotiation in the town centre. Browse below market value properties in the South East.

House Price Growth in Bicester
Five-year growth ranges from +13.0% in OX25 to -3.8% in OX27, with OX26 returning +6.2%. One-year growth can swing on a handful of transactions in a low-volume market like Bicester's rural postcodes, so the five-year figure captures a more complete cycle.
OX26 is the only postcode growing over one year at +4.0%, while OX25 (-1.2%) and OX27 (-6.6%) are both contracting. The divergence between postcodes is sharper than you would expect from three adjacent areas.
| Area | 1 Year | 3 Years | 5 Years |
|---|---|---|---|
| OX25 (Upper Heyford, Ambrosden) | -1.2% | +6.4% | +13.0% |
| OX26 (Bicester Town Centre) | +4.0% | -5.0% | +6.2% |
| OX27 (Fringford, Stratton Audley) | -6.6% | +0.6% | -3.8% |
OX26 shows a distinctive pattern: negative three-year growth (-5.0%) but positive one-year (+4.0%) and five-year (+6.2%). That shape tells you prices surged during the pandemic stamp duty period, corrected in 2023 when interest rates rose, and are now recovering. The recent upward trend is a stronger signal than the three-year number suggests.
OX25 had the strongest five-year performance at +13.0% but is now falling (-1.2% over one year). Upper Heyford's new-build premium may be correcting. New developments often see asking prices adjusted downward as the initial marketing premium fades and resale values establish themselves.
OX27 at -3.8% over five years is the weakest performer. With only 8 sales per month, a handful of lower-value transactions can drag the average down disproportionately. Rural Oxfordshire villages like Fringford are driven by a narrow buyer pool, and when that pool contracts, prices move more sharply than in higher-volume areas.
Monthly Property Sales in Bicester
Bicester's combined monthly sales total 62 across all three postcodes, with OX26 accounting for 44 of those (71% of all transactions). Transaction volumes matter because they determine your exit strategy. If you need to sell, the question is how liquid is the market.
OX26 is the only postcode with enough liquidity for investors to buy and sell with reasonable confidence. The rural postcodes operate in a different market entirely.
| Area | Sales Per Month | Turnover | Asking Price |
|---|---|---|---|
| OX26 (Bicester Town Centre) | 44 | 34% | £399,639 |
| OX25 (Upper Heyford, Ambrosden) | 10 | 11% | £487,827 |
| OX27 (Fringford, Stratton Audley) | 8 | 62% | £462,271 |
OX27's turnover rate of 62% looks high, but the absolute volume of 8 sales per month puts it in context. A small pool of available stock means that when properties list, they sell quickly. But for an investor planning an exit, 8 transactions per month means limited buyer competition. Pricing needs to be right.
OX25's turnover of 11% is the lowest in Bicester. With 10 sales per month, this is a market where properties sit. Upper Heyford's new-build development adds stock, but the surrounding villages have few transactions. An investor buying here needs a long time horizon and acceptance that selling may take months rather than weeks.
OX26 at 44 sales per month is the only postcode with genuine liquidity. A turnover rate of 34% means roughly a third of available stock sells each month. For a market town, that is healthy. It provides the exit route that the other two postcodes lack.
Property Data Sources
Our location guide relies on diverse, authoritative datasets including:
- HM Land Registry UK House Price Index
- Ministry of Housing, Communities and Local Government
- Ordnance Survey Data Hub
- Propertydata.co.uk
We update our property data quarterly to ensure accuracy. Last update: March 2026. All data is presented as provided by our sources without adjustments or amendments.
Bicester Rental Market Analysis
The data below covers average monthly rent and gross rental yield for Bicester postcodes where data is available. Read more on whether rental property is a worthwhile investment.
Rental data is available for 1 of 3 postcodes. OX25 (Upper Heyford, Ambrosden) and OX27 (Fringford, Stratton Audley) have insufficient current listings for reliable rental figures. OX26 (Bicester Town Centre) shows a monthly rent of £1,377 and a gross yield of 4.1%. If you are looking to build a property portfolio in the South East, Bicester's town centre postcode offers the rental data to make an informed decision.
Average Rent & Gross Rental Yields in Bicester
OX26 delivers Bicester's only measurable gross yield at 4.1%, where monthly rents of £1,377 meet asking prices of £399,639. Gross rental yield does not account for void periods, maintenance, management fees, or mortgage costs. It is a starting point for comparison, not a profit forecast.
A 4.1% gross yield is modest compared to higher-yielding locations further from London, but reflects the trade-off in premium South East markets: lower yields come with stronger tenant quality and more reliable capital growth. OX25 and OX27 have insufficient current listings for reliable rental figures.
| Area | Average Monthly Rent | Average Asking Price | Gross Yield |
|---|---|---|---|
| OX26 (Bicester Town Centre) | £1,377 | £399,639 | 4.1% |
| OX25 (Upper Heyford, Ambrosden) | Not enough data | £487,827 | Not enough data |
| OX27 (Fringford, Stratton Audley) | Not enough data | £462,271 | Not enough data |
The absence of rental data for OX25 and OX27 is itself informative. Both are rural postcodes where the private rental market is thin. Properties in Upper Heyford and the surrounding villages are predominantly owner-occupied. This does not mean they are impossible to let, but it does mean there are not enough current rental listings to produce reliable average figures.
OX26's yield of 4.1% is below the 5% threshold that many income-focused investors target. For context, the South East as a whole tends to produce lower yields than the Midlands or the North because property prices are higher relative to rents. Bicester's yield is typical for a commuter town in this region. The investment case here leans toward capital appreciation supported by structural demand rather than immediate income generation.
Is Bicester Rent High?
OX26 rent of £1,377 per month represents 40.6% of the local median gross monthly salary of £3,395. That is above the 30% benchmark where affordability starts to stretch. Areas where rent consumes a lower share of income tend to produce more reliable tenants and fewer arrears.
The median gross weekly salary in Cherwell is £783.50, which equates to £3,395 per month or £40,742 per year. This is below the South East regional median of £815.20 per week and above the Great Britain median of £766.60 per week. Data from the Nomis Labour Market Profile (ASHE 2025).
| Rank | Area | Rent as % of Income |
|---|---|---|
| 1 | OX26 (Bicester Town Centre) | 40.6% |
| — | OX25 (Upper Heyford, Ambrosden) | Not enough data |
| — | OX27 (Fringford, Stratton Audley) | Not enough data |
The 40.6% figure looks stretched, but context matters. The median salary is a district-wide figure that includes lower-paid rural workers across Cherwell. Tenants in Bicester town centre, particularly those commuting to Oxford or London, typically earn above the district median. Professional renters choosing Bicester for its transport links and quality of life are not paying 40% of their own income on rent.
For landlords, the key takeaway is that Bicester tenants tend to be drawn from a higher-earning segment of the local workforce. The affordability ratio calculated against district-wide earnings overstates the financial stretch for the actual tenant base in OX26.
Thinking of Buying?
We have off-market investment properties averaging 8%+ annual yield.
View Property DealsBuy-to-Let Considerations
Are Bicester House Prices High? Price-to-Earnings Ratios
Every Bicester postcode exceeds the national price-to-earnings benchmark of 7.3x, with ratios ranging from 9.8x in OX26 to 12.0x in OX25. The national benchmark uses England's average sold price of £291,865 against Great Britain's median annual salary of £39,863.
Based on the Cherwell median gross annual income of £40,742 (Nomis Labour Market Profile), purchasing a property in Bicester requires between 9.8 and 12.0 times the local median salary. OX26 at 9.8x is the most affordable entry point, while OX25 at 12.0x is the most stretched. This is a characteristic of South East markets where the question is not whether prices are affordable in absolute terms, but whether structural demand supports these price levels over time.
| Rank | Area | Price-to-Earnings Ratio |
|---|---|---|
| 1 | OX26 (Bicester Town Centre) | 9.8x |
| 2 | OX27 (Fringford, Stratton Audley) | 11.3x |
| 3 | OX25 (Upper Heyford, Ambrosden) | 12.0x |
OX26 at 9.8x is the best entry point by this measure. It requires the lowest multiple of local income and is the only postcode with rental data to verify income projections. The 2.2x gap between OX26 (9.8x) and OX25 (12.0x) represents roughly £90,000 in additional capital required for the rural postcode, without the rental data to verify returns.
The uniform stretch above 7.3x across all three postcodes tells a clear story about market type. Bicester is not a value market. Investors here are buying into a location premium backed by transport, employment, and proximity to Oxford. That premium has held through two corrections (2017-2019 and 2023) and recovered both times.
Deposit Requirements in Bicester
At 30%, Bicester's deposits range from £119,892 in OX26 to £146,348 in OX25, with no sub-£100,000 entry point. Most buy-to-let mortgage lenders require a minimum 25% deposit, but 30% typically unlocks better interest rates. In a market where yields sit below 5%, those rate savings matter for cash flow.
The lowest deposit still exceeds what many northern cities require for a full property purchase. This is the price of a South East commuter location. Bicester's capital commitment is significant across the board compared to northern cities.
| Rank | Area | 30% Deposit Required |
|---|---|---|
| 1 | OX26 (Bicester Town Centre) | £119,892 |
| 2 | OX27 (Fringford, Stratton Audley) | £138,681 |
| 3 | OX25 (Upper Heyford, Ambrosden) | £146,348 |
The £26,456 gap between OX26 and OX25 deposits buys a fundamentally different investment profile. OX26 at £119,892 delivers the only verified yield data (4.1%), the highest sales volume (44/month), and the strongest recent growth (+4.0% one-year). OX25 at £146,348 has no rental data, declining prices over one year, and a fraction of the liquidity.
All three deposits sit in a narrow band between £120,000 and £146,000. That uniformity reflects Bicester's nature as a market town rather than a city with wide postcode variation. There is no cheap entry point for budget investors. The capital commitment is significant across the board.
Deposit is only part of the upfront cost. Budget for stamp duty (use our stamp duty calculator for an accurate figure), legal fees, and survey costs. For a full breakdown, see our guide to buy-to-let costs. Investors exploring lower-capital routes may also want to read about investment property with no deposit options.
What the Bicester Data Tells Buy-to-Let Investors
OX26 (Bicester Town Centre) is the only postcode where the data is fully available for a buy-to-let decision. It has the lowest asking price (£399,639), the only rental data (£1,377/month, 4.1% yield), the strongest recent growth (+4.0% one-year), and 71% of the area's monthly transactions. Every metric points to OX26 as the entry point for rental investors in Bicester.
The 4.1% gross yield positions Bicester as a capital growth play rather than an income play. Investors buying here are not targeting cash flow from day one. They are positioning in a South East commuter town where structural demand from Oxford, London commuters, and Bicester Village employment supports long-term price appreciation. The 18.0% five-year growth in Cherwell's Land Registry data provides evidence for that thesis.
OX25 and OX27 present a different picture entirely. Both postcodes have no rental data, asking prices above £460,000, and mixed growth records. OX27 shows negative five-year growth of -3.8%. OX25 shows positive five-year growth (+13.0%) but is now contracting (-1.2% one-year). Both have sales volumes of 10 or fewer per month.
The data does not support income-focused buy-to-let in these postcodes. They are rural owner-occupier markets where investment property purchases would require bespoke local research beyond what postcode averages reveal.
Investors considering Bicester alongside higher-yielding off-market property options elsewhere in the UK face a clear trade-off: lower yield and higher capital commitment, in exchange for location quality and structural demand that most higher-yielding locations cannot match.
How Bicester Buy-to-Let Compares to Nearby Areas
Bicester's top yield of 4.1% is the lowest in this five-location comparison, sitting 2.6 percentage points below Milton Keynes (6.7%) and 1.2 points below Swindon (5.3%). The table below compares Bicester against four nearby areas using the same methodology: mean asking price across all postcodes, mean monthly rent across postcodes with data, and top single-postcode gross yield.
| Location | Mean Asking Price | Mean Monthly Rent | Top Gross Yield |
|---|---|---|---|
| Bicester | £449,912 | £1,377 | 4.1% |
| Swindon | £332,719 | £1,145 | 5.3% |
| Milton Keynes | £388,510 | £1,384 | 6.7% |
| Reading | £415,265 | £1,603 | 6.1% |
| Oxford | £518,350 | £1,776 | 5.4% |
The yield gap reflects two factors: Bicester's higher asking prices and limited rental data (one postcode vs multiple postcodes in the comparison cities). Bicester's mean asking price of £449,912 sits between Reading (£415,265) and Oxford (£518,350), but its single-postcode rental data makes direct yield comparisons less complete.
Milton Keynes offers a compelling alternative with a top yield of 6.7% at a lower mean asking price of £388,510. Similar commuter credentials, new town infrastructure, and a larger rental market make Milton Keynes the strongest yield competitor nearby. Reading at 6.1% yield and £415,265 mean asking price is another option with deeper rental data.
Oxford at £518,350 shows where Bicester's premium positioning is heading. Oxford commands higher rents (£1,776) and a higher yield (5.4%) despite being the most expensive in the group. That gap reflects Oxford's university demand, which creates a density of rental activity that Bicester's market town profile cannot match. Swindon at £332,719 is the value entry point in this comparison.
See our guide to the best buy-to-let locations in the UK.
Frequently Asked Questions
How does Bicester compare to Oxford for buy-to-let?
Oxford has higher top yields (5.4% vs 4.1%), higher absolute rents (£1,776 vs £1,377 mean), and rental demand driven by its universities. Bicester has a lower mean asking price (£449,912 vs Oxford's £518,350), making the 30% deposit roughly £21,000 less. Bicester has direct London rail access; Oxford's service requires a change or is slower. Both sit in the same regional economy. Oxford's rental market has broader data coverage across more postcodes. Bicester's data is concentrated across three postcodes.
Are there property investment companies operating in Bicester?
Several firms market buy-to-let properties in the Bicester area, particularly targeting London-based investors attracted by the commuter credentials. The data in this guide covers the open market. Any property sold through an investment company can be benchmarked against these postcode-level figures. The figures are averages and do not reflect the value of any individual property.
Does Bicester Village affect local property prices?
Bicester Village draws over 7 million visitors per year and employs thousands in retail and hospitality. That employment base is concentrated in OX26, where hospitality workers, retail managers, and logistics staff live. The shopping village also raises Bicester's national profile. OX26 records 44 of Bicester's 62 monthly sales and has the only postcode with published rental data.
What is the Oxford-Cambridge Arc and how does it affect Bicester?
The Oxford-Cambridge Arc is a government-backed growth corridor spanning from Oxford through Milton Keynes to Cambridge, aiming to deliver up to 1 million new homes and significant infrastructure investment. Bicester sits at the western end. The NW Bicester eco-town (6,000 homes) and Bicester Motion technology campus are both part of this growth strategy.
The Arc designation involves long-term public investment in transport, employment, and housing supply. The timeline is measured in decades rather than years. East West Rail, which will eventually connect Oxford to Cambridge via Bicester, is the largest infrastructure project directly affecting the town.
Can I find buy-to-let property in Bicester under £300,000?
Yes, individual flats and smaller terraced houses in OX26 do list below £300,000. Cherwell's average flat price of £172,368 from the Land Registry confirms that more affordable stock exists at the district level. At that price point, a 30% deposit would be under £90,000.
Flats are the only property type in Cherwell currently losing value (-0.9% annual change) based on historic recent growth charts. Sub-£300,000 stock typically means flats or smaller terraced houses, where lease length, service charges, and building condition all affect the numbers.
How many houses for sale are there in Bicester and what do they cost?
Bicester averages 62 property sales per month across its three postcodes. OX26 (Bicester Town Centre) accounts for 44 of those (71%). Average asking prices range from £399,639 in OX26 to £487,827 in OX25, giving a mean across all postcodes of £449,912. Cherwell's average sold price from the Land Registry is £355,186, so the gap between asking and sold prices reflects sellers testing higher prices in a premium South East market.
Are new build homes in Bicester a good buy-to-let investment?
Bicester has significant new build stock, with the NW Bicester eco-town (6,000 homes planned) and Upper Heyford redevelopment adding to supply. OX25, which includes Upper Heyford, shows +13.0% five-year growth but is now contracting at -1.2% over one year. OX25 has no published rental data and only 10 sales per month. OX26, which covers Bicester town centre, has rental data (£1,377/month, 4.1% yield) and 44 sales per month.