Where to Buy Property Investments in St. Asaph: Yields of 4.0%
Gross rental yields of 4.0% are recorded across the St Asaph postcodes where rental data is available, with LL18 providing the only postcode-level rent and yield figures. St. Asaph is small and most property data is available at the local authority level, with St. Asaph located in Denbighshire.
Average sold prices across Denbighshire sit 33.0% below the England average, and the local authority's population grew 2.2% to 95,817 between the 2011 and 2021 censuses.
Denbighshire's average sold price of £195,430 places this local authority area 33.0% below the England average of £291,865 and 9.1% below the Wales average. Asking prices range from £214,982 in LL18 to £327,068 in LL17, creating a wide spread across just three postcodes. Rental data from PropertyData is currently available for 1 of the 3 postcodes.
St Asaph is a city in Denbighshire, North Wales. This guide covers all 3 St Asaph postcodes (LL16, LL17, and LL18) within the Denbighshire unitary authority (ONS code W06000004). St Asaph holds the title of Britain's smallest city, sitting on the River Elwy in the Vale of Clwyd between the coastal resort of Rhyl and the market town of Denbigh. Investors comparing North Wales options may also look at Rhyl, Bangor, Wrexham, or Caernarfon. Browse all our Wales location guides.
Article updated: April 2026
St Asaph Buy-to-Let Market Overview 2026
St Asaph and its surrounding Denbighshire postcodes combine low entry prices with limited rental market data, concentrated almost entirely in the coastal LL18 postcode.
- Average sold price: £195,430 (33.0% below England's £291,865)
- Asking price range: £214,982 (LL18) to £327,068 (LL17)
- Rental yields: 4.0% in LL18 (only postcode with rental data)
- Rental income: Monthly rent of £716 in LL18 (only postcode with data)
- Price per sq ft: Sold prices from £217/sq ft (LL18) to £248/sq ft (LL17)
- Market activity: Sales from 5 per month (LL17) to 45 per month (LL18)
- Deposit requirements: 30% deposits from £64,494 (LL18) to £98,120 (LL17)
- Affordability ratios: Property prices from 6.6 to 10.0 times Denbighshire's median annual salary of £32,691
Contents

-
by Robert Jones, Founder of Property Investments UK
With two decades in UK property, Rob has been investing in buy-to-let since 2005, and uses property data to develop tools for property market analysis.

Property Data Sources
Our location guide relies on diverse, authoritative datasets including:
- HM Land Registry UK House Price Index
- Ministry of Housing, Communities and Local Government
- Ordnance Survey Data Hub
- Propertydata.co.uk
We update our property data quarterly to ensure accuracy. Last update: April 2026. All data is presented as provided by our sources without adjustments or amendments.
Why Invest in St Asaph?
Denbighshire's population stands at 95,817 according to the 2021 Census, a 2.2% increase from 93,734 in 2011. This is modest growth compared to England's 6.6% over the same period, but it reflects a stable population base in a predominantly rural local authority.
St Asaph itself is Britain's smallest city, with cathedral city status rather than a large urban population. The wider Denbighshire area stretches from the North Wales coastline at Rhyl and Prestatyn to the inland market towns of Denbigh and Ruthin. The A55 expressway connects the area to Chester, Liverpool, and Manchester, placing it within commuting range of larger employment centres.
The employment rate in Denbighshire is 74.2%, above the Wales average of 72.3% but below the Great Britain rate of 75.6%. The ONS unemployment estimate for Denbighshire is suppressed due to small sample sizes. Health and social work dominates local employment at 31.0% of all employee jobs (13,000 positions), more than double the next largest sector. Wholesale and retail accounts for 11.9% (5,000 jobs), followed by accommodation and food services at 8.3% (3,500 jobs) and education at 8.3% (3,500 jobs).
The median gross annual salary in Denbighshire is £32,691, which is 10.1% below the Wales regional median of £36,353 and 16.4% below the Great Britain median of £39,125. The salary gap feeds directly into property affordability ratios covered later in this guide.
Denbighshire Economic Summary
- Population: 95,817 (2021 Census). Growth of 2.2% from 2011.
- Median annual salary: £32,691 (Denbighshire), £36,353 (Wales), £39,125 (Great Britain)
- Employment rate: 74.2% (Denbighshire), 72.3% (Wales), 75.6% (Great Britain)
- Unemployment rate: Suppressed (Denbighshire), data unavailable due to small sample sizes
- Key employment sectors: Health & social work (31.0%), wholesale & retail (11.9%), accommodation & food (8.3%), education (8.3%), manufacturing (7.1%)
Source: ONS Census 2021, Nomis Labour Market Profile (ASHE 2025, Employment Oct 2024-Sep 2025)
Regeneration and Investment in St Asaph
Denbighshire has secured significant public funding across multiple programmes since 2023, with the largest investments concentrated on the coastal towns of Rhyl and Prestatyn and the historic market town of Denbigh.
- Rhyl "Our Rhyl" Pride in Place Programme (Approved, £20m): A 10-year regeneration plan covering high streets, heritage, housing, transport, health and wellbeing, directed by an independent community-led board. The council approved submission to the UK Government's Pride in Place Programme in November 2025. Details at Nation.Cymru.
- Vale of Clwyd Levelling Up Fund (Funded, £20m): £11 million allocated to Rhyl for town centre improvements, Queens Market conversion, and promenade connectivity, with additional investment in Prestatyn and Denbigh. Projects are in delivery. Details at GOV.UK.
- North Wales Hospital Denbigh Redevelopment (Planning approved, 300 homes): The Grade II*-listed former psychiatric hospital on a 53-acre site is being converted into residential apartments, shops, restaurants, and community facilities by Jones Bros over a 10-year phased programme. The project is expected to create 1,200 jobs. Details at Construction UK Magazine.

St Asaph Property Market Analysis
When was the last house price crash in St Asaph?
St Asaph is in the Denbighshire unitary authority so all sold property prices from HM Land Registry are available at the local authority level. The data below covers January 1995 to December 2025.
Denbighshire's average property price fell 20.3% from its pre-crash peak of £145,640 in September 2007 to a trough of £116,111 in March 2013. This was a deeper decline than both the Wales average (18.1%) and the England average (18.2%). The local market also took longer to find its floor. Wales and England both bottomed out in March 2009, while Denbighshire continued to slide for another four years.
1995 to 2007 (The Boom): Denbighshire prices rose from £38,559 in January 1995 to £145,640 in September 2007, driven by low interest rates, accessible credit, and a rural housing shortage across North Wales.
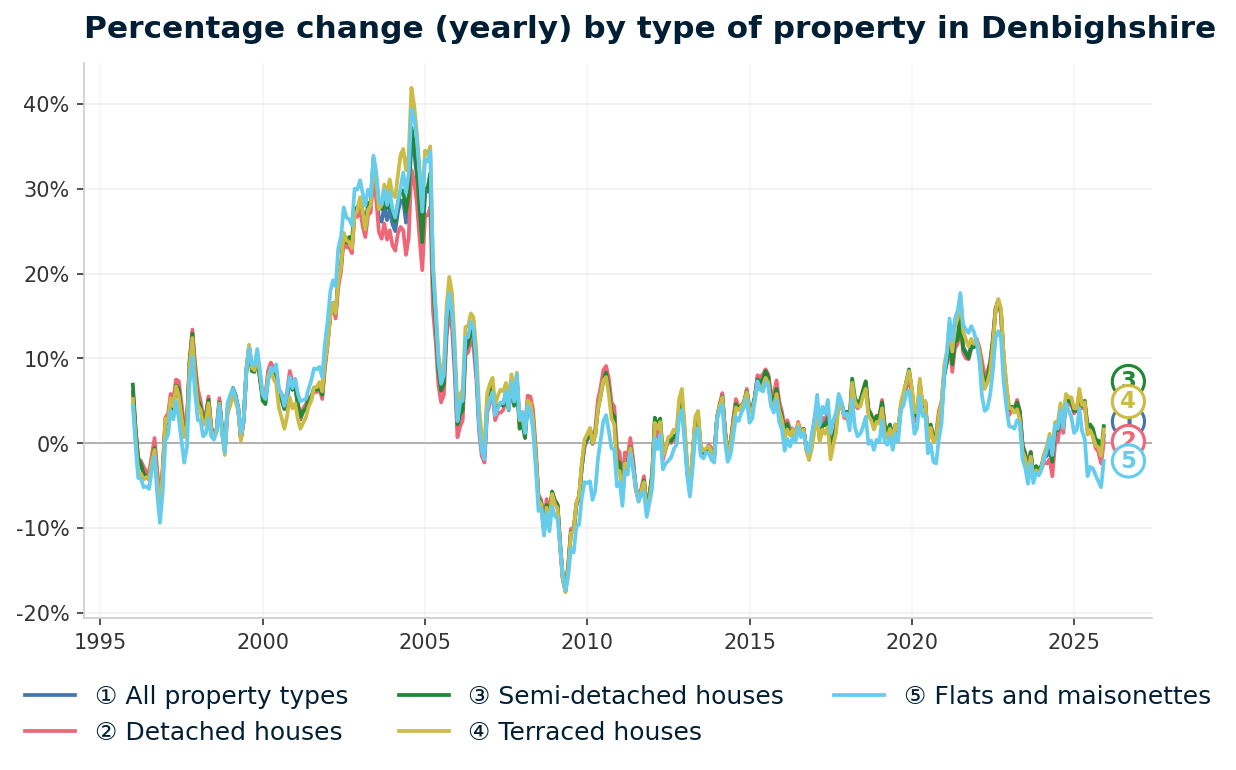
2008 to 2009 (The Financial Crisis): The worst annual price change reading hit -17.5% in May 2009. Coastal postcodes saw sharper declines than inland areas.
2010 to 2013 (Extended Stagnation): Unlike the national market, Denbighshire did not bounce back in 2010. Prices drifted lower, reaching their absolute floor of £116,111 in March 2013.
2014 to 2019 (Slow Recovery): Growth was slow but consistent. By August 2018 the average hit £146,380, finally surpassing the September 2007 peak after approximately 11 years. December 2019 closed at £155,385.
2020 to 2022 (Pandemic Surge): The Land Transaction Tax holiday and the shift to remote working pushed prices sharply higher. June 2021 saw 12.5% annual growth. The average reached £191,582 by December 2022.
2023 to present: Rising interest rates cooled the market, with annual change reaching -3.5% by December 2023. Prices have since recovered. Denbighshire reached an all-time high of £198,400 in March 2025. The latest reading for December 2025 is £195,430 with annual growth of +0.9%.
Long-term growth summary:
- 5 years (2020-2025): 20.6% growth (£162,080 to £195,430)
- 10 years (2015-2025): 44.8% growth (£134,958 to £195,430)
- 15 years (2010-2025): 56.4% growth (£124,945 to £195,430)
- 20 years (2005-2025): 54.0% growth (£126,926 to £195,430)
- 30 years (1995-2025): 360.3% growth (£42,459 to £195,430)
The 20-year figure is lower than the 15-year figure because December 2005 prices (£126,926) were higher than December 2010 prices (£124,945). The 2008 crash wiped out gains made during the mid-2000s boom and pushed Denbighshire below its 2005 level.
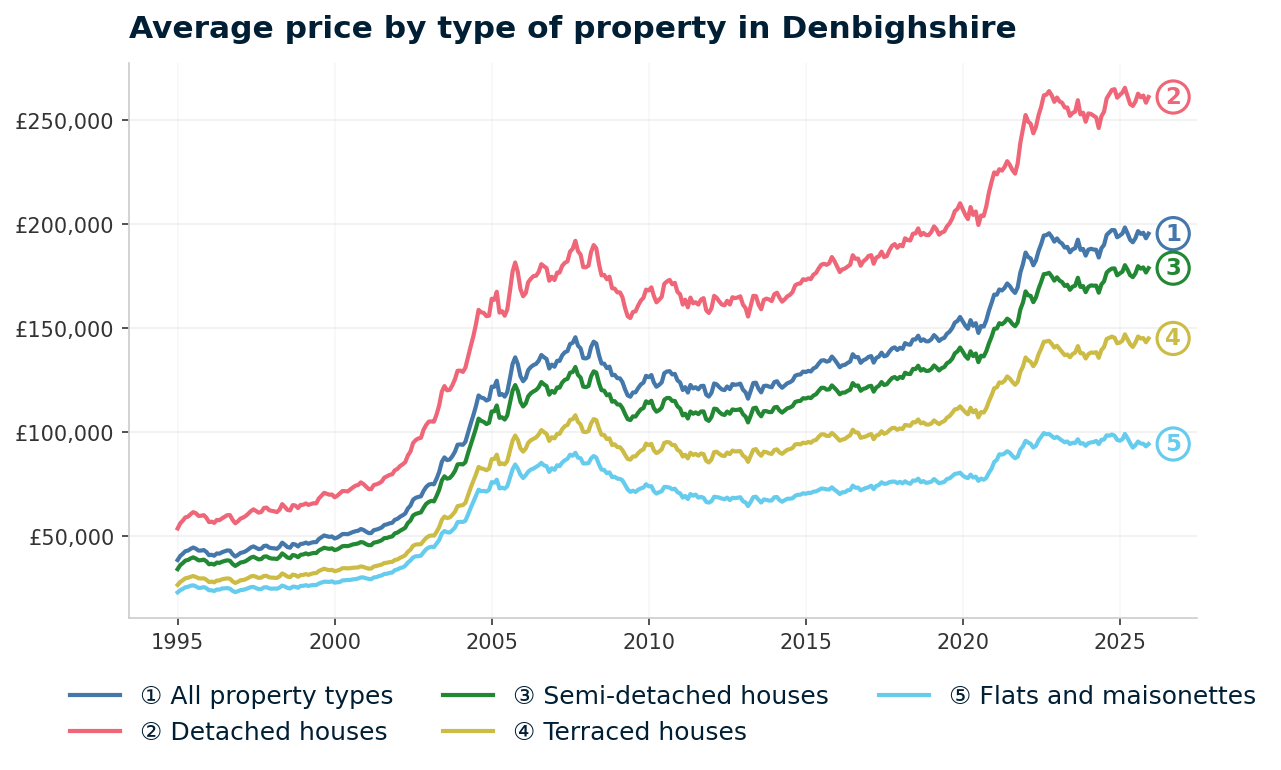
Source: HM Land Registry House Price Index for Denbighshire, January 1995 to December 2025.
Thinking of Buying?
We have off-market investment properties averaging 8%+ annual yield.
View Property DealsSold House Prices in St Asaph
The average sold price in Denbighshire is £195,430, which is £96,435 less than the England average of £291,865. That 33.0% discount applies across the board, but flats show the widest gap at 57.0% below England.
| Property Type | Denbighshire Average | England Average | Difference |
|---|---|---|---|
| Detached houses | £261,111 | £471,667 | -44.6% |
| Semi-detached houses | £178,846 | £289,135 | -38.1% |
| Terraced houses | £145,055 | £244,830 | -40.8% |
| Flats and maisonettes | £94,317 | £219,340 | -57.0% |
| All property types | £195,430 | £291,865 | -33.0% |
Detached houses in Denbighshire average £261,111, which is 44.6% below the England figure of £471,667. Denbighshire's housing stock leans heavily towards detached and semi-detached properties across the rural Vale of Clwyd, where supply consistently exceeds the small number of annual transactions.
Semi-detached houses at £178,846 sit 38.1% below England's £289,135. These are concentrated in the coastal towns of Rhyl and Prestatyn where the housing mix reflects the area's post-war development, with most streets built between the 1930s and 1970s.
Terraced houses average £145,055, a 40.8% discount to England's £244,830. The terraced stock in Denbighshire is largely found in Rhyl's town centre and inner streets, where Victorian and Edwardian properties provide the lowest entry point by property type.
Flats and maisonettes at £94,317 are 57.0% below England's £219,340. This is the widest percentage gap of any property type. Flat stock in the area is limited, with most concentrated in Rhyl's seafront and converted Victorian properties. Low demand relative to houses keeps flat prices significantly below the national average.
Property Data Sources
Our location guide relies on diverse, authoritative datasets including:
- HM Land Registry UK House Price Index
- Ministry of Housing, Communities and Local Government
- Ordnance Survey Data Hub
- Propertydata.co.uk
We update our property data quarterly to ensure accuracy. Last update: April 2026. All data is presented as provided by our sources without adjustments or amendments.
Price Per Square Foot in St Asaph
Sold prices per square foot in the St Asaph postcodes range from £217 in LL18 to £248 in LL17. The spread is relatively narrow at just £31/sq ft across the three postcodes. Where asking prices show a £112,086 gap between cheapest and most expensive, price per square foot compresses that difference, showing that buyers in LL17 are paying for location rather than significantly different property sizes.
| Rank | Area | Price Per Sq Ft |
|---|---|---|
| 1 | LL18 (Rhyl) | £217 |
| 2 | LL16 (Denbigh) | £229 |
| 3 | LL17 (St Asaph) | £248 |
LL18 (Rhyl) delivers the lowest price per square foot at £217, which aligns with its position as the most affordable postcode by asking price. The concentration of terraced houses and flats along Rhyl's seafront and town centre pulls the per-square-foot figure down. LL17 (St Asaph) at £248/sq ft reflects the premium for the Vale of Clwyd's cathedral city, where a smaller number of properties change hands each month.
Houses for Sale in St Asaph: Asking Prices
Asking prices in the St Asaph postcodes range from £214,982 in LL18 to £327,068 in LL17, a spread of £112,086. The mean asking price across all three postcodes is £271,778. LL17 is the most expensive at more than 50% above LL18, a gap driven by the mix of detached properties in the rural area between St Asaph and Bodelwyddan. Investors looking for below market value properties in North Wales will find the lowest asking prices concentrated in LL18.
| Rank | Area | Asking Price |
|---|---|---|
| 1 | LL18 (Rhyl) | £214,982 |
| 2 | LL16 (Denbigh) | £273,284 |
| 3 | LL17 (St Asaph) | £327,068 |
LL18 (Rhyl) at £214,982 is the postcode closest to the Denbighshire Land Registry average of £195,430. The asking price figure from PropertyData reflects current listings, while the Land Registry average is based on completed transactions. At just 10.0% above the Land Registry figure, LL18 shows the narrowest gap between listed and transacted prices in the area. LL17's asking price of £327,068 sits 67% above the Land Registry average, indicating a higher proportion of detached and premium properties in the current listing mix. Investors looking for lower entry points may also want to check repossessed properties for sale in North Wales.

House Price Growth in St Asaph
Five-year growth across the St Asaph postcodes ranges from -3.5% in LL16 to 23.2% in LL17, but the short-term picture tells a different story. LL17 recorded the strongest five-year growth, yet its one-year and three-year figures are both deeply negative at -11.8% and -15.2%. With just 5 sales per month, LL17's growth data reflects individual transactions rather than broad market trends. LL18 shows the most consistent pattern across all three timeframes.
| Area | 1 Year | 3 Years | 5 Years |
|---|---|---|---|
| LL17 (St Asaph) | -11.8% | -15.2% | 23.2% |
| LL18 (Rhyl) | 3.0% | 2.6% | 15.0% |
| LL16 (Denbigh) | -11.5% | -5.1% | -3.5% |
LL18 (Rhyl) is the only postcode showing positive growth across all three timeframes: 3.0% over one year, 2.6% over three years, and 15.0% over five years. The coastal postcode benefits from the highest sales volume (45/month), which smooths out the individual transaction effects that distort LL16 and LL17's figures. LL16 (Denbigh) is negative across all three periods, with 12 sales per month providing a slightly larger sample than LL17 but still reflecting a thin market.
Monthly Property Sales in St Asaph
LL18 (Rhyl) dominates market activity with 45 sales per month, accounting for 73% of all transactions across the three postcodes. LL17 (St Asaph) records just 5 sales per month despite carrying the highest turnover rate at 36%. That turnover figure reflects the small total stock in the postcode rather than high demand. LL16 (Denbigh) sits in the middle at 12 sales per month with the lowest turnover rate of 10%.
| Area | Sales Per Month | Turnover | Asking Price |
|---|---|---|---|
| LL18 (Rhyl) | 45 | 18% | £214,982 |
| LL16 (Denbigh) | 12 | 10% | £273,284 |
| LL17 (St Asaph) | 5 | 36% | £327,068 |
The total combined sales volume across all three postcodes is 62 per month. For context, a single city-centre postcode in a mid-sized English city typically records 30-50 sales monthly on its own. The thin market in LL16 and LL17 means individual transactions can move the average significantly, which explains the volatile growth figures in those postcodes. LL18's volume at 45/month provides enough data for more reliable market readings.
Property Data Sources
Our location guide relies on diverse, authoritative datasets including:
- HM Land Registry UK House Price Index
- Ministry of Housing, Communities and Local Government
- Ordnance Survey Data Hub
- Propertydata.co.uk
We update our property data quarterly to ensure accuracy. Last update: April 2026. All data is presented as provided by our sources without adjustments or amendments.

St Asaph Rental Market Analysis
For investors weighing up whether rental property is a worthwhile investment in St Asaph, the data below breaks down average monthly rents and gross rental yields across the area's postcodes.
Rental data is available for 1 of the 3 postcodes. LL18 (Rhyl) records a monthly rent of £716 and a gross yield of 4.0%. LL16 and LL17 do not have sufficient rental market data for PropertyData to generate reliable estimates. If you are looking to build a property portfolio in Wales, the concentration of rental data in LL18 reflects where the active lettings market sits in this part of North Wales.
Average Rent & Gross Rental Yields in St Asaph
Gross rental yields of 4.0% and average monthly rents of £716 are recorded in LL18 (Rhyl), the only St Asaph postcode with published rental data. The asking price in LL18 is £214,982. The absence of data for LL16 and LL17 does not mean there are no rental properties in those areas. It means the sample size of lettings activity is too small for PropertyData to publish a reliable estimate.
| Area | Average Monthly Rent | Asking Price | Gross Yield |
|---|---|---|---|
| LL18 (Rhyl) | £716 | £214,982 | 4.0% |
| LL16 (Denbigh) | Not enough data | £273,284 | Not enough data |
| LL17 (St Asaph) | Not enough data | £327,068 | Not enough data |
A 4.0% gross yield in LL18 sits below the 5-6% range that many investors target, but it comes with correspondingly low entry costs. At a 30% deposit of £64,494, the capital required is significantly less than most English postcodes delivering similar yields. The rental figure of £716/month is broadly consistent with the wider North Wales coastal market.
LL16 (Denbigh) and LL17 (St Asaph) are excluded from the chart due to insufficient rental data.
Is St Asaph Rent High?
In LL18 (Rhyl), the average monthly rent of £716 represents 26.3% of the local median gross monthly income. This falls within the 25-30% range that is generally considered manageable for tenants. LL16 and LL17 do not have rental data, so rent-to-income ratios cannot be calculated for those postcodes.
The median gross weekly salary in Denbighshire is £628.70, which equates to £2,724 per month or £32,691 per year. This is below the Wales regional median of £699.10 per week and the Great Britain median of £752.40 per week. Data from the Nomis Labour Market Profile (ASHE 2025).
| Rank | Area | Rent as % of Income |
|---|---|---|
| 1 | LL18 (Rhyl) | 26.3% |
| — | LL16 (Denbigh) | Not enough data |
| — | LL17 (St Asaph) | Not enough data |
At 26.3%, LL18's rent-to-income ratio sits in the middle of the range seen across North Wales locations. Bangor's postcodes range from around 25% to 35% depending on the area. The ratio is based on the local authority median salary and the postcode average rent. Individual properties will vary depending on type and condition.
Thinking of Buying?
We have off-market investment properties averaging 8%+ annual yield.
View Property DealsBuy-to-Let Considerations
Are House Prices High? Price-to-Earnings Ratios
Purchasing a property in the St Asaph area requires between 6.6 and 10.0 times the median annual salary. This is based on the Nomis Labour Market Profile for Denbighshire showing the median gross annual income for Denbighshire residents is £32,691.
For comparison, the England national benchmark (England average sold price of £291,865 divided by the Great Britain median salary of £39,125) sits at 7.5. LL18 at 6.6 is below this benchmark. LL16 at 8.4 and LL17 at 10.0 both exceed it, reflecting the higher asking prices in those postcodes relative to local earnings.
| Rank | Area | Price-to-Earnings Ratio |
|---|---|---|
| 1 | LL18 (Rhyl) | 6.6 |
| 2 | LL16 (Denbigh) | 8.4 |
| 3 | LL17 (St Asaph) | 10.0 |
LL18's price-to-earnings ratio of 6.6 is the lowest in the area and below the national benchmark of 7.5. This reflects the combination of lower asking prices (£214,982) against Denbighshire's median salary. LL17's ratio of 10.0 means that a property at the average asking price costs exactly 10 years of pre-tax local earnings. While the lower local salary contributes to higher ratios across all postcodes, LL18 remains accessible on this metric.
Deposit Requirements in St Asaph
A 30% deposit on a property at the average asking price in the St Asaph postcodes ranges from £64,494 in LL18 to £98,120 in LL17. The £33,625 gap between cheapest and most expensive postcodes means the entry point varies significantly depending on where an investor buys. For context on the full cost of purchasing, see our guides to stamp duty (or Land Transaction Tax in Wales) and buy-to-let costs.
| Rank | Area | 30% Deposit Required |
|---|---|---|
| 1 | LL18 (Rhyl) | £64,494 |
| 2 | LL16 (Denbigh) | £81,985 |
| 3 | LL17 (St Asaph) | £98,120 |
LL18's deposit requirement of £64,494 is among the lowest in any North Wales postcode with recorded rental yield data. Combined with a gross yield of 4.0% and the strongest five-year growth in the area at 15.0%, LL18 is where the data overlaps across multiple metrics. LL17 at £98,120 requires over 50% more capital but has no published rental yield data. For investors exploring lower capital routes, see our guide to no-deposit investment property.
What the St Asaph Data Tells Buy-to-Let Investors
LL18 (Rhyl) is the only St Asaph postcode with recorded rental data, delivering a 4.0% gross yield on an asking price of £214,982 with a 30% deposit of £64,494. It also records 45 of the area's 62 monthly sales and is the only postcode with positive price growth across all three timeframes. For investors exploring investment property in North Wales, the data for the St Asaph area is heavily concentrated in this one postcode.
LL16 (Denbigh) and LL17 (St Asaph) present a different profile. Both carry higher asking prices (£273,284 and £327,068), negative recent price growth, and no published rental data. LL17 records just 5 sales per month. LL16 at 12 sales per month has a slightly deeper data pool but still shows -11.5% one-year and -3.5% five-year growth. Investors looking at these postcodes would be operating in a thin market with limited data to support yield projections.
Denbighshire's sold prices sit 33.0% below the England average and 9.1% below the Wales average. Long-term Land Registry data shows 360.3% growth over 30 years, though the 2008 crash hit Denbighshire harder than both Wales and England (20.3% decline vs 18.1% and 18.2%), and recovery took approximately 11 years. Investors searching for off-market property in the area may find opportunities in LL18's active market.
Wales requires all landlords to register with Rent Smart Wales before letting or managing rental property. This applies to all Denbighshire postcodes.
How St Asaph Compares
St Asaph's mean asking price of £271,778 is the second highest of the five North Wales locations compared here, behind Bangor at £276,089. St Asaph's top gross yield of 4.0% matches Rhyl and sits just above Wrexham at 3.9%. Bangor leads on both yield (4.3%) and rent (£899/month). Caernarfon does not have sufficient rental data for yield calculations.
| Location | Mean Asking Price | Mean Monthly Rent | Top Gross Yield |
|---|---|---|---|
| St Asaph | £271,778 | £716 | 4.0% |
| Rhyl | £234,228 | £716 | 4.0% |
| Bangor | £276,089 | £899 | 4.3% |
| Wrexham | £259,235 | £780 | 3.9% |
| Caernarfon | £255,293 | — | — |
St Asaph and Rhyl share the same LL18 postcode, which explains the identical rent (£716) and yield (4.0%) figures. The difference is that St Asaph's mean asking price is £37,550 higher because it also includes LL16 and LL17, which carry significantly higher asking prices but no rental data. Rhyl's article focuses on the coastal postcodes where the rental market is more active.
Bangor delivers the highest yield at 4.3% and the highest mean asking price at £276,089, driven by student demand from Bangor University. Wrexham sits in the middle on all three metrics at £259,235, £780, and 3.9%. Rhyl has the lowest mean asking price at £234,228. Caernarfon at £255,293 has no published rental data, similar to the data gaps seen in St Asaph's LL16 and LL17 postcodes. For a broader view of where yields and prices compare nationally, see our guide to the best buy-to-let locations.
Frequently Asked Questions
How does St Asaph compare to Rhyl for buy-to-let?
Both locations share the same LL18 rental data: £716/month rent and a 4.0% gross yield. The difference is scope. St Asaph's guide includes LL16 (Denbigh) and LL17 (St Asaph), which add higher-priced postcodes with asking prices of £273,284 and £327,068 but no published rental data. Rhyl's mean asking price is £234,228 compared to St Asaph's £271,778. Investors focused on the coastal rental market are looking at the same LL18 data in both cases. The additional postcodes in this guide cover the inland market where sales volumes are lower (12 and 5 per month) and price growth has been negative over the past year.
Why is rental data missing for two St Asaph postcodes?
The rental market in LL16 and LL17 is too small for PropertyData to generate reliable estimates. LL16 (Denbigh) records 12 property sales per month and LL17 (St Asaph) records 5. The private rental market in these predominantly rural postcodes is smaller still. Where the data does not meet the threshold, PropertyData publishes no figure rather than an unreliable one. This is a common pattern in rural Welsh postcodes. Caernarfon's postcodes show similar data gaps.
What type of property is most affordable in the St Asaph area?
Flats and maisonettes at £94,317 are the most affordable property type, sitting 57.0% below the England average. Terraced houses average £145,055 (40.8% below England). Most of the affordable stock is concentrated in LL18 (Rhyl), where the asking price averages £214,982 and the largest number of properties change hands each month. Investors searching for lower entry points may also want to explore renovation properties in the area, particularly along Rhyl's seafront where older housing stock is concentrated.
What drives rental demand in the St Asaph area?
Health and social work dominates local employment at 31.0% of all employee jobs (13,000 positions), making it the primary driver of tenant demand. Wholesale and retail (11.9%), accommodation and food services (8.3%), and education (8.3%) follow. There is no university in St Asaph itself. The nearest is Bangor University, approximately 30 miles west. Tenant demand in LL18 (Rhyl) is more likely driven by workers in the health, retail, and hospitality sectors rather than students. The A55 expressway connects the area to larger employment centres in Chester and the Merseyside region.
What is the stamp duty position for buying property in Wales?
Wales uses Land Transaction Tax (LTT) rather than Stamp Duty Land Tax (SDLT), with different rates and thresholds from England and Northern Ireland. Additional property purchases (including buy-to-let properties) attract a higher rate surcharge under LTT, similar to the SDLT surcharge in England. The current LTT rates, thresholds, and how they apply to investment purchases are covered in the Wales section of our stamp duty calculator.