Where to Buy Property Investments in St. Helens: Yields of 5.5%
St Helens' gross rental yields range from 4.4% to 5.5% across all eight postcodes, with WA9 delivering the highest returns. Average sold prices sit 38.6% below the England average, and the borough's population grew 4.53% to 183,248 between the 2011 and 2021 censuses.
St Helens' average sold price of £179,209 makes it one of the most affordable metropolitan boroughs in the North West for buy-to-let property investors. That is 17.6% below the North West regional average and creates entry points that most southern English towns cannot match. Asking prices start from £198,928 in WA10, and rental data is available for all 8 of the borough's postcodes.
This guide covers all 8 St Helens postcodes (L34, L35, WA9, WA10, WA11, WA12, WN4, WN5) under the Metropolitan Borough of St Helens (ONS code E08000013). St Helens sits between Liverpool and Wigan in Merseyside, anchored by its glass manufacturing heritage and a growing innovation economy. Investors comparing options in the region may also consider Liverpool, Warrington, Wigan, or Birkenhead. Browse all our North West location guides.
Article updated: March 2026
St Helens Buy-to-Let Market Overview 2026
St Helens offers some of the lowest entry prices in the North West, backed by its glass industry heritage and a growing life sciences and advanced manufacturing sector.
- Average sold price: £179,209 (38.6% below England's £291,865)
- Asking price range: £198,928 (WA10) to £294,348 (L34)
- Rental yields: 4.4% (L34) to 5.5% (WA9) across all 8 postcodes
- Rental income: Monthly rents from £810 (WA10) to £1,081 (L34)
- Price per sq ft: House prices from £181/sq ft (WA10) to £239/sq ft (WA12)
- Market activity: Sales ranging from 15 per month (L34) to 43 per month (WA10)
- Deposit requirements: 30% deposits range from £59,679 (WA10) to £88,304 (L34)
- Affordability ratios: Property prices from 5.3 to 7.9 times St Helens' median annual salary of £37,306
Contents

-
by Robert Jones, Founder of Property Investments UK
With two decades in UK property, Rob has been investing in buy-to-let since 2005, and uses property data to develop tools for property market analysis.

Property Data Sources
Our location guide relies on diverse, authoritative datasets including:
- HM Land Registry UK House Price Index
- Ministry of Housing, Communities and Local Government
- Ordnance Survey Data Hub
- Propertydata.co.uk
We update our property data quarterly to ensure accuracy. Last update: March 2026. All data is presented as provided by our sources without adjustments or amendments.
Why Invest in St Helens?
St Helens' population grew 4.53% to 183,248 between the 2011 and 2021 censuses, and the borough's median annual salary of £37,306 sits within £139 of the North West regional average. That combination of steady population growth and near-average wages underpins a rental market where tenants can afford to pay and housing remains affordable enough to deliver yields. St Helens' economy has been shaped by one industry more than almost any other town in England. Pilkington Glass, founded in 1826, turned the borough into the global centre of flat glass manufacturing. At its peak the company employed over 17,000 local workers. NSG Group (Pilkington's parent company since 2006) still operates significant manufacturing on Merseyside, but the workforce is a fraction of what it was. What replaced those jobs is what matters for investors.
The borough has pivoted towards logistics, distribution, and advanced manufacturing. St Helens sits at the junction of the M6, M62, and East Lancashire Road, making it one of the best-connected distribution points in the North West. Large warehousing and logistics operations serve the Liverpool and Manchester corridors. Whiston Hospital (part of St Helens and Knowsley Teaching Hospitals NHS Trust) is the borough's largest single-site employer and anchors healthcare employment across the area.
Between the 2011 and 2021 censuses, St Helens' population grew from 175,308 to 183,248, a rise of 4.53%. That is below the England average growth rate of 6.6% for the same period, reflecting steady demand rather than rapid expansion. The borough's housing stock is predominantly terraced and semi-detached, which keeps prices affordable and creates natural entry points for buy-to-let investors. Some of this stock includes renovation properties where older terraces in WA9 and WA10 can be acquired below average asking prices.
Earnings in St Helens are close to the regional average. The median annual salary is £37,306, compared to £37,445 across the North West and £39,125 for Great Britain. That narrow gap between local and regional wages means St Helens workers earn broadly in line with the wider region, yet housing costs are significantly lower than regional cities like Manchester or Liverpool.
St Helens Economic Summary
- Population: 183,248 (2021 Census). Growth of 4.53% from 2011.
- Median annual salary: £37,306 (St Helens), £37,445 (North West), £39,125 (Great Britain)
- Employment rate: 75.3% (St Helens)
- Unemployment rate: Data suppressed (St Helens sample below disclosure threshold)
- Key employment sectors: Glass manufacturing, logistics and distribution, healthcare, advanced manufacturing, public services
Source: ONS Census 2021, Nomis Labour Market Profile (ASHE 2025)
St Helens' employment rate of 75.3% is broadly in line with the Great Britain average. The unemployment rate has been suppressed by Nomis due to sample size, which typically occurs in smaller metropolitan boroughs where the Annual Population Survey sample is too small for a reliable estimate. For buy-to-let investors, the combination of affordable housing, near-average wages, and strong transport links creates a market where rental demand is driven by working households who earn enough to pay rent reliably but are priced into renting rather than buying.
Regeneration and Investment in St Helens
Over £54m of confirmed investment is reshaping St Helens from a glass manufacturing town into an innovation hub. The three projects below represent genuine capital commitment, not speculative plans.
- Glass Futures (completed, £54m): A global centre for glass research and innovation, opened in St Helens in 2023. The facility provides commercial-scale testing for sustainable glass manufacturing and has attracted international partners. For investors, Glass Futures creates skilled employment in an area where traditional manufacturing jobs have declined. Updates at Glass Futures.
- Pilkington Glass Works Redevelopment (approved masterplan, 764 homes): The former Pilkington factory site has been approved for a mixed-use development including 764 new homes and 150,000 sq ft of commercial space. The scheme transforms one of the borough's largest brownfield sites into a new residential quarter. Housing supply will increase, but the employment and infrastructure investment should support rental demand in surrounding postcodes. Updates at Broadway Malyan.
- Project HALO (planning approved, October 2025): A life sciences and advanced manufacturing hub planned for St Helens, with planning approval secured in October 2025. The project targets the health and life sciences sector, building on the borough's existing healthcare employment base around Whiston Hospital. Updates at TheBusinessDesk.com.

St Helens Property Market Analysis
When Was the Last House Price Crash in St Helens?
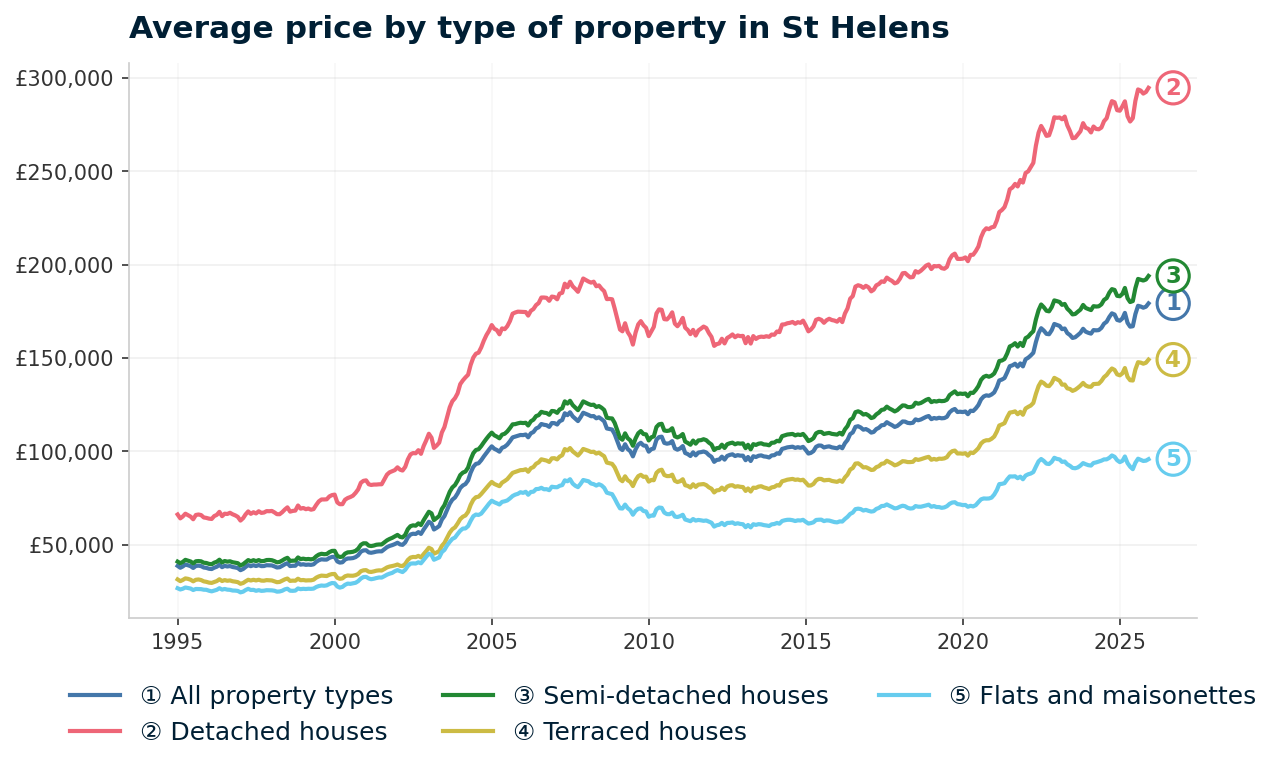
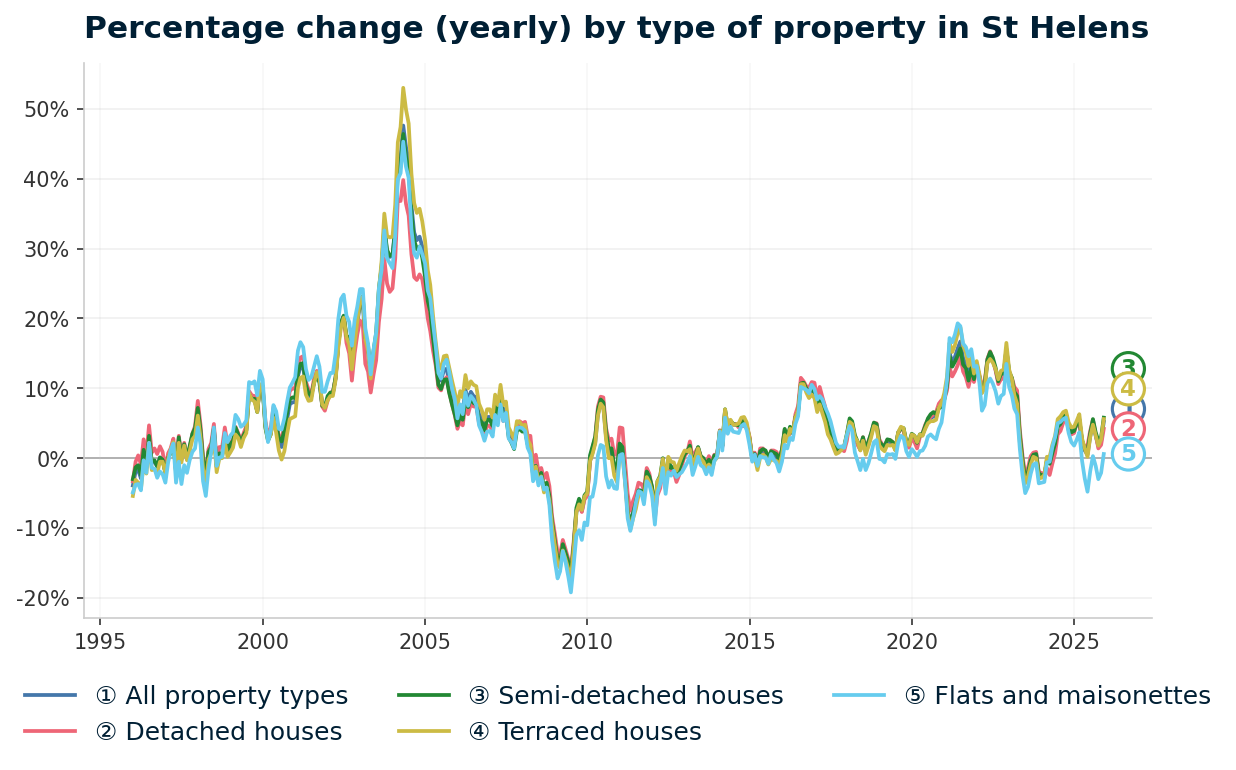
St Helens property prices have risen 376.3% over 30 years, from £37,625 in December 1995 to £179,209 in December 2025. The Metropolitan Borough of St Helens has its own entry in the HM Land Registry House Price Index, covering all property transactions from January 1995 to December 2025. The data shows one major crash, a prolonged period of stagnation, and a sharp pandemic-era recovery.
- 1995-2000 (Slow start): St Helens began 1995 at £38,701. By December 2000, prices had risen to just £46,984. Five years of modest growth while other parts of the country accelerated. Annual change hit 10.1% in January 2000, but the starting base was low.
- 2000-2007 (The boom): Prices more than doubled from £46,984 in December 2000 to a peak of £120,943 in July 2007. The sharpest growth came in 2004-2005. Cheap credit and rising demand pushed prices well beyond what local wages could support in a borough where the median salary was under £30,000 at the time.
- 2007-2012 (The financial crisis and stagnation): From the peak of £120,943 in July 2007 to the trough of £94,394 in February 2012, St Helens lost 22.0% of its value over 55 months. The worst annual change was -17.0% in July 2009. St Helens' decline of 22.0% was steeper than both the North West (-18.3%) and England overall (-18.2%). The borough's reliance on manufacturing employment meant job losses hit harder than in more diversified economies.
- 2012-2016 (Stagnation): Unlike many English cities that recovered from 2013 onwards, St Helens flatlined. Prices traded between £94,000 and £102,000 for four years. By December 2015, the average was £101,925, still 15.7% below the pre-crash peak.
- 2017-2019 (Slow recovery): Growth returned but at a glacial pace. Prices rose from £101,925 in December 2015 to £121,229 by December 2019. Annual changes were modest at 1-3%. Prices first matched the pre-crash peak of £120,943 in September 2019 at £122,088. That recovery took over 12 years from the July 2007 peak.
- 2020-2022 (Pandemic surge): The stamp duty holiday and remote working triggered the strongest growth since the early 2000s. Prices jumped from £119,913 in March 2020 to £168,204 by December 2022: 40.3% in under three years. Annual change hit 15.7% in June 2021. St Helens' affordability made it a beneficiary as buyers moved away from higher-priced city centres.
- 2023 (Rate shock): Interest rate rises cooled the market. Prices dipped from £168,204 in December 2022 to £164,071 by December 2023. A decline of 2.5%. Brief and relatively mild.
- 2024-2025 (Recovery): Prices stabilised and resumed rising. By December 2025, the average reached £179,209 with annual growth of 5.2%. St Helens now sits 48.2% above its pre-crash peak.
Long-Term Property Value Growth in St Helens
- 5 years (2020-2025): +37.4% (£130,435 to £179,209)
- 10 years (2015-2025): +75.8% (£101,925 to £179,209)
- 15 years (2010-2025): +77.6% (£100,906 to £179,209)
- 20 years (2005-2025): +64.8% (£108,776 to £179,209)
- 30 years (1995-2025): +376.3% (£37,625 to £179,209)
The 20-year growth figure of 64.8% is lower than the 30-year figure because December 2005 sat near the top of the boom. An investor who bought at the wrong point in 2005-2007 would have waited over a decade to break even. The lesson for current investors is that St Helens is a low-entry, long-hold market. The 37.4% five-year growth shows what happens when the cycle turns in an affordable borough: percentage gains are amplified by the low base.
Source: HM Land Registry House Price Index for St Helens, January 1995 to December 2025.
Thinking of Buying?
We have off-market investment properties averaging 8%+ annual yield.
View Property DealsSold House Prices in St Helens
How cheap is St Helens compared to the rest of England? The headline figure of £179,209 is 38.6% below England's £291,865 and 17.6% below the North West's £217,428. The size of that discount varies sharply depending on property type.
Flats in St Helens average £95,821. That is 56.3% below the England average of £219,340. No other property type comes close to that discount. St Helens has limited purpose-built flat stock, and what exists is predominantly ex-local authority or older conversion stock. That lack of premium apartment supply keeps flat prices well below the national benchmark.
| Property Type | St Helens Average | England Average | Difference |
|---|---|---|---|
| Detached houses | £294,608 | £471,667 | -37.5% |
| Semi-detached houses | £193,905 | £289,135 | -32.9% |
| Terraced houses | £149,115 | £244,830 | -39.1% |
| Flats and maisonettes | £95,821 | £219,340 | -56.3% |
| All property types | £179,209 | £291,865 | -38.6% |
Terraced houses at £149,115 represent a 39.1% discount to England. Terraces are the backbone of St Helens' rental stock, particularly in WA9 and WA10 where rows of Victorian and inter-war terraces dominate the streetscape. For buy-to-let investors, this is the entry point: affordable terraced housing in a market where tenants earn near-average wages.
Semi-detached houses show a 32.9% discount at £193,905. Semis are the most common property type across the borough and form the core of family rental stock in areas like WA11 (Haydock, Rainford) and WA12 (Newton-le-Willows). Owner-occupier competition in these areas keeps prices slightly closer to the national average than terraces.
Detached houses at £294,608 carry a 37.5% discount. Detached stock is concentrated in the more suburban postcodes like L34 (Prescot), L35 (Whiston, Rainhill), and WA11. These areas command higher prices but attract a different buyer profile. For most buy-to-let investors, the yield compression at detached price points makes terraced and semi-detached stock the more practical choice.
Flats at £95,821 offer the deepest discount at 56.3%. Sub-£100,000 entry prices mean deposits under £29,000 at 30%. But flat stock in St Helens is limited and the rental market for flats is smaller than in city centres with student or young professional demand. The postcode-level data in the sections below shows where rental demand is strongest.
Property Data Sources
Our location guide relies on diverse, authoritative datasets including:
- HM Land Registry UK House Price Index
- Ministry of Housing, Communities and Local Government
- Ordnance Survey Data Hub
- Propertydata.co.uk
We update our property data quarterly to ensure accuracy. Last update: March 2026. All data is presented as provided by our sources without adjustments or amendments.
Price Per Square Foot in St Helens
Average asking prices can mislead because a postcode might look expensive simply because it has larger properties. Price per square foot strips out that size bias. St Helens' price per square foot ranges from £181 in WA10 to £239 in WA12, a spread of just £58 across eight postcodes. That range is much tighter than most boroughs, and the most you will pay per square foot here is still less than the cheapest postcodes in many southern English towns.
| Rank | Area | Price Per Sq Ft |
|---|---|---|
| 1 | WA10 (St Helens Centre, Eccleston) | £181 |
| 2 | WA9 (St Helens South, Sutton) | £195 |
| 3 | WN5 (Billinge, Orrell) | £204 |
| 4 | WA11 (Haydock, Rainford) | £209 |
| 5 | WN4 (Ashton-in-Makerfield) | £210 |
| 6 | L35 (Whiston, Rainhill) | £220 |
| 7 | L34 (Prescot) | £224 |
| 8 | WA12 (Newton-le-Willows, Earlestown) | £239 |
WA10 at £181 per square foot is the cheapest space in St Helens. This is the town centre and Eccleston area where older terraced housing stock keeps per-foot costs low. WA10 also delivers a 4.9% yield and has the highest transaction volume in the borough at 43 sales per month. Cheap space, strong demand, and reasonable yield in one postcode.
WA12 at £239 per square foot sits at the top, but even the most expensive space in St Helens would rank as affordable in most English boroughs. Newton-le-Willows is a popular commuter area with its own rail station on the Liverpool-Manchester line. That connectivity premium pushes per-foot costs above the rest of the borough. Read this alongside the growth data: WA12 delivered 22.2% five-year growth, suggesting the commuter appeal is driving sustained demand.
The mid-range cluster of WN5, WA11, and WN4 (£204 to £210) accounts for three of the borough's best-performing postcodes by five-year growth. All three delivered 25% or more growth over five years. Reasonable space costs and strong growth in the same postcodes is a combination worth noting.
For Sale Asking Prices in St Helens
St Helens' asking prices range from £198,928 in WA10 to £294,348 in L34, with 5 of 8 postcodes below £230,000. Asking prices reflect what sellers and agents think the market will pay. They are not the same as sold prices, which capture what buyers actually paid. That £95,000 spread is relatively narrow for a borough with eight postcodes, making most of St Helens accessible to investors who might be priced out of nearby Liverpool or Manchester.
| Rank | Area | Average Asking Price |
|---|---|---|
| 1 | WA10 (St Helens Centre, Eccleston) | £198,928 |
| 2 | WA9 (St Helens South, Sutton) | £200,860 |
| 3 | WN4 (Ashton-in-Makerfield) | £215,489 |
| 4 | WN5 (Billinge, Orrell) | £220,191 |
| 5 | WA12 (Newton-le-Willows, Earlestown) | £228,757 |
| 6 | L35 (Whiston, Rainhill) | £242,070 |
| 7 | WA11 (Haydock, Rainford) | £250,948 |
| 8 | L34 (Prescot) | £294,348 |
WA10 and WA9 cluster together below £201,000. These are the two core St Helens postcodes covering the town centre, Eccleston, Sutton, and the southern suburbs. For investors, the entry price is essentially the same. The decision comes down to yield and tenant profile. WA9 delivers the borough's highest yield at 5.5% versus WA10's 4.9%. That 0.6 percentage point gap is worth examining alongside the rental data in the next section.
L34 Prescot at £294,348 is the most expensive postcode, sitting over £43,000 above the next highest. Prescot is a distinct town with its own character. The Shakespeare North Playhouse (opened 2022) has brought cultural investment, and proximity to the M57 motorway connects residents to Liverpool. But asking prices of almost £295,000 compress the yield to 4.4%, the lowest in the borough.
The mean asking price across all eight St Helens postcodes is £231,449. That figure appears in the comparison section later, where St Helens is measured against Liverpool, Birkenhead, Wigan, and Warrington. For investors looking for below market value properties, the WA10 and WA9 postcodes offer entry points close to the Land Registry sold price average of £179,209.

House Price Growth in St Helens
Seven of St Helens' eight postcodes delivered five-year growth above 18%, with L35 Whiston and Rainhill leading at 29.7%. For buy-to-let investors, the five-year figure matters most. It captures a full market cycle and filters out short-term noise. One-year growth can swing on a handful of transactions. Five years tells you whether an area is genuinely appreciating.
An investor who bought a £186,000 property in L35 five years ago would be sitting on a property now asking £242,070. That is £56,000 in equity growth from an area that also delivers a 5.2% gross yield.
| Area | 1 Year | 3 Years | 5 Years |
|---|---|---|---|
| L35 (Whiston, Rainhill) | -5.5% | 2.4% | 29.7% |
| WA11 (Haydock, Rainford) | 1.1% | 5.7% | 29.2% |
| WN5 (Billinge, Orrell) | 1.2% | 12.2% | 28.6% |
| WN4 (Ashton-in-Makerfield) | 2.1% | 9.9% | 25.0% |
| WA9 (St Helens South, Sutton) | -5.8% | 10.1% | 24.1% |
| WA12 (Newton-le-Willows, Earlestown) | 3.6% | 7.4% | 22.2% |
| WA10 (St Helens Centre, Eccleston) | -2.3% | 7.4% | 18.3% |
| L34 (Prescot) | -12.3% | -8.6% | 6.7% |
The top three growth postcodes are all on the borough's eastern and southern edges. L35 (29.7%), WA11 (29.2%), and WN5 (28.6%) are semi-rural and suburban areas with good road links to both Liverpool and Wigan. These areas attracted buyers during the pandemic stamp duty holiday who were looking for space and affordability. The growth has been sustained through the three-year window too, suggesting it is not a one-off pandemic spike.
L34 Prescot at 6.7% five-year growth is the clear outlier. The one-year figure of -12.3% and three-year figure of -8.6% tell a story of recent price correction. Prescot is the most expensive postcode in the borough, and it appears to be repricing after the pandemic surge pushed values too high relative to local demand. The -12.3% annual decline is the steepest in the borough.
WN5 stands out for three-year growth. At 12.2%, it has the strongest three-year figure in the borough, suggesting momentum is building rather than fading. Combined with 28.6% five-year growth and a 4.6% yield, WN5 Billinge and Orrell is delivering consistent appreciation from a mid-range price point of £220,191.
Monthly Property Sales in St Helens
If you need to sell a buy-to-let property, can you? Transaction volumes answer that question. St Helens sees 229 property transactions per month across all eight postcodes, with WN4 Ashton-in-Makerfield posting a 135% turnover rate. That turnover figure means properties change hands faster than new stock comes to market. Monthly sales range from 15 in L34 to 43 in WA10.
| Area | Sales Per Month | Turnover | Asking Price |
|---|---|---|---|
| WA10 (St Helens Centre, Eccleston) | 43 | 82% | £198,928 |
| WA9 (St Helens South, Sutton) | 38 | 22% | £200,860 |
| WA11 (Haydock, Rainford) | 35 | 20% | £250,948 |
| WN5 (Billinge, Orrell) | 31 | 23% | £220,191 |
| WN4 (Ashton-in-Makerfield) | 24 | 135% | £215,489 |
| L35 (Whiston, Rainhill) | 22 | 15% | £242,070 |
| WA12 (Newton-le-Willows, Earlestown) | 21 | 30% | £228,757 |
| L34 (Prescot) | 15 | 92% | £294,348 |
WA10 leads on volume with 43 sales per month and an 82% turnover rate. The town centre postcode has the deepest buyer pool in the borough. Combined with the lowest asking price (£198,928) and cheapest price per square foot (£181), WA10 gives investors a liquid market with strong exit options.
L35 Whiston and Rainhill has the lowest turnover at 15% despite 22 sales per month. That tells you there is a large pool of housing stock that rarely comes to market. Owners hold long-term in this area, which is popular with families working at Whiston Hospital and commuting to Liverpool. If you are buying to hold for ten years or more, the low turnover signals that other owners have the same strategy.
WN4 at 135% turnover is an anomaly worth investigating. A turnover rate above 100% means properties are selling faster than new stock is listed. Ashton-in-Makerfield sits on the Wigan border and benefits from dual demand: St Helens and Wigan buyers competing for the same stock. For exit strategy planning, WN4 and WA10 offer the strongest combination of demand and liquidity.
Property Data Sources
Our location guide relies on diverse, authoritative datasets including:
- HM Land Registry UK House Price Index
- Ministry of Housing, Communities and Local Government
- Ordnance Survey Data Hub
- Propertydata.co.uk
We update our property data quarterly to ensure accuracy. Last update: March 2026. All data is presented as provided by our sources without adjustments or amendments.

St Helens Rental Market Analysis
For investors weighing up whether rental property is a worthwhile investment in St Helens, the data below breaks down average monthly rents and gross rental yields across the borough's postcodes.
Rental data is available for all 8 postcodes. Monthly rents range from £810 in WA10 to £1,081 in L34 and gross yields range from 4.4% to 5.5%. If you are looking to build a property portfolio in the North West, St Helens' combination of affordable entry prices, complete rental data coverage, and consistent yields across every postcode makes it a straightforward market to analyse.
Average Rent & Gross Rental Yields in St Helens
Gross rental yield is calculated from the average asking price and average monthly rent for each postcode. It does not account for void periods, maintenance, management fees, or mortgage costs. It is a starting point for comparison, not a profit forecast. For a deeper explanation of how rental yield is calculated, see our standalone guide. WA9 delivers St Helens' highest gross yield at 5.5%, where monthly rents of £923 meet asking prices of £200,860.
At the other end, L34 Prescot at 4.4% reflects the borough's highest asking prices absorbing the highest absolute rents. The yield spread across St Helens is just 1.1 percentage points. That tight range means there is no single postcode dramatically outperforming the rest. The entire borough delivers moderate, consistent returns.
| Area | Average Monthly Rent | Average Asking Price | Gross Yield |
|---|---|---|---|
| WA9 (St Helens South, Sutton) | £923 | £200,860 | 5.5% |
| L35 (Whiston, Rainhill) | £1,057 | £242,070 | 5.2% |
| WN4 (Ashton-in-Makerfield) | £940 | £215,489 | 5.2% |
| WA10 (St Helens Centre, Eccleston) | £810 | £198,928 | 4.9% |
| WA12 (Newton-le-Willows, Earlestown) | £918 | £228,757 | 4.8% |
| WA11 (Haydock, Rainford) | £971 | £250,948 | 4.6% |
| WN5 (Billinge, Orrell) | £850 | £220,191 | 4.6% |
| L34 (Prescot) | £1,081 | £294,348 | 4.4% |
Three postcodes sit at or above 5.2% gross yield: WA9, L35, and WN4. Each taps into a different tenant pool. WA9 draws working families and tenants connected to the town centre. L35 benefits from Whiston Hospital and the Liverpool commuter corridor. WN4 Ashton-in-Makerfield sits on the Wigan border and attracts tenants from both boroughs. That diversity of demand across three distinct areas is a strength for investors building a multi-property portfolio.
L34 commands the highest absolute rent in St Helens at £1,081 per month but delivers the lowest yield at 4.4%. Prescot's asking prices of £294,348 absorb the strong rent. The yield compression means L34 works for investors looking for tenant quality and long-term appreciation rather than income.
WA10 at 4.9% is worth noting. It has the lowest asking price in the borough (£198,928) and the lowest rent (£810). The rent is low because WA10 includes the town centre where smaller terraced stock dominates. But 4.9% from a £59,679 deposit is a reasonable return for the most liquid postcode in St Helens.
Is St Helens Rent High?
Rent affordability matters from both sides. For tenants, it determines whether they can sustain payments long-term. For landlords, areas where rent consumes a lower share of income tend to produce more reliable tenants and fewer arrears. Across all eight St Helens postcodes, rent ranges from 26.1% to 34.8% of the local median gross monthly salary.
The median gross weekly salary in St Helens is £717.40, which equates to £3,109 per month or £37,306 per year. This is marginally below the North West regional median of £720.10 per week and below the Great Britain median of £752.40 per week. Data from the Nomis Labour Market Profile (ASHE 2025). The general benchmark is that rent becomes stretched above 30% of gross income. Four postcodes sit above that level and four sit below, with two comfortably under 30%.
| Rank | Area | Rent as % of Income |
|---|---|---|
| 1 | L34 (Prescot) | 34.8% |
| 2 | L35 (Whiston, Rainhill) | 34.0% |
| 3 | WA11 (Haydock, Rainford) | 31.2% |
| 4 | WN4 (Ashton-in-Makerfield) | 30.2% |
| 5 | WA9 (St Helens South, Sutton) | 29.7% |
| 6 | WA12 (Newton-le-Willows, Earlestown) | 29.5% |
| 7 | WN5 (Billinge, Orrell) | 27.3% |
| 8 | WA10 (St Helens Centre, Eccleston) | 26.1% |
L34 and L35 at 34.8% and 34.0% sit above the 30% threshold. These are higher-rent areas (£1,081 and £1,057 per month respectively) attracting tenants who typically earn above the borough median. Hospital staff at Whiston and professionals commuting to Liverpool are not on £37,306. The median salary is a borough-wide figure that understates what tenants in these postcodes actually earn.
WA9 at 29.7% sits just below the 30% threshold. That is close to the sweet spot for investors. Rents are high enough to deliver the best yield in St Helens (5.5%) but close enough to the affordability line that most working tenants can pay reliably. WA10 at 26.1% is the most affordable postcode, which aligns with its lower absolute rents and town centre location.
Four of eight postcodes sit below 30%. That is a strong affordability profile for a buy-to-let market. Tenants in most of St Helens are paying rents within their means, which translates to lower arrears and more stable income for landlords.
Thinking of Buying?
We have off-market investment properties averaging 8%+ annual yield.
View Property DealsBuy-to-Let Considerations
Are St Helens House Prices High? Price-to-Earnings Ratios
The price-to-earnings ratio compares a postcode's average asking price to the local median annual salary. Lower ratios mean more affordable entry points relative to local wages. The national benchmark is 7.5x, calculated from England's average sold price of £291,865 against Great Britain's median annual salary of £39,125. In St Helens, that ratio ranges from 5.3x to 7.9x, with 7 of 8 postcodes below the national benchmark.
This is based on the Nomis Labour Market Profile for St Helens showing the median gross annual income for St Helens residents is £37,306.
Seven of St Helens' eight postcodes sit below the national benchmark of 7.5x. Only L34 Prescot at 7.9x sits above it, and even that is barely stretched. St Helens is one of the most affordable boroughs in England by this measure.
| Rank | Area | Price-to-Earnings Ratio |
|---|---|---|
| 1 | WA10 (St Helens Centre, Eccleston) | 5.3x |
| 2 | WA9 (St Helens South, Sutton) | 5.4x |
| 3 | WN4 (Ashton-in-Makerfield) | 5.8x |
| 4 | WN5 (Billinge, Orrell) | 5.9x |
| 5 | WA12 (Newton-le-Willows, Earlestown) | 6.1x |
| 6 | L35 (Whiston, Rainhill) | 6.5x |
| 7 | WA11 (Haydock, Rainford) | 6.7x |
| 8 | L34 (Prescot) | 7.9x |
WA10 and WA9 at 5.3x and 5.4x are the most affordable entry points in the borough. These are the same postcodes that deliver strong yields (4.9% and 5.5% respectively). Affordable entry prices relative to local wages and reliable rental returns in the same postcodes is a combination that supports sustainable buy-to-let investment.
L34 at 7.9x is the only postcode above the national benchmark. Prescot's higher asking prices push the ratio above 7.5x, but only just. Compare this to cities like Bristol, where many postcodes sit above 10x, or London, where ratios regularly exceed 15x. Even St Helens' most expensive postcode is more affordable than the England average.
Deposit Requirements in St Helens
Most buy-to-let mortgage lenders require a minimum 25% deposit. The table below uses a more conservative 30% to reflect the rates and products available at higher loan-to-value ratios. A 30% deposit typically unlocks better interest rates, which matters for cash flow in a yield-driven market. At 30%, St Helens' deposit requirements range from £59,679 in WA10 to £88,304 in L34, with 5 of 8 postcodes under £70,000.
| Rank | Area | 30% Deposit Required |
|---|---|---|
| 1 | WA10 (St Helens Centre, Eccleston) | £59,679 |
| 2 | WA9 (St Helens South, Sutton) | £60,258 |
| 3 | WN4 (Ashton-in-Makerfield) | £64,647 |
| 4 | WN5 (Billinge, Orrell) | £66,057 |
| 5 | WA12 (Newton-le-Willows, Earlestown) | £68,627 |
| 6 | L35 (Whiston, Rainhill) | £72,621 |
| 7 | WA11 (Haydock, Rainford) | £75,284 |
| 8 | L34 (Prescot) | £88,304 |
WA9 at £60,258 stands out as the strongest value entry in the table. It requires a similar deposit to WA10 (just £579 more) but delivers the highest yield in the borough at 5.5% and 24.1% five-year growth. The extra £579 over WA10's deposit buys access to a significantly better-performing postcode on yield.
A clear gap separates the sub-£70,000 tier from the rest. WA10, WA9, WN4, WN5, and WA12 all sit below £69,000. L35 at £72,621 is the next step up, followed by WA11 at £75,284 and L34 at £88,304. For investors with limited capital, the five cheapest postcodes all deliver yields between 4.6% and 5.5%. Strong rental returns are available without stretching into the higher deposit brackets. Investors exploring no-deposit investment property structures will find St Helens' low entry prices make creative financing more viable than in higher-priced boroughs.
Deposit is only part of the upfront cost. Budget for stamp duty (use our stamp duty calculator for an accurate figure), legal fees, and survey costs. For a full breakdown, see our guide to buy-to-let costs.

What the St Helens Data Tells Buy-to-Let Investors
For yield, the numbers favour WA9 (5.5%), L35 (5.2%), and WN4 (5.2%). All three sit below 6.5x price-to-earnings with 30% deposits between £60,258 and £72,621. WA9 stands out: highest yield, strong five-year growth (24.1%), and a deposit of £60,258. L35 benefits from hospital and commuter demand. WN4 attracts tenants from both St Helens and Wigan.
For growth, the outer postcodes lead. L35 (29.7%), WA11 (29.2%), and WN5 (28.6%) delivered the strongest five-year appreciation. These are suburban and semi-rural areas that benefited most from the pandemic-era shift towards space and affordability. The growth pattern has sustained through the three-year data too, suggesting it is not fading.
L34 Prescot shows weaker numbers across multiple measures. The five-year growth of 6.7% is the lowest in the borough, the one-year figure of -12.3% is the steepest decline, and the yield of 4.4% sits at the bottom of the table. Transaction volume is also the lowest at 15 sales per month. Prescot is the most expensive postcode in St Helens with asking prices of £294,348. The data shows a market that may be repricing after over-extending during the pandemic surge.
Investors buying investment property in St Helens can access off-market property that does not appear on the open portals. St Helens does not currently operate a selective licensing scheme, which reduces ongoing regulatory costs for private landlords.
How St Helens Compares
St Helens' mean monthly rent of £944 is higher than Liverpool (£870), Birkenhead (£797), and Wigan (£892), despite sitting mid-table on price. The table below compares St Helens against four nearby North West locations using the same methodology: mean asking price across all postcodes, mean monthly rent across postcodes with data, and top single-postcode gross yield.
| Location | Mean Asking Price | Mean Monthly Rent | Top Gross Yield |
|---|---|---|---|
| Liverpool | £207,760 | £870 | 7.4% |
| Birkenhead | £211,192 | £797 | 7.2% |
| Wigan | £227,201 | £892 | 5.6% |
| St Helens | £231,449 | £944 | 5.5% |
| Warrington | £311,729 | £1,068 | 4.7% |
St Helens sits in the middle of this group on price but stands out on rent. At £944 mean monthly rent, St Helens commands more than Liverpool (£870), Birkenhead (£797), and Wigan (£892) despite having a higher mean asking price. That tells you tenants in St Helens are paying a premium for what the borough offers: suburban space, good transport links, and proximity to both Liverpool and Manchester without city centre living costs.
Liverpool and Birkenhead offer significantly higher top yields (7.4% and 7.2%), but those headline figures come from specific high-yield postcodes. St Helens' tighter yield spread (4.4% to 5.5%) means every postcode delivers a consistent return. In Liverpool, the gap between the highest and lowest yield is wider, meaning postcode selection matters more. For investors who want predictability across a portfolio, St Helens' consistency has value.
Warrington requires substantially more capital for a lower top yield. Mean asking prices of £311,729 mean a 30% deposit of over £93,500, compared to St Helens' entry from £59,679. For investors comparing the best buy-to-let locations in the North West, the decision between St Helens and its neighbours depends on whether you are optimising for headline yield (Liverpool, Birkenhead), growth and consistency (St Helens, Wigan), or tenant quality and capital growth (Warrington).
Frequently Asked Questions
How does St Helens compare to Liverpool for buy-to-let?
Liverpool delivers higher top yields (7.4% vs 5.5%) and lower mean asking prices (£207,760 vs £231,449), but St Helens commands higher mean monthly rents (£944 vs £870) and stronger five-year growth across its postcodes, with 7 of 8 areas above 18%. Liverpool also has a deeper pool of student and city centre rental demand.
St Helens has complete rental data for every postcode, making analysis more straightforward. Liverpool's yield spread is wider, meaning the right postcode delivers more but the wrong one delivers less. For investors comparing both, see our Liverpool buy-to-let guide for the full postcode breakdown.
Are there property investment companies operating in St Helens?
Yes, several firms market buy-to-let properties in the wider Merseyside area, including St Helens. Be cautious with any company offering guaranteed yields or sourcing fees above 2-3% of purchase price. The data in this guide covers the open market. Any property sold through an investment company can be benchmarked against these postcode averages, but averages do not guarantee individual property values.
What impact will Glass Futures and Project HALO have on St Helens property prices?
The full impact is not yet reflected in the data, but early indicators are positive. Glass Futures (£54m) opened in 2023 and is already operational, attracting international glass research partners to St Helens. Project HALO secured planning approval in October 2025 and targets the life sciences sector. The five-year growth figures in this guide (up to 29.7% in L35) predate HALO's approval. Investors positioning early may benefit from price growth as these projects generate skilled employment, but the timeline for full economic impact is measured in years, not months.
Can I find buy-to-let property in St Helens under £150,000?
Yes. The Land Registry average for terraced houses in St Helens is £149,115, confirming that sub-£150,000 stock exists. The average asking prices in this guide range from £198,928 (WA10) to £294,348 (L34), but these are postcode averages across all property types. Individual terraced houses and flats in WA9 and WA10 list below £150,000, particularly older terraces and ex-local authority stock. Lender repossessed properties occasionally appear in these postcodes at further discounts. At that price point, a 30% deposit is under £45,000. Check condition, lease terms (for flats), and actual tenant demand before committing at the lower end of the market. For more options at lower price points, see our guide to the cheapest places to buy a house in England.
Is Thatto Heath a good area for buy-to-let in St Helens?
Thatto Heath falls within WA9, the highest-yielding postcode in St Helens at 5.5% gross with 24.1% five-year growth. WA9 covers St Helens South including Sutton, Thatto Heath, and surrounding areas. Asking prices average £200,860 with a 30% deposit of £60,258. The postcode also has 38 sales per month, indicating a liquid market. WA9 performs well across all the metrics in this guide, but individual streets within Thatto Heath vary. Ground-level research on specific properties is always necessary.