
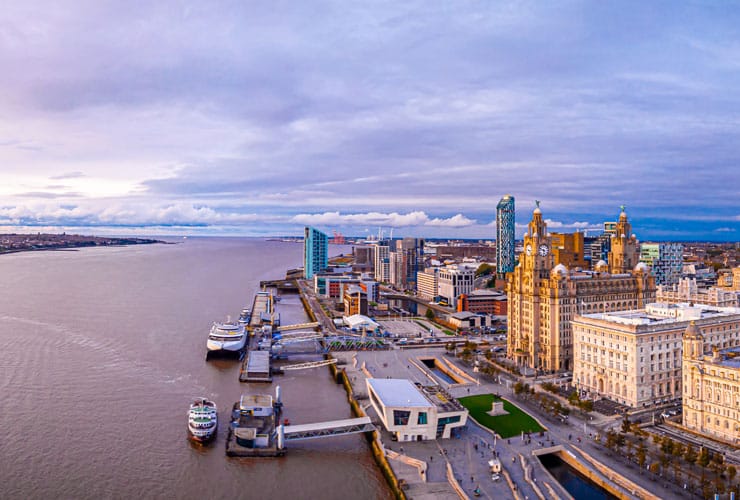
Most Expensive Streets in Liverpool: Top 10
The most expensive street in Liverpool is Shireburn Road in Formby, where three standard residential sales since 2020 average £1,528,333. The highest individual sale is a different answer to a different question: £3,971,025 for a freehold terraced property on Lindale Road in the L7 postcode. This page shows both, street by street, on the latest Land Registry data.
We analysed 53,200 standard residential sales recorded in the latest HM Land Registry price paid data for the Liverpool postal town, covering January 2020 to May 2026. Streets were ranked by average sold price, and each needed at least two qualifying sales to make the list. If it is the wider investable market you are weighing up rather than the very top end, our Liverpool buy-to-let guide covers the rest of the city in the same data-led way.
Article updated: July 2026
Formby's grip on the top end is the story. Four of the ten streets sit in the L37 postcode, including the top-averaging street and the busiest, and the rest of the list spreads across L25 around Woolton, plus single entries in L19, L18 and L23. Between them, these ten streets recorded average sold prices from £1.02 million to £1.53 million, and below we run through the full top ten, the highest individual sales on each street, the total value changing hands, and where that cluster sits next to the rest of the Liverpool market.
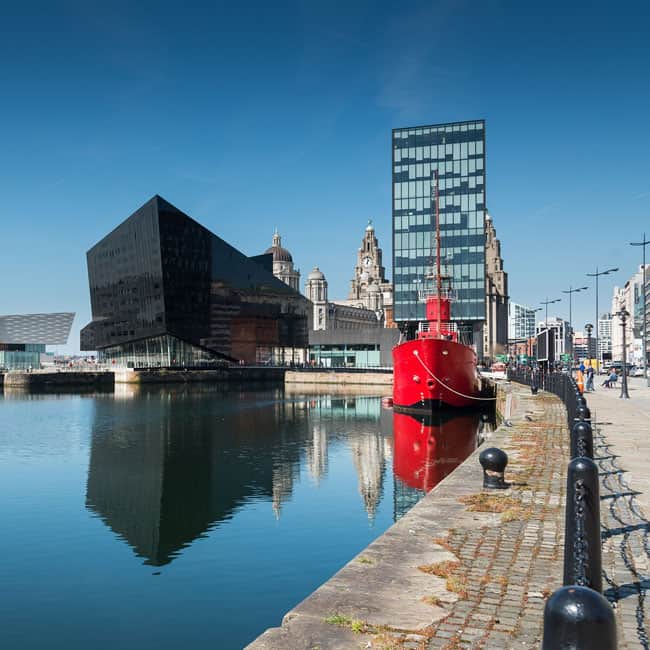
Top 10 Most Expensive Streets in Liverpool
Updated July 2026
Date range: 1st January 2020 to 26th May 2026. Based on the latest Land Registry price paid data at the time of research. This table includes standard residential sales only (Category A transactions) to reflect genuine home purchases rather than portfolio or commercial acquisitions.
| Street Name | Postcode | Average Price | Transactions |
|---|---|---|---|
| 1. Shireburn Road, Formby | L37 | £1,528,333 | 3 |
| 2. Cabot Green | L25 | £1,425,000 | 2 |
| 3. Victoria Road, Formby | L37 | £1,214,321 | 32 |
| 4. Grange Lane, Formby | L37 | £1,189,000 | 5 |
| 5. South Road, Grassendale Park | L19 | £1,146,250 | 4 |
| 6. Elm Avenue | L23 | £1,078,750 | 2 |
| 7. Courtenay Road, Woolton | L25 | £1,075,333 | 3 |
| 8. Runnymede Close | L25 | £1,074,000 | 5 |
| 9. Mayfield Court, Formby | L37 | £1,024,000 | 5 |
| 10. Winterhill Close | L18 | £1,018,750 | 4 |
Note: Only streets with two or more standard residential sales in this period are included in this table. Localities are shown where the Land Registry record states them.
Formby supplies four of the ten streets, including Shireburn Road at the top and Victoria Road, the busiest premium street in the city. The rest of the list runs through L25 around Woolton, with single entries from Grassendale Park (L19), the L18 district and L23. It is a tightly held market: across all ten streets, just 65 sales completed in nearly six and a half years, and two of the streets reached the list on two sales apiece. That is why the sale count sits beside every average, and why the profiles that follow read the underlying sales rather than trusting a headline figure on its own.
Shireburn Road, Formby (L37)
Three sales put Shireburn Road at the top: £1,110,000 in June 2021, a £2,000,000 sale in July 2024, and £1,475,000 in March 2026. That most recent transaction means the street's £1,528,333 average is not a relic of one hot year. Buyers were still paying seven figures here in spring 2026.
Cabot Green (L25)
Second place rests on two sales that could hardly be further apart: £2,100,000 in June 2023 and £750,000 in August 2025. The average of £1,425,000 lands midway between them and describes neither. A two-sale street where one sale is nearly three times the other is exactly the case for reading the count beside the average, and Cabot Green's ranking rests on that single £2.1 million transaction.
Victoria Road, Formby (L37)
If the question is where Liverpool's million-pound market actually trades, Victoria Road is the answer. Its 32 sales since January 2020 span an enormous range, from £250,000 up to a £3,100,000 sale in March 2020 that stood as the street's peak. Five separate transactions reached £2 million or more, the most recent in July 2025. The register even lists two identical £1,870,000 sales on the same day in January 2021, which we show as they appear in the source data. One road covering several price brackets at once is why volume and average are worth reading together.
Grange Lane, Formby (L37)
Grange Lane shows why averages need reading with care. Four of its five sales completed between £425,000 and £575,000 across 2020 to 2022. The fifth was a £3,900,000 sale in July 2024, the largest single transaction on any ranked street, and it alone lifts the street's average to £1,189,000.
Liverpool's Highest Individual Property Sales
Most Expensive Roads in L7: Lindale Road Holds the Record Sale
The single most expensive residential sale in the whole dataset did not happen in Formby, Woolton or Grassendale Park. It happened in L7. A freehold terraced property on Lindale Road sold for £3,971,025 in October 2023, and because the city-wide record is identified before the two-sale threshold is applied, Lindale Road holds the record without appearing in the ranked table. On this measure the most expensive sale in L7, and in the entire Liverpool dataset, belongs to a terraced property rather than a detached mansion. The price outstrips every ranked street's average, and the transaction is there to check in the Land Registry's public records.
Below the record, these are the biggest single sales recorded on each of the ten ranked streets:
| Street Name | Postcode | Highest Sale | Sale Date |
|---|---|---|---|
| Grange Lane | L37 | £3,900,000 | July 2024 |
| Victoria Road | L37 | £3,100,000 | March 2020 |
| Cabot Green | L25 | £2,100,000 | June 2023 |
| Shireburn Road | L37 | £2,000,000 | July 2024 |
| Courtenay Road | L25 | £1,645,000 | May 2024 |
| South Road | L19 | £1,600,000 | March 2025 |
| Runnymede Close | L25 | £1,500,000 | December 2020 |
| Elm Avenue | L23 | £1,407,500 | December 2025 |
| Mayfield Court | L37 | £1,385,000 | July 2020 |
| Winterhill Close | L18 | £1,312,500 | October 2023 |
Note: This table shows the single highest standard residential (Category A) sale on each street in the top ten, ranked by price.
Grange Lane's £3,900,000 leads the ranked streets, and Victoria Road's £3,100,000 is close behind. The current number one, Shireburn Road, earns its place at the top end as well as on average with a £2,000,000 sale in July 2024. Below those, the street records bunch between £1.3 million and £1.65 million, which is what happens when a market's biggest cheques are spread across a handful of quiet streets rather than concentrated on one.
Liverpool's Record Streets: Total Value of Property Sales
Average price, record sale and total value answer three different questions. The average finds the priciest addresses; the record finds the single biggest cheque; the total finds where the most money changed hands. Within the top ten, one street is in a category of its own.
| Street Name | Postcode | Total Value | Transactions |
|---|---|---|---|
| 1. Victoria Road | L37 | £38,858,269 | 32 |
| 2. Grange Lane | L37 | £5,945,000 | 5 |
| 3. Runnymede Close | L25 | £5,370,000 | 5 |
| 4. Mayfield Court | L37 | £5,120,000 | 5 |
| 5. Shireburn Road | L37 | £4,585,000 | 3 |
| 6. South Road | L19 | £4,585,000 | 4 |
| 7. Winterhill Close | L18 | £4,075,000 | 4 |
| 8. Courtenay Road | L25 | £3,226,000 | 3 |
| 9. Cabot Green | L25 | £2,850,000 | 2 |
| 10. Elm Avenue | L23 | £2,157,500 | 2 |
Note: Total value is the sum of every standard residential (Category A) sale on the street in this window, computed across the ten ranked streets.
Victoria Road's 32 sales sum to £38.9 million, more than six times any other street in the top ten, which is what depth of activity looks like next to streets that trade two or three times a decade. But the highest total street value anywhere in the Liverpool postal town belongs to Regent Road (L3), where 130 standard sales added up to £45.8 million over the window. Regent Road never reaches the most-expensive-street ranking because its per-sale average sits far below the top ten, but as a long dockside road of many homes it is where the most money changed hands. Average and total measure genuinely different things.
Where Do Liverpool's Wealthy Actually Live?
Search for the posh areas of Liverpool or the richest part of Liverpool and most lists name the same familiar suburbs. The sold-price data is more specific. Between January 2020 and May 2026, the highest street averages in the Liverpool postal town sat in two kinds of places: Formby, and a short list of streets across the L25, L19, L18 and L23 districts.
Formby (L37)
If Liverpool has a millionaires' row, the data says it is Victoria Road in Formby: 32 sales, five of them at £2 million or more, and a £3.1 million peak. Formby is a coastal town beside the National Trust's Formby reserve with its sand dunes, pinewoods and red squirrel population. Shireburn Road, Grange Lane and Mayfield Court fill out four of the top ten between them alongside Victoria Road, all carrying an L37 postcode.
Woolton, Grassendale Park and the southern suburbs
Beyond Formby, the premium sales run through L25, L19 and L18. In L25, Cabot Green's £1,425,000 average puts it second overall, with Woolton's Courtenay Road and its L25 neighbour Runnymede Close close behind at £1,075,333 and £1,074,000. Grassendale Park's South Road is the L19 entry at £1,146,250, and Winterhill Close in L18 averaged £1,018,750 across four sales.
Elm Avenue (L23)
Elm Avenue is the only L23 entry, sixth at £1,078,750. Its two sales sit at opposite ends of the window and of the price range: £750,000 in April 2022 and £1,407,500 in December 2025, the more recent by some distance. On a two-sale street that gap is the whole story, and it is why the count is published beside the average.
For anyone researching Liverpool as an investment property market rather than a place to buy a family home, these streets are the exception, not the pattern. Most recorded five sales or fewer across the whole window, and the analysis ranked 6,066 eligible streets in total, meaning the other 6,056 all averaged below Winterhill Close's £1,018,750.
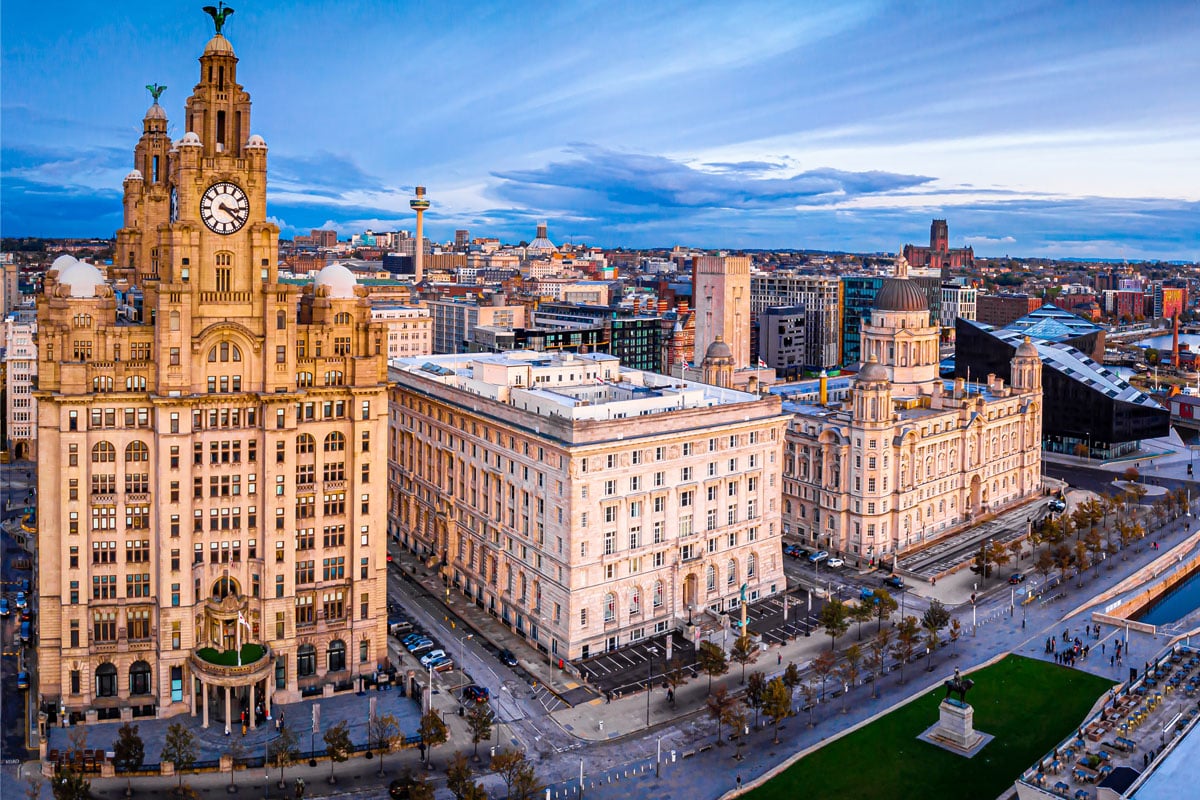
This ranking measures sold prices, not rents or yields. For that side of the market, our Liverpool buy-to-let guide covers postcode-by-postcode sold prices, rents and yields across the wider city. The wider market that guide covers sits well below this ranking's £1.02 million entry point, and that gap is the practical use of knowing where the top end sits. Our ranking of the cheapest areas of Liverpool starts from the opposite end, and on average asking prices the lowest district wholly inside the city is L4, which covers Anfield, Kirkdale and Walton. To see how Liverpool's yields compare with Manchester, Birkenhead and the rest of the UK, our page on the best rental yields in the UK puts them all on the same basis.
How to Find the Most Expensive Streets in Liverpool
Here is the step by step process we followed to pull every high-value sale across the Liverpool postal town. You can repeat it for any town or city in England and Wales.
- Visit the HM Land Registry price paid data set.
- Enter LIVERPOOL in the town field. That is why Formby addresses appear: they carry the Liverpool postal town.
- Select the four residential property types: detached, semi-detached, terraced and flat/maisonette. Leave out "other", which often captures commercial buildings.
- Keep the transaction category to standard price paid entries, which excludes portfolio deals and other non-standard transfers.
- Set your date range. We used 1st January 2020 to the latest available data.
- Download the results and rank streets by average sold price, keeping the sale count beside each average so one transaction cannot masquerade as a street-wide figure.
Note: Check for duplicate rows before averaging. The register can record the same transaction more than once, and on streets with a handful of sales a duplicate can move the average significantly. Victoria Road records two same-day, same-price entries in January 2021; matching dates and prices do not prove duplication, so we have kept both as the distinct records the register lists.
Sold-price history is also the yardstick that matters when judging an asking price, because a discount only means something when it is measured against what actually completed. That holds whether the property is a seven-figure house in Formby or one of the below market value properties at the other end of the market. And for readers after the investor end of the city rather than the trophy end, our buy to let property for sale page lists deals across the UK.
Frequently Asked Questions
What is the most expensive street in Liverpool?
Shireburn Road in Formby, on the average of its three qualifying sales: £1,528,333. If you want the answer with real volume behind it, Victoria Road in Formby averaged £1,214,321 across 32 sales in the same window, more than six times the count of any other ranked street. If the question is the single most expensive transaction, that belongs to Lindale Road in L7, where a terraced house sold for £3,971,025 in October 2023.
What is the most expensive house sold in Liverpool?
A freehold terraced property on Lindale Road (L7) sold for £3,971,025 in October 2023. That is the highest standard residential sale anywhere in the Liverpool postal town between January 2020 and May 2026, and it happened on a street that does not qualify for the ranked table.
What is the most expensive area of Liverpool?
In this street-level ranking, L37 in Formby holds four of the top ten streets, including the top-averaging and the busiest. L25 around Woolton comes next with three ranked streets, with L19, L18 and L23 holding one place each.
Does Liverpool have a millionaires' row?
By the numbers, Victoria Road in Formby has the strongest claim. It recorded 32 sales since January 2020, five of them at £2 million or more, with a £3.1 million peak. No other ranked street combined that level of activity with those prices.
Why does a list about Liverpool include Formby?
Because the analysis matches the postal town as HM Land Registry records it, not the city-council boundary. Formby addresses are registered under the LIVERPOOL postal town, so they belong in the dataset. Treat it as a postal boundary rather than an administrative or colloquial one.
Why can a street with two sales rank above busier streets?
The ranking runs on average sold price, not total activity, with a minimum of two qualifying sales per street. In this dataset 1,141 streets were excluded for recording fewer than two. A two-sale average is a genuine reading but a small one, which is why the number of sales is published alongside every price in the table, and why the profiles above read the underlying sales in order.
Are these prices for residential properties only?
Yes. The analysis covers detached, semi-detached and terraced houses plus flats and maisonettes, sold freehold or leasehold, and filters to Category A standard residential transactions. That excludes the "other" property type, which often captures commercial buildings, along with portfolio purchases and non-standard transfers.
What period does this article cover?
HM Land Registry publishes new price paid data monthly, with individual sales recorded back to 1995. This July 2026 edition covers sales completed between 1 January 2020 and 26 May 2026. Its tables and analysis should be read together as that dated snapshot.
Can I access the full list of sold transactions?
Yes. The full dataset is free to search and download directly from HM Land Registry. Contains HM Land Registry data © Crown copyright and database right 2021. This data is licensed under the Open Government Licence v3.0. The same filters we describe above will reproduce every figure in this article.
Ready to buy property?
Browse investment properties with prices and gross yields shown for each opportunity.
See the latest deals