Where to Buy Property Investments in Woking: Yields of 5.1%
Woking's gross rental yields range from 3.8% to 5.1% across its five postcodes, with GU23 delivering the highest returns. Average sold prices sit 48.4% above the England average, and the borough's population grew 4.78% to 103,943 between the 2011 and 2021 censuses.
Woking's average sold price of £433,269 positions it as a premium commuter market, 14.4% above the South East regional average of £378,800. That places entry costs significantly higher than most buy-to-let locations, but local earnings of £43,719 per year sit 11.7% above the Great Britain median, supporting strong tenant purchasing power. All five postcodes have rental data, with monthly rents ranging from £1,599 in GU21 to £3,027 in GU23.
Woking is a commuter town in Surrey, South East England. This guide covers all 5 Woking postcodes from GU21 to KT14 under the Woking borough council (ONS code E07000217). The town sits 24 miles southwest of central London, connected by fast rail services to Waterloo. Investors comparing options in the county may also consider Guildford, Crawley, or Slough. Browse all our South East location guides.
Article updated: March 2026
Woking Buy-to-Let Market Overview 2026
Woking is a high-earning commuter town where average sold prices sit 48.4% above the England average, paired with negative annual price growth of -5.3% and gross yields up to 5.1%.
- Average sold price: £433,269 (48.4% above England's £291,865)
- Asking price range: £409,321 (GU21) to £717,422 (GU23)
- Rental yields: 3.8% (KT14) to 5.1% (GU23) across all 5 postcodes
- Rental income: Monthly rents from £1,599 (GU21) to £3,027 (GU23)
- Price per sq ft: Sold prices from £484/sq ft (GU21) to £563/sq ft (GU23)
- Market activity: Sales ranging from 7 per month (GU23) to 52 per month (GU21)
- Deposit requirements: 30% deposits range from £122,796 (GU21) to £215,227 (GU23)
- Affordability ratios: Property prices from 9.4 to 16.4 times Woking's median annual salary of £43,719
Contents

-
by Robert Jones, Founder of Property Investments UK
With two decades in UK property, Rob has been investing in buy-to-let since 2005, and uses property data to develop tools for property market analysis.

Property Data Sources
Our location guide relies on diverse, authoritative datasets including:
- HM Land Registry UK House Price Index
- Ministry of Housing, Communities and Local Government
- Ordnance Survey Data Hub
- Propertydata.co.uk
We update our property data quarterly to ensure accuracy. Last update: March 2026. All data is presented as provided by our sources without adjustments or amendments.
Why Invest in Woking?
Woking's population reached 103,943 in the 2021 Census, a 4.78% increase from 99,198 in 2011. That growth rate sits below the England average of 6.6%, reflecting an established and densely built borough where new housing supply is constrained by Green Belt boundaries on three sides.
Woking's employment rate of 82.4% sits above both the South East regional rate and the Great Britain rate. Median gross weekly earnings of £840.80 for Woking residents are 5.1% above the South East median of £800.30 and 11.7% above the Great Britain median of £752.40. These are commuter-level salaries. Woking's 24-minute fast train to London Waterloo makes the town a direct competitor to London for professional tenants who want space, a garden, and a Surrey address without inner London prices.
The borough's economy draws on financial services, technology, and professional services, with several major employers headquartered locally including McLaren Group in GU21 and Capgemini. The proximity to Heathrow Airport (30 minutes by road) adds corporate demand from international businesses.
Woking Economic Summary
- Population: 103,943 (2021 Census). Growth of 4.78% from 2011.
- Median annual salary: £43,719 (local), £41,616 (South East), £39,125 (Great Britain)
- Employment rate: 82.4% (local)
- Unemployment rate: Not available for this local authority
- Key employment sectors: Financial services, technology, professional services, automotive (McLaren)
Source: ONS Census 2021, Nomis Labour Market Profile (ASHE 2025, Employment 2021)
Regeneration and Investment in Woking
Over £700 million has been invested in Woking's town centre through the Victoria Place development alone, with a further 472 homes delivered through the Sheerwater regeneration. This investment came alongside a financial crisis that forced the borough to issue a Section 114 notice in June 2023. The projects below represent capital already deployed or in delivery.
- Victoria Place (Complete, £700m+): Woking's town centre was transformed by this mixed-use development featuring two residential towers of 34 and 32 storeys, a 23-storey Hilton Hotel, and retail space including a flagship Marks & Spencer. The development, completed in August 2022, added several hundred residential units and a hotel to the town centre. Updates at Woking Borough Council.
- Sheerwater Regeneration (Underway, 472 homes): This neighbourhood regeneration programme has delivered 472 sustainable homes (49% affordable), a new leisure centre with swimming pool, a 3G football pitch, and 29,000 sq ft of commercial space. The council is now refurbishing up to 110 additional properties for social housing. Updates at Woking Borough Council.
- West Hall, West Byfleet (Proposed, 461 homes): Barratt David Wilson Homes has proposed 461 houses and 15 traveller pitches on a former Green Belt site near West Byfleet in the KT14 postcode. The scheme includes over £4.5 million in community infrastructure contributions and went to public exhibition in February 2024. Updates at Surrey Live.

Woking Property Market Analysis
When was the last house price crash in Woking?
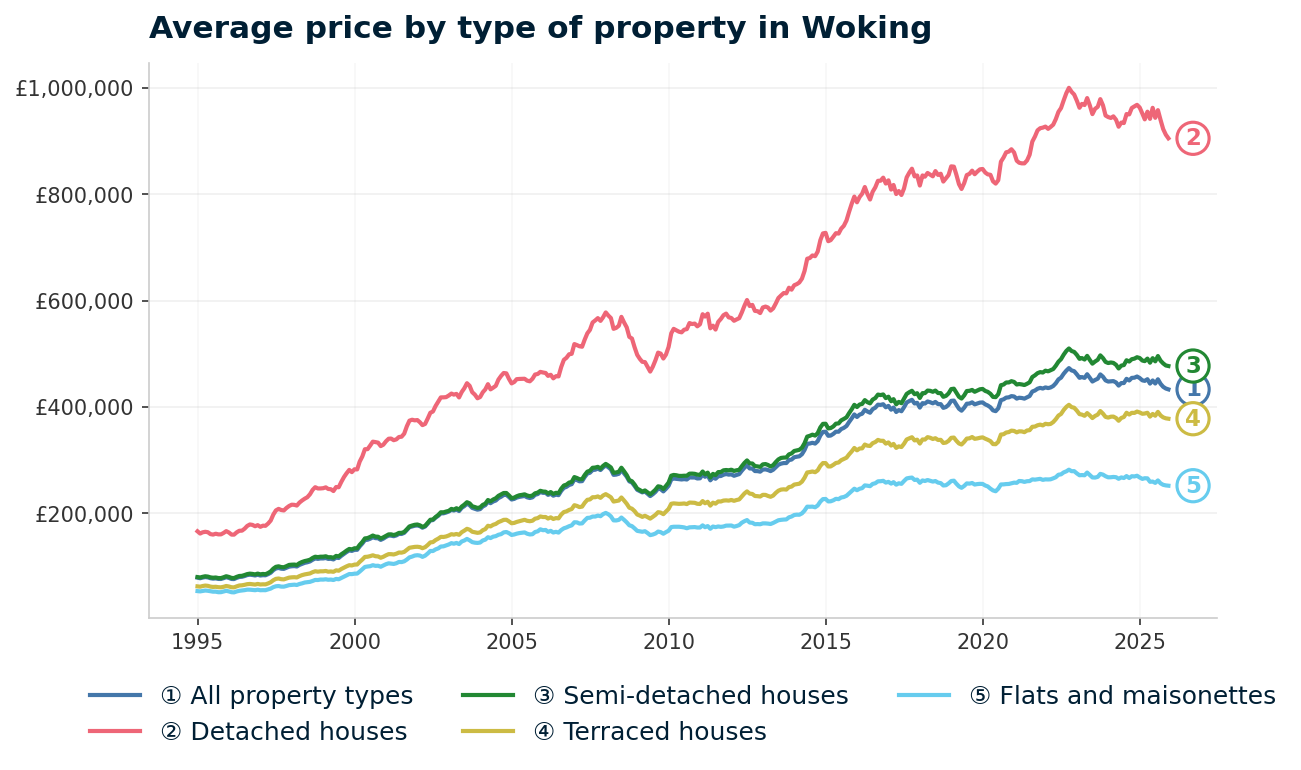
Woking's average house price has risen 446.5% over 30 years, from £79,274 in January 1995 to £433,269 in December 2025. Woking sits within the Woking borough council area, so all sold property prices from HM Land Registry are available at this level.
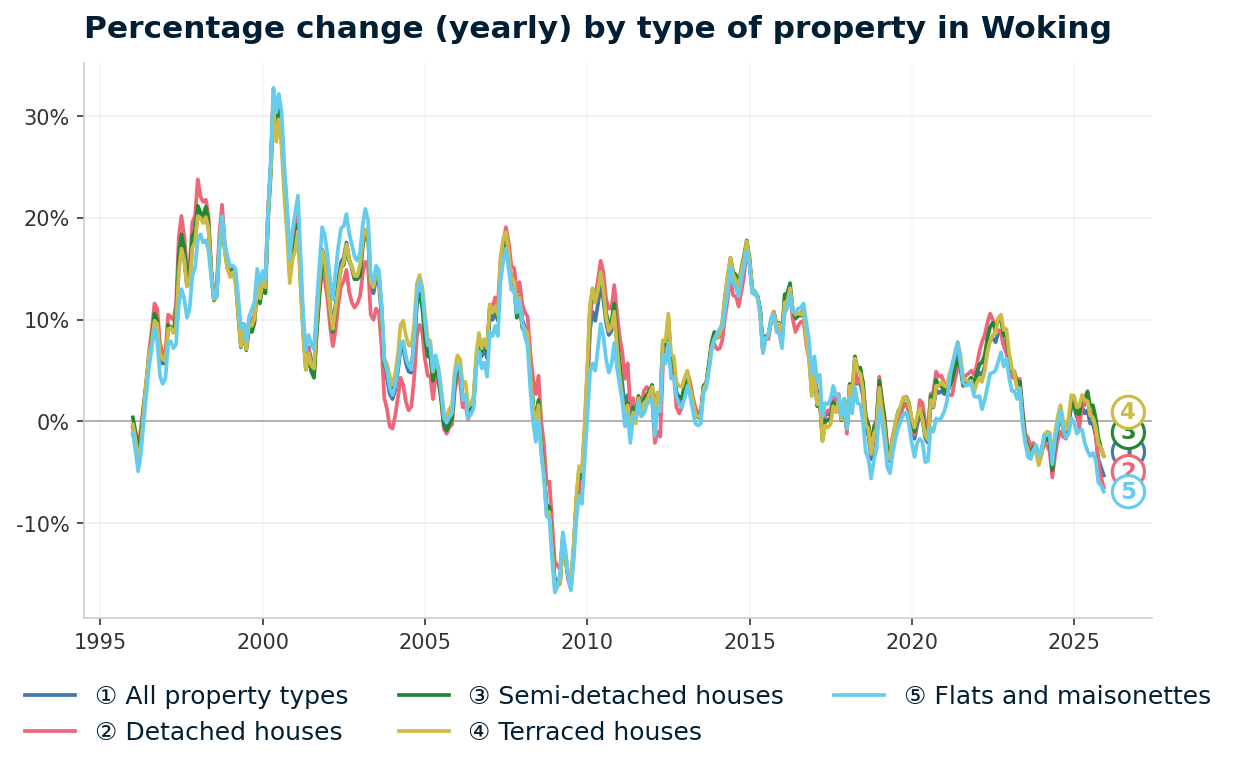
The last major crash saw prices peak at £290,174 in January 2008 before falling 19.8% to a trough of £232,631 by June 2009. That decline was broadly in line with the South East region's 20.0% fall and slightly steeper than England's 18.2% correction over the same period. The worst single annual change reading for Woking was -16.2% in July 2009.
Here is the full cycle-by-cycle breakdown of Woking's property prices from January 1995 to December 2025:
- 1995-2007 (The Boom): Woking's average price rose from £79,274 in January 1995 to £275,051 by mid-2007, a 247% increase driven by falling interest rates, expanding mortgage availability, and strong London commuter demand. Annual growth hit 16.9% by June 2007.
- 2008-2009 (The Financial Crisis): Prices peaked at £290,174 in January 2008 and fell to £232,631 by June 2009, a 19.8% decline. England fell 18.2% (from £183,883 to £150,438) and the South East fell 20.0% (from £240,647 to £192,598). Woking's worst annual reading was -16.2% in July 2009. All property types declined by roughly 15% at the trough, with detached houses falling from £577,932 to £466,746 (-19.2%) and flats from £200,974 to £159,230 (-20.8%).
- 2010-2013 (Stagnation and Recovery): Prices hovered between £232,000 and £285,000 through this period. By January 2013, Woking had reached £282,496, still below the 2008 peak. The recovery was gradual, with prices finally matching the pre-crash high of £290,174 in July 2012 at £290,464.
- 2014-2016 (Turning Point): Strong growth returned. By January 2014, prices reached £305,664 (annual growth 8.2%), and by January 2016, they hit £381,383 (annual growth 7.9%). London overspill demand and Help to Buy drove this acceleration.
- 2017-2019 (Pre-pandemic slowdown): Growth flattened as stamp duty surcharge (2016) and Brexit uncertainty cooled the market. By December 2019, prices had reached £408,393 with just 1.0% annual growth.
- 2020-2022 (Pandemic surge): After a brief dip to £392,308 in June 2020, the stamp duty holiday and work-from-home demand pushed Woking to its all-time high of £473,223 in October 2022, annual growth of 7.5% by December 2022.
- 2023 (Rate shock): Rising mortgage rates reversed the gains. Prices fell to £450,133 by December 2023, recording -3.7% annual change.
- 2024-2025 (Current correction): A brief recovery to £457,470 in December 2024 (+1.6% annual) was followed by a sharper decline. The latest data shows £433,269 in December 2025, with annual change of -5.3%. This is 8.4% below the October 2022 peak.
Long-term growth summary:
- 5 years (Dec 2020 to Dec 2025): 3.0% growth (£420,581 to £433,269)
- 10 years (Dec 2015 to Dec 2025): 12.2% growth (£386,114 to £433,269)
- 15 years (Dec 2010 to Dec 2025): 63.0% growth (£265,753 to £433,269)
- 20 years (Dec 2005 to Dec 2025): 80.3% growth (£240,288 to £433,269)
- 30 years (Jan 1995 to Dec 2025): 446.5% growth (£79,274 to £433,269)
Woking's long-term growth of 446.5% over 30 years reflects the persistent demand from London commuters. The more recent picture is weaker. Five-year growth of just 3.0% and a current annual decline of -5.3% show a market that ran hard during the pandemic but has given back those gains. The correction is steeper than England's current +1.7% annual growth and the South East's 0.0%, making Woking one of the sharper falling markets in the region right now.
Source: HM Land Registry House Price Index for Woking, January 1995 to December 2025.
Thinking of Buying?
We have off-market investment properties averaging 8%+ annual yield.
View Property DealsSold House Prices in Woking
Woking's average sold price of £433,269 sits 48.4% above the England average of £291,865. That £141,404 premium reflects Woking's position as a high-demand commuter town rather than a typical buy-to-let market. For context, the South East regional average is £378,800, so Woking is also 14.4% above its own region.
The premium varies dramatically by property type. Detached houses in Woking cost nearly double the England average, while flats carry a much narrower gap. That compression at the flat end of the market is where buy-to-let investors are most likely to find workable numbers.
| Property Type | Woking Average | England Average | Difference |
|---|---|---|---|
| Detached houses | £905,280 | £471,667 | +91.9% |
| Semi-detached houses | £477,156 | £289,135 | +65.0% |
| Terraced houses | £378,084 | £244,830 | +54.4% |
| Flats and maisonettes | £252,153 | £219,340 | +15.0% |
| All property types | £433,269 | £291,865 | +48.4% |
Detached houses at £905,280 carry a 91.9% premium over the England average of £471,667. Woking's detached stock sits in villages like Horsell, Pyrford, and the rural GU23 and GU24 postcodes where large plots and period properties push prices well into seven figures. Annual change for detached properties is -6.5%, the steepest decline of any type.
Semi-detached houses at £477,156 are 65.0% above England's £289,135. These are concentrated in the established residential areas of GU21 and GU22. Semi-detached stock is currently recording -3.4% annual change, a more moderate correction than detached homes.
Terraced houses at £378,084 sit 54.4% above England's £244,830. Terraced stock is relatively scarce in Woking compared to northern cities. The annual change reading of -3.4% matches semi-detached, suggesting the mid-market is correcting at a similar pace.
Flats and maisonettes at £252,153 carry only a 15.0% premium over England's £219,340. This is the narrowest gap of any property type. Woking's flat market includes the Victoria Place towers and purpose-built apartment blocks near the station. Annual change is -6.9%, the steepest of all property types, likely reflecting the new-build oversupply in the town centre.
Property Data Sources
Our location guide relies on diverse, authoritative datasets including:
- HM Land Registry UK House Price Index
- Ministry of Housing, Communities and Local Government
- Ordnance Survey Data Hub
- Propertydata.co.uk
We update our property data quarterly to ensure accuracy. Last update: March 2026. All data is presented as provided by our sources without adjustments or amendments.
Price Per Square Foot in Woking
Transaction-based sold prices per square foot in Woking range from £484 in GU21 to £563 in GU23. That £79 spread is relatively narrow for a five-postcode area, suggesting comparable build quality and housing stock across the borough. The exception is GU23 (Ripley, Send), where larger village homes on generous plots push the per-square-foot figure higher.
| Rank | Area | Price per sq ft |
|---|---|---|
| 1 | GU21 (Town Centre, Horsell) | £484 |
| 2 | GU22 (Old Woking, Pyrford) | £488 |
| 3 | KT14 (Byfleet, West Byfleet) | £489 |
| 4 | GU24 (Chobham, Bisley) | £534 |
| 5 | GU23 (Ripley, Send) | £563 |
GU21 has the lowest price per square foot at £484 despite being the town centre postcode. This reflects the volume of flats and smaller units around the station and Victoria Place, which bring the average down. GU23 and GU24, both rural postcodes with larger detached homes, command the highest figures at £563 and £534 respectively. The £79 gap between cheapest and most expensive is relatively narrow for a five-postcode area.
For Sale Asking Prices in Woking
Asking prices across Woking range from £409,321 in GU21 to £717,422 in GU23, with a mean of £559,571 across all five postcodes. That mean is considerably higher than the Land Registry sold price average of £433,269 because asking prices reflect current listings rather than completed transactions, and Woking's stock skews towards larger family homes in the outer postcodes.
| Rank | Area | Asking Price |
|---|---|---|
| 1 | GU21 (Town Centre, Horsell) | £409,321 |
| 2 | GU22 (Old Woking, Pyrford) | £510,779 |
| 3 | KT14 (Byfleet, West Byfleet) | £517,388 |
| 4 | GU24 (Chobham, Bisley) | £642,943 |
| 5 | GU23 (Ripley, Send) | £717,422 |
The £308,101 gap between GU21 (£409,321) and GU23 (£717,422) reflects two very different markets within the same borough. GU21 includes the town centre with its apartment stock and smaller terraced properties. GU23 covers the villages of Ripley and Send, where detached homes on large plots dominate the listings. For buy-to-let purposes, GU21's lower entry point and higher sales volume (52 per month versus 7 for GU23) present a more liquid market.

House Price Growth in Woking
Every Woking postcode shows negative 1-year growth, ranging from -1.8% in GU21 to -10.1% in GU22. This is a broad-based correction. No postcode is bucking the trend. Over five years, only GU21 (+2.9%) has delivered meaningful positive growth. Two postcodes (GU24 and KT14) are effectively flat, and GU22 has lost 4.5% over five years.
| Area | 1 Year | 3 Years | 5 Years |
|---|---|---|---|
| GU21 (Town Centre, Horsell) | -1.8% | +2.5% | +2.9% |
| KT14 (Byfleet, West Byfleet) | -3.3% | -8.5% | +0.6% |
| GU24 (Chobham, Bisley) | -2.2% | -6.6% | 0.0% |
| GU23 (Ripley, Send) | -8.1% | -3.8% | -1.4% |
| GU22 (Old Woking, Pyrford) | -10.1% | -6.6% | -4.5% |
GU22 (Old Woking, Pyrford) stands out with -10.1% over one year and -4.5% over five years. This is the weakest growth profile in the borough. GU22 is a predominantly family-housing postcode with an average asking price of £510,779. With only 26 sales per month, the thinner market may be amplifying the downward trend.
GU21 is the only postcode showing resilience, with just -1.8% over one year and the strongest five-year return at +2.9%. The town centre postcode benefits from station proximity, higher transaction volumes, and a broader mix of housing types including the newer apartment stock.
Monthly Property Sales in Woking
GU21 records 52 sales per month, making it by far the most active postcode in Woking. That is more than all other postcodes combined (59 total across GU22, GU23, GU24, and KT14). High sales volume matters for buy-to-let investors because it means easier exits and more reliable pricing data.
| Area | Sales per Month | Turnover | Asking Price |
|---|---|---|---|
| GU21 (Town Centre, Horsell) | 52 | 23% | £409,321 |
| GU22 (Old Woking, Pyrford) | 26 | 12% | £510,779 |
| KT14 (Byfleet, West Byfleet) | 16 | 26% | £517,388 |
| GU24 (Chobham, Bisley) | 10 | 11% | £642,943 |
| GU23 (Ripley, Send) | 7 | 17% | £717,422 |
KT14 (Byfleet, West Byfleet) has the highest turnover rate at 26% despite only 16 sales per month. This suggests a smaller total housing stock with active churn. GU24 at 11% turnover and GU22 at 12% represent much stickier markets where homeowners hold for longer.
The low sales volumes in GU23 (7 per month) and GU24 (10 per month) mean data from these postcodes carries more volatility. Growth and price figures based on small sample sizes can swing sharply from quarter to quarter.
Property Data Sources
Our location guide relies on diverse, authoritative datasets including:
- HM Land Registry UK House Price Index
- Ministry of Housing, Communities and Local Government
- Ordnance Survey Data Hub
- Propertydata.co.uk
We update our property data quarterly to ensure accuracy. Last update: March 2026. All data is presented as provided by our sources without adjustments or amendments.

Woking Rental Market Analysis
For investors weighing up whether rental property is a worthwhile investment in Woking, the data below breaks down average monthly rents and gross rental yields across the borough's postcodes.
All five Woking postcodes have rental data, with monthly rents ranging from £1,599 to £3,027 and gross yields from 3.8% to 5.1%. If you are looking to build a property portfolio in the South East, Woking's combination of high-earning tenant base and London connectivity supports consistent rental demand.
Average Rent & Gross Rental Yields in Woking
GU23 (Ripley, Send) delivers the highest gross yield at 5.1% on a monthly rent of £3,027. That rent figure is nearly double any other Woking postcode. The high yield is driven by the rent rather than a lower entry price. GU23 has the highest asking price in the borough at £717,422, so the rental income is doing the heavy lifting.
At the other end, KT14 (Byfleet, West Byfleet) returns 3.8% on a rent of £1,653 and an asking price of £517,388. The three middle postcodes cluster between 3.9% and 4.7%.
| Area | Average Monthly Rent | Asking Price | Gross Yield |
|---|---|---|---|
| GU23 (Ripley, Send) | £3,027 | £717,422 | 5.1% |
| GU21 (Town Centre, Horsell) | £1,599 | £409,321 | 4.7% |
| GU24 (Chobham, Bisley) | £2,220 | £642,943 | 4.1% |
| GU22 (Old Woking, Pyrford) | £1,648 | £510,779 | 3.9% |
| KT14 (Byfleet, West Byfleet) | £1,653 | £517,388 | 3.8% |
GU21 at 4.7% concentrates the widest range of positive data points alongside its yield. It has the lowest asking price (£409,321), the highest sales volume (52 per month), the most resilient growth (-1.8% over one year versus the borough-wide average of around -5%), and a rent of £1,599. The combination of lower entry cost, higher liquidity, and steadier prices makes GU21 the postcode where the numbers work hardest together.
Is Woking Rent High?
Rents in every Woking postcode exceed 30% of the local median monthly income. The 30% threshold is the standard measure of housing affordability. GU21 sits at 43.9%, the lowest in the borough, while GU23 reaches 83.1%. These are high figures, but they reflect the location: Surrey commuter belt tenants typically earn well above the local median, particularly professional couples and corporate relocations.
The median gross weekly salary in Woking is £840.80, which equates to £3,643 per month or £43,719 per year. This is above the South East regional median of £800.30 per week and the Great Britain median of £752.40 per week. Data from the Nomis Labour Market Profile (ASHE 2025).
| Rank | Area | Rent as % of Income |
|---|---|---|
| 1 | GU23 (Ripley, Send) | 83.1% |
| 2 | GU24 (Chobham, Bisley) | 60.9% |
| 3 | KT14 (Byfleet, West Byfleet) | 45.4% |
| 4 | GU22 (Old Woking, Pyrford) | 45.2% |
| 5 | GU21 (Town Centre, Horsell) | 43.9% |
GU23's 83.1% figure looks extreme, but the £3,027 monthly rent reflects large, high-specification properties in a rural village setting. These are rented by tenants with household incomes well above the borough median. The same applies to GU24 at 60.9%. Dual-income professional households are the primary tenant demographic in both postcodes.
GU21, GU22, and KT14 cluster between 43.9% and 45.4%. These postcodes are more representative of the mainstream Woking rental market, where professional singles and couples working in London account for the bulk of lettings demand.
Thinking of Buying?
We have off-market investment properties averaging 8%+ annual yield.
View Property DealsBuy-to-Let Considerations
Are House Prices High? Price-to-Earnings Ratios
Purchasing a property in Woking requires between 9.4 and 16.4 times the median annual salary. This is based on the Nomis Labour Market Profile for Woking showing the median gross annual income for Woking residents is £43,719.
The national benchmark is 7.5x (England average price of £291,865 divided by the Great Britain median salary of £39,125). Every Woking postcode sits above this benchmark. GU21 at 9.4x is the closest to the national figure. GU23 at 16.4x is more than double it.
| Rank | Area | Price-to-Earnings Ratio |
|---|---|---|
| 1 | GU21 (Town Centre, Horsell) | 9.4x |
| 2 | GU22 (Old Woking, Pyrford) | 11.7x |
| 3 | KT14 (Byfleet, West Byfleet) | 11.8x |
| 4 | GU24 (Chobham, Bisley) | 14.7x |
| 5 | GU23 (Ripley, Send) | 16.4x |
Even the most affordable postcode, GU21 at 9.4x, exceeds the national benchmark by 25%. This is characteristic of Surrey. High local earnings partially offset the high prices, but Woking remains a market where mortgage serviceability at current interest rates presents a significant hurdle for investors using finance. The declining prices (-5.3% annual change) may bring these ratios down over the next 12-18 months.
Deposit Requirements in Woking
A 30% deposit in Woking ranges from £122,796 in GU21 to £215,227 in GU23. These are substantial capital requirements. For context, a 30% deposit on an average property in England is £87,560 (based on the England average of £291,865). Woking's cheapest entry point in GU21 still requires 40% more capital than the national average.
Investors exploring Woking who need to manage deposit outlay may want to compare costs using our stamp duty calculator and review the full breakdown of buy-to-let costs.
| Rank | Area | 30% Deposit Required |
|---|---|---|
| 1 | GU21 (Town Centre, Horsell) | £122,796 |
| 2 | GU22 (Old Woking, Pyrford) | £153,234 |
| 3 | KT14 (Byfleet, West Byfleet) | £155,216 |
| 4 | GU24 (Chobham, Bisley) | £192,883 |
| 5 | GU23 (Ripley, Send) | £215,227 |
The gap between GU21 and GU22 is £30,438. That additional capital buys into a quieter residential postcode with larger family homes, but also into weaker growth (-10.1% one-year versus -1.8%) and a less liquid market (26 sales/month versus 52). The numbers in the growth and liquidity data may affect which postcode delivers stronger returns despite the lower deposit in GU21. Investors exploring ways to reduce upfront capital can read our guide on buying a buy-to-let property with no deposit or browse repossessed houses for sale where pricing may sit below the postcode average.

What the Woking Data Tells Buy-to-Let Investors
GU21 (Town Centre, Horsell) combines the lowest asking price (£409,321), the highest sales volume (52 per month), and the most resilient growth (-1.8% over one year) in the borough. Its gross yield of 4.7% sits second in the ranking. A 30% deposit of £122,796 is the lowest entry point. Professional tenants commuting to London and the corporate employers along the M25 corridor drive demand for buy-to-let properties in this postcode.
GU23 (Ripley, Send) delivers the top gross yield at 5.1% on rents of £3,027 per month. The trade-off is a much higher entry price (£717,422), low liquidity (7 sales per month), and negative 5-year growth (-1.4%). This is a rural village postcode where large detached homes command premium rents from high-net-worth tenants. The numbers suit cash-rich investors targeting rental income over capital growth.
Woking's recent price correction of -5.3% over the past year is steeper than England (+1.7%) and the South East (0.0%). Five-year growth of 3.0% and three-year growth that is negative across four of five postcodes show a market that is repricing after the pandemic surge. For investors looking at investment property, this correction may present lower entry points than were available in 2021-2022, though current mortgage rates at around 5-6% mean financed returns are tight.
GU22 carries the weakest data profile with -10.1% annual growth, -4.5% over five years, 12% turnover, and a 3.9% yield. KT14 has the lowest yield at 3.8% but the highest turnover (26%) and a mid-range price point. Investors considering off-market property in Woking may find motivated sellers in postcodes with sharper price declines. The correction also creates scope for renovation property where below-average condition stock can be acquired at a discount to the postcode average.
How Woking Compares
Woking's mean asking price of £559,571 and top yield of 5.1% place it mid-table among comparable South East commuter markets. Guildford is more expensive with a similar yield range. Reading and Crawley offer lower entry points. Slough sits in between.
| Location | Mean Asking Price | Mean Monthly Rent | Top Gross Yield |
|---|---|---|---|
| Guildford | £639,106 | £2,259 | 6.3% |
| Woking | £559,571 | £2,029 | 5.1% |
| Slough | £421,952 | £1,544 | 4.9% |
| Reading | £415,265 | £1,603 | 6.1% |
| Crawley | £412,102 | £1,369 | 4.8% |
Reading's top yield of 6.1% on a mean asking price of £415,265 delivers higher returns at a lower entry cost than Woking. Crawley returns 4.8% at a significantly lower price point (£412,102 versus £559,571). Guildford commands a 14% premium over Woking with a 6.3% top yield reflecting a deeper rental market with more postcode diversity, including the University of Surrey student lettings market.
Woking's mean monthly rent of £2,029 is the second highest in this group, behind only Guildford's £2,259. The rental income is strong. The combination of high entry prices and negative growth means total returns currently lag locations like Reading, where entry costs are lower and yields are higher, and Crawley, where entry costs are significantly lower. Slough offers a mid-point at £421,952 with a 4.9% top yield. Investors comparing options can browse our best buy-to-let areas or search for below market value properties across the South East.
Frequently Asked Questions
Is Woking a good place to invest in property?
Woking's average sold price of £433,269 sits 48.4% above the England average, making it a premium market with high entry costs. Gross rental yields range from 3.8% to 5.1% across five postcodes, and annual price growth is currently -5.3% with all postcodes showing negative one-year returns.
Local median earnings of £43,719 are 11.7% above the national median, supporting tenant demand from London commuters. GU21 (Town Centre, Horsell) has the lowest entry point at £409,321 with the highest sales volume at 52 per month. The strong rental income sits alongside negative price growth and 30% deposit requirements starting at £122,796.
What are the best areas to live in Woking?
Woking's five postcodes cover distinct areas. GU21 includes the town centre and Horsell, with the lowest asking prices (£409,321) and the highest transaction volume (52 sales per month). GU22 covers Old Woking and Pyrford, a popular residential area with family homes at £510,779.
GU23 takes in the villages of Ripley and Send, where larger properties average £717,422 and monthly rents reach £3,027. GU24 includes Chobham and Bisley with average asking prices of £642,943. KT14 covers Byfleet and West Byfleet, offering good access to the M25 at £517,388. Each area attracts different tenant profiles, from young professionals near the station in GU21 to families in GU22 and rural tenants in GU23.
How does Woking compare to Guildford for buy-to-let?
Guildford's mean asking price of £639,106 is 14% above Woking's £559,571, with a top gross yield of 6.3% versus Woking's 5.1%. Mean monthly rents in Guildford are £2,259 compared to Woking's £2,029. Guildford has the University of Surrey which adds a student lettings market not present in Woking. Both towns benefit from fast London rail links, but Guildford delivers higher yields at a higher entry cost. See our full Guildford buy-to-let guide for a detailed comparison.
Are there new build houses and flats for sale in Woking?
Woking has seen significant new build activity, most notably the Victoria Place development in the town centre (GU21) which added two residential towers of 34 and 32 storeys, completed in August 2022. The Sheerwater regeneration has delivered 472 new homes in the borough, with a further 110 properties being refurbished for social housing.
The average price for flats and maisonettes in Woking is £252,153, the lowest entry point by property type, though flat prices are currently falling at -6.9% annually. The proposed West Hall development in the KT14 postcode would add 461 houses near West Byfleet if approved. GU21 has the highest sales volume at 52 transactions per month, the most active market for both new and existing stock.
Is West Byfleet a good area for buy-to-let in Woking?
West Byfleet sits in the KT14 postcode, which has an average asking price of £517,388, a gross rental yield of 3.8%, and monthly rents of £1,653. KT14 has the highest turnover rate in the borough at 26%, with 16 sales per month, indicating an active market despite the smaller housing stock.
One-year growth is -3.3% and five-year growth is +0.6%, making KT14 more stable than GU22 (-10.1% one-year) but less resilient than GU21 (-1.8%). The area benefits from M25 access and the proposed West Hall development of 461 homes would add new housing supply if approved. A 30% deposit in KT14 is £155,216.
What happened to Woking Borough Council's finances?
Woking Borough Council issued a Section 114 notice in June 2023 after accumulating debts exceeding £1.2 billion through its commercial investment strategy, including the £700m+ Victoria Square development. A Section 114 notice is a formal declaration that a council cannot balance its budget.
Government commissioners were appointed to oversee the council's finances. The major regeneration projects (Victoria Place, Sheerwater) were already underway before the notice and construction has continued. Details on the council's recovery plans are available on the Woking Borough Council website.