Where to Buy Property Investments in Slough: Yields of 4.9%
Slough sits in Berkshire, immediately west of the Greater London boundary, with Elizabeth Line trains to Paddington in 15-20 minutes. Gross rental yields range from 4.2% to 4.9% across the borough's three active postcodes, with SL1 delivering the highest returns. Average sold prices sit 15.5% above the England average but 11.0% below the South East regional average, and the borough's population grew 13.1% to 158,500 between the 2011 and 2021 censuses.
Slough's average sold price of £337,206 positions it as the South East's lower-cost entry point for buy-to-let investors with direct Elizabeth Line access to central London. That price sits £41,594 below the South East average of £378,800. Asking prices start from £342,649 in SL1, and rental data is available for all 3 postcodes with property activity.
This guide covers all 4 Slough postcodes (SL1, SL2, SL3, and SL95) under the Slough Borough Council unitary authority (ONS code E06000039). SL95 is a Royal Mail large user postcode with no residential property data. Investors comparing options in the region may also consider Ealing, Reading, Bracknell, or High Wycombe. Browse all our South East location guides.
Article updated: March 2026
Slough Buy-to-Let Market Overview 2026
Slough offers South East connectivity at prices 11% below the regional average, with Elizabeth Line services to London Paddington in 15 minutes.
- Average sold price: £337,206 (15.5% above England's £291,865)
- Asking price range: £342,649 (SL1) to £465,165 (SL3)
- Rental yields: 4.2% (SL2, SL3) to 4.9% (SL1) across postcodes with rental data
- Rental income: Monthly rents from £1,398 (SL1) to £1,625 (SL3)
- Price per sq ft: Sold prices from £451/sq ft (SL1) to £489/sq ft (SL3)
- Market activity: Sales ranging from 23 per month (SL2) to 34 per month (SL1)
- Deposit requirements: 30% deposits range from £102,795 (SL1) to £139,550 (SL3)
- Affordability ratios: Property prices from 8.9 to 12.1 times Slough's median annual salary of £38,483
Contents

-
by Robert Jones, Founder of Property Investments UK
With two decades in UK property, Rob has been investing in buy-to-let since 2005, and uses property data to develop tools for property market analysis.

Property Data Sources
Our location guide relies on diverse, authoritative datasets including:
- HM Land Registry UK House Price Index
- Ministry of Housing, Communities and Local Government
- Ordnance Survey Data Hub
- Propertydata.co.uk
We update our property data quarterly to ensure accuracy. Last update: March 2026. All data is presented as provided by our sources without adjustments or amendments.
Why Invest in Slough?
Slough's economy runs on its trading estate and its transport links. Slough Trading Estate is the largest commercial estate in single private ownership in Europe, home to over 500 businesses employing more than 20,000 people. Mars, O2, and BlackBerry have headquarters or major offices here. The estate sits less than three miles from Heathrow Airport, and that proximity anchors Slough to the aviation, logistics, and technology sectors that define this part of the M4 corridor.
The Elizabeth Line changed Slough's position in the commuter market when it opened in 2022. Direct trains to Paddington take 15 minutes, and connections run through to Liverpool Street and beyond. Before Crossrail, Slough was a Great Western Railway stop. Now it sits on a line that runs through the heart of London's business districts. That upgrade is the single biggest structural change to Slough's housing market in a generation.
Between the 2011 and 2021 censuses, Slough's population grew from 140,205 to 158,500, a rise of 13.1%. That is one of the fastest growth rates in the South East and reflects Slough's position as an employment hub drawing workers from a wide catchment. A growing population in a geographically constrained borough creates rental demand that new housing supply has not matched.
Earnings in Slough sit below both the regional and national medians. The median annual salary is £38,483, based on a median gross weekly pay of £740.10. The South East regional median is £800.30 per week and Great Britain's is £752.40. Lower local wages in a higher-cost region create a rental market where tenants can afford to rent but cannot easily buy.
Heathrow Airport is the second factor. The airport directly employs over 75,000 people and supports around 100,000 jobs in the surrounding area. Heathrow expansion plans have been debated for years, but even at its current capacity the airport generates consistent demand for rental housing in Slough, Hounslow, and the surrounding boroughs.
Slough Economic Summary
- Population: 158,500 (2021 Census). Growth of 13.1% from 2011.
- Median annual salary: £38,483 (Slough), £41,616 (South East), £39,125 (Great Britain)
- Employment rate: 75.4% (Slough), 78.7% (South East), 75.6% (Great Britain)
- Unemployment rate: 5.1% (Slough), 3.5% (South East), 4.3% (Great Britain)
- Key employment sectors: Technology, logistics, aviation, pharmaceuticals, financial services
Source: ONS Census 2021, Nomis Labour Market Profile (ASHE 2025, Employment Oct 2024-Sep 2025)
Slough's employment rate of 75.4% sits below the South East's 78.7% but is in line with Great Britain's 75.6%. The unemployment rate of 5.1% is above both the regional 3.5% and national 4.3%. That combination reflects a labour market where employment participation is lower than the wider South East, partly driven by Slough's younger age profile and its demographic composition. For buy-to-let investors, the key metric is that Slough has a large working population in a compact urban area with strong rental demand driven by transport connectivity and local employment.
Source: Office for National Statistics - Population for Slough
Regeneration and Investment in Slough
Slough's regeneration centres on the wholesale redevelopment of its town centre and the continuing investment around its upgraded transport links. After years of delayed plans, construction activity is now underway.
- Slough Central / Queensmere and Observatory Redevelopment (Berkeley Group, 1,600 homes): Berkeley Group acquired the Queensmere and Observatory shopping centres and is delivering a 14-year transformation of Slough town centre with 1,600 new homes, retail, and community space. The existing shopping centres closed in January 2026 with demolition beginning winter 2026. Updates at Slough Central.
- Horlicks Quarter (Berkeley Group, residential conversion): The former Horlicks Factory has been converted into apartments, duplexes, and townhouses priced from £300,000, with a nursery, co-working hub, and rooftop terrace. Located 0.2 miles from Slough station and the Elizabeth Line, the development is nearing completion with final phases selling. Updates at Berkeley Group.
- Slough Urban Renewal (Council + Morgan Sindall, multi-project programme): A partnership between Slough Borough Council and Morgan Sindall Investments delivering new housing, schools, leisure facilities, and community spaces across the borough. Completed projects include The Curve cultural centre, Arbour Park stadium, and multiple residential schemes. Updates at Slough Borough Council.

Slough Property Market Analysis
When Was the Last House Price Crash in Slough?
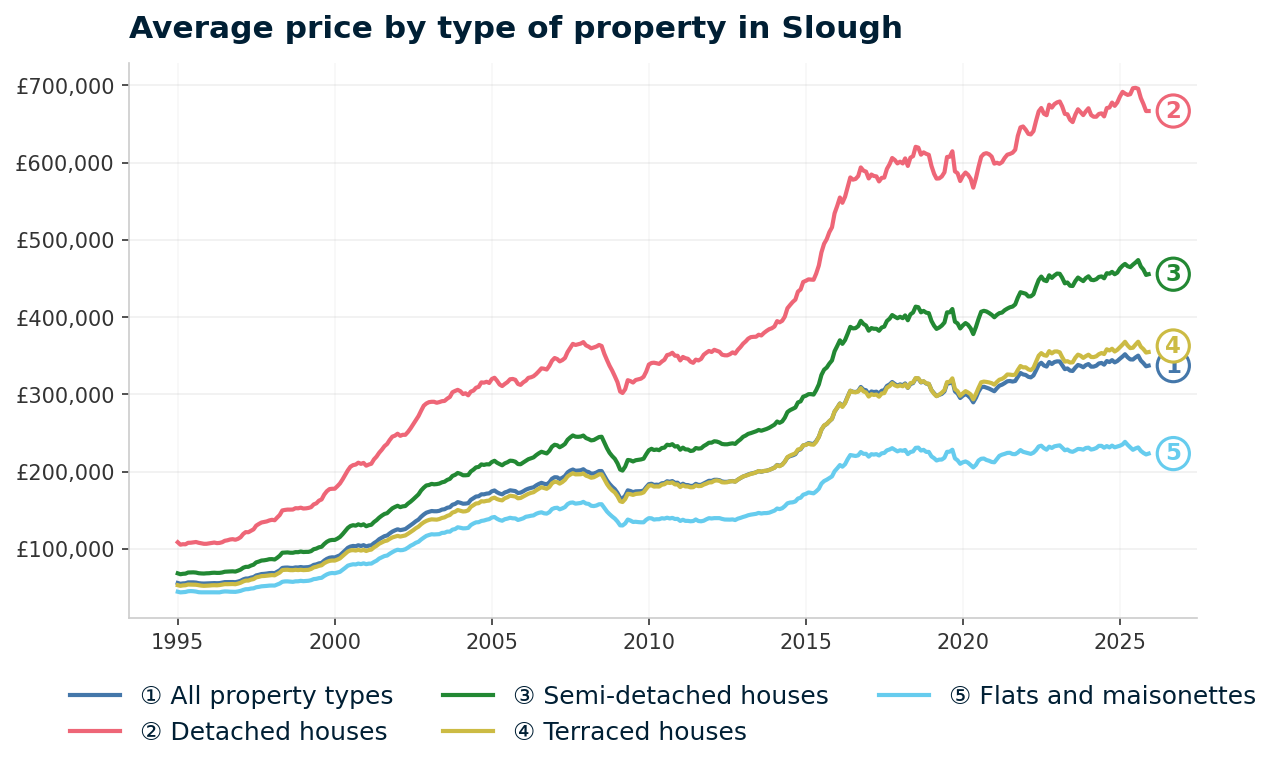
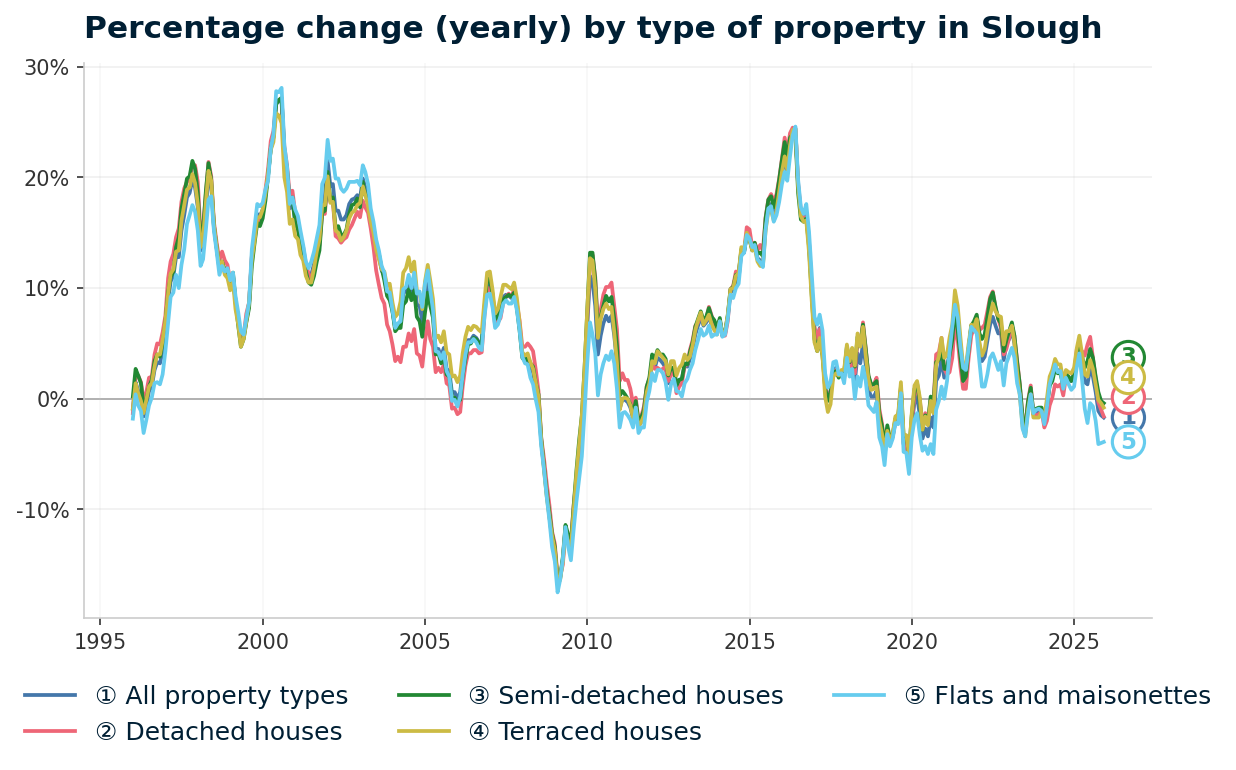
Slough's property prices fell 18.7% from a peak of £203,057 (December 2007) to a trough of £165,156 (March 2009), taking six years to recover. All sold property prices from the HM Land Registry House Price Index are available at borough level. The data runs from January 1995 to December 2025 and shows one major crash, a prolonged recovery, and a distinct Crossrail-driven boom that separates Slough's price history from most UK cities.
- 1995-2000 (Early growth): Slough started at £55,729 in January 1995 and reached £88,814 by January 2000. Steady growth of 59% over five years, driven by Slough's position on the M4 corridor near Heathrow. Prices tracked the wider South East boom but from a lower base.
- 2000-2007 (The boom): Prices almost doubled again, from £88,814 in January 2000 to a peak of £203,057 in December 2007. The sharpest growth came in 2001-2003 as cheap credit pushed South East house prices beyond what local wages could sustain. Slough's proximity to London and Heathrow made it a target for buy-to-let investors entering the market during this period.
- 2007-2009 (The financial crisis): From the peak of £203,057 in December 2007 to the trough of £165,156 in March 2009, Slough lost 18.7% of its value in 15 months. The worst annual change reading was -16.8% in February 2009. By property type at that point: detached -16.1%, semi-detached -16.3%, terraced -16.5%, flats -17.5%. Flats fell furthest. Slough's decline of 18.7% sat between England's 18.2% and the South East's 20.0%.
- 2009-2013 (Stagnation and recovery): Prices bounced to £179,841 by December 2009 but the recovery was uneven. It took until December 2013 for Slough to pass the pre-crash peak, reaching £203,613. That is a six-year recovery from the December 2007 high. Slough recovered slightly faster than many South East towns but slower than inner London boroughs where overseas investment accelerated the recovery.
- 2014-2016 (The Crossrail surge): This is where Slough diverges from the national pattern. Crossrail was confirmed and construction began. Prices surged from £203,613 in December 2013 to £305,306 by December 2016. That is 49.9% growth in three years. Investors and owner-occupiers priced in the anticipated Elizabeth Line connectivity before the railway opened. No other factor explains that rate of growth in a town where wages remained below the regional median.
- 2017-2019 (Plateau): After the Crossrail anticipation boost, prices stalled. From £300,192 in January 2017 to £295,257 by December 2019, Slough actually lost ground. Brexit uncertainty, Crossrail delays (the original 2018 opening was pushed back multiple times), and a wider South East slowdown all contributed. Investors who bought at the 2016 peak saw negative returns over three years.
- 2020-2022 (Pandemic recovery): The stamp duty holiday and remote working demand lifted prices from £298,437 in March 2020 to £341,849 by December 2022. Growth of 14.5% over 33 months. The Elizabeth Line finally opened in stages from May 2022, but by then much of the expected price premium had already been absorbed in the 2014-2016 surge.
- 2023-2025 (Softening): Prices peaked at £343,166 in December 2024 before slipping to £337,206 by December 2025. Annual change of -1.7%. Slough is one of a handful of South East locations showing negative annual growth while England as a whole posts +1.7%. The post-Elizabeth Line plateau suggests the connectivity premium is now fully priced in, and future growth depends on the town centre regeneration delivering tangible change.
The 2008 crash is the reference point for Slough investors assessing downside. An 18.7% decline took six years to recover. But the Crossrail-era surge that followed was unlike anything in Slough's earlier history. The Elizabeth Line is now operational, the town centre redevelopment is confirmed and under demolition, and population growth of 13.1% continues to underpin demand. The current -1.7% annual softening creates a different entry point than the +7.8% readings SL1 was posting a year ago.
Long-Term Property Value Growth in Slough
- 5 years (2020-2025): +10.3% (£305,815 to £337,206)
- 10 years (2015-2025): +21.5% (£277,495 to £337,206)
- 15 years (2010-2025): +81.7% (£185,600 to £337,206)
- 20 years (2005-2025): +95.2% (£172,764 to £337,206)
- 30 years (1995-2025): +511.2% (£55,169 to £337,206)
Source: HM Land Registry House Price Index for Slough, January 1995 to December 2025.
Thinking of Buying?
We have off-market investment properties averaging 8%+ annual yield.
View Property DealsSold House Prices in Slough
Slough sits in an unusual position for a PIUK location guide. Most of the towns and cities we cover are below the England average. Slough's headline figure of £337,206 is 15.5% above England's £291,865. But it is 11.0% below the South East average of £378,800. That gap between national and regional positioning is the defining feature of Slough's sold price data.
Flats are the exception. Slough's average flat price of £223,314 is just 1.8% above England's £219,340. That near-parity makes Slough flats one of the closest-to-national-average entry points in the South East. Compare that to semi-detached houses at 57.6% above the England average and the scale of the flat discount becomes clear.
| Property Type | Slough Average | England Average | Difference |
|---|---|---|---|
| Detached houses | £666,940 | £471,667 | +41.4% |
| Semi-detached houses | £455,603 | £289,135 | +57.6% |
| Terraced houses | £354,790 | £244,830 | +44.9% |
| Flats and maisonettes | £223,314 | £219,340 | +1.8% |
| All property types | £337,206 | £291,865 | +15.5% |
Semi-detached houses at £455,603 carry the largest premium at 57.6% above England. Slough's housing stock is heavily weighted towards semis and terraces. The proximity to London and Elizabeth Line connectivity pushes family housing well above national norms. Owner-occupier demand from London commuters competes directly with investors in this segment.
Detached houses at £666,940 are 41.4% above England but only 1.9% below the South East average of £679,828. There are relatively few detached properties in Slough and most sit in the Farnham area (SL2). The detached market here tracks the wider South East rather than local Slough dynamics.
Terraced houses at £354,790 sit 44.9% above England. Terraces are the core buy-to-let stock in SL1 and SL3, particularly the Victorian and Edwardian terraces around Slough town centre and Langley. The terraced premium reflects that these are not the compact northern terraces that typically trade below £200,000. Slough terraces are South East family homes that command South East prices.
Flats and apartments in Slough average £223,314, just 1.8% above national parity. In a borough where every other property type commands a 40%+ premium over England, flats offer a way into the Slough market at close to national pricing. The flat stock includes purpose-built apartments near the town centre and conversions in older residential streets. Slough's flat market has not seen the same level of new-build premium development that inflates flat prices in neighbouring Reading and Hounslow, which explains the near-parity.
Property Data Sources
Our location guide relies on diverse, authoritative datasets including:
- HM Land Registry UK House Price Index
- Ministry of Housing, Communities and Local Government
- Ordnance Survey Data Hub
- Propertydata.co.uk
We update our property data quarterly to ensure accuracy. Last update: March 2026. All data is presented as provided by our sources without adjustments or amendments.
Price Per Square Foot in Slough
Slough's price per square foot ranges from £451 in SL1 to £489 in SL3, a spread of just £38. Average asking prices can mislead because a postcode might look expensive simply because it has larger properties. Price per square foot strips out that size bias and shows what you are actually paying for space.
That is a remarkably tight range compared to cities with wider postcode variation. It tells you that the underlying price of space is similar across Slough. The asking price differences between postcodes are driven more by property size and type than by location premiums.
| Rank | Area | Price Per Sq Ft |
|---|---|---|
| 1 | SL1 (Town Centre, Burnham) | £451 |
| 2 | SL2 (Britwell, Farnham Common) | £466 |
| 3 | SL3 (Langley, Colnbrook) | £489 |
| — | SL95 (Slough Large User) | Not enough data |
SL1 at £451 per square foot is the cheapest space in Slough. This postcode covers the town centre and Burnham, where a mix of terraces, older flats, and conversions keeps per-foot costs lower. SL1 also delivers the highest yield (4.9%) and strongest one-year growth (+7.8%). Cheaper space, better returns.
SL3 at £489 is only 8.4% more expensive per square foot than SL1, yet its asking prices are 35.8% higher. That gap means SL3 properties are larger on average, not that the location carries a dramatically different price premium. Langley and Colnbrook include more family houses and larger terraces than the town centre stock in SL1.
Figures reflect averages across all property types and ages. Individual values depend on condition, location within the postcode, and building age.
Houses for Sale in Slough: Asking Prices by Postcode
Asking prices for houses for sale in Slough range from £342,649 in SL1 to £465,165 in SL3. These are averages across all property types currently listed. Asking prices are not the same as sold prices, which capture what buyers actually paid. In a cooling market like Slough's current -1.7% annual decline, asking prices may sit above where sales eventually complete.
That is a spread of £122,516 across three postcodes, with a mean asking price of £421,952.
| Rank | Area | Average Asking Price |
|---|---|---|
| 1 | SL1 (Town Centre, Burnham) | £342,649 |
| 2 | SL2 (Britwell, Farnham Common) | £458,043 |
| 3 | SL3 (Langley, Colnbrook) | £465,165 |
| — | SL95 (Slough Large User) | Not enough data |
SL1 at £342,649 is £115,394 cheaper than SL2. That is a 33.7% gap between the cheapest and second-cheapest postcode. SL2 and SL3 sit within £7,122 of each other (£458,043 vs £465,165), which means the real choice for investors is between the significantly cheaper SL1 and the similarly priced SL2/SL3 tier.
SL2 and SL3 at £458,043 and £465,165 target different tenant profiles. SL2 covers Britwell and Farnham Common. The Farnham Common end includes some of Slough's more affluent housing, which pulls the average up. SL3 covers Langley and Colnbrook, which are closer to Heathrow and draw tenants working in aviation and logistics.

House Price Growth in Slough
Five-year growth across Slough's postcodes ranges from 6.6% in SL3 to 20.4% in SL2. That is a 13.8 percentage point gap. SL1 sits in the middle at 16.2% but leads the one-year and three-year growth tables. The short-term momentum is in SL1. The longer-term growth favours SL2. One-year growth can swing on a handful of transactions. Five years tells you whether an area is genuinely appreciating.
| Area | 1 Year | 3 Years | 5 Years |
|---|---|---|---|
| SL2 (Britwell, Farnham Common) | 7.4% | 5.5% | 20.4% |
| SL1 (Town Centre, Burnham) | 7.8% | 12.3% | 16.2% |
| SL3 (Langley, Colnbrook) | -2.6% | -3.7% | 6.6% |
| SL95 (Slough Large User) | Not enough data | Not enough data | Not enough data |
SL1 is the only postcode showing positive momentum across all three time periods. One-year growth of 7.8%, three-year growth of 12.3%, and five-year growth of 16.2%. That accelerating short-term trajectory suggests SL1 is gaining relative to the rest of Slough. The town centre regeneration and Elizabeth Line station proximity are both concentrated in SL1.
SL3 at -2.6% (one year) and -3.7% (three years) is actively losing value in the short term. The five-year figure of 6.6% is positive but modest. Langley and Colnbrook sit at the western edge of Slough, closer to Heathrow's flight paths. The negative short-term readings may reflect the broader Slough softening (-1.7% borough-wide) hitting SL3 harder than the town centre postcodes.
SL2's growth profile shows the opposite of SL3: strong long-term (+20.4% over five years) but decelerating short-term. Three-year growth of 5.5% is well below the five-year figure, suggesting most of SL2's gains came earlier in the window. The Farnham Common end of SL2 may be reaching a price ceiling given its proximity to more affluent areas in South Buckinghamshire.
Monthly Property Sales in Slough
84 properties sell per month across Slough's three active postcodes, with turnover rates between 6% and 8%. That is low by national standards. Slough's rental stock is tightly held. Landlords and homeowners are not selling frequently. Transaction volumes matter because they reveal your exit options. If you need to sell, how deep is the buyer pool?
| Area | Sales Per Month | Turnover | Asking Price |
|---|---|---|---|
| SL1 (Town Centre, Burnham) | 34 | 6% | £342,649 |
| SL3 (Langley, Colnbrook) | 27 | 8% | £465,165 |
| SL2 (Britwell, Farnham Common) | 23 | 8% | £458,043 |
| SL95 (Slough Large User) | Not enough data | Not enough data | Not enough data |
SL1 leads with 34 sales per month but the lowest turnover at 6%. High volume combined with low turnover means SL1 has a large housing stock relative to the number of transactions. Much of the stock is held by long-term owners and landlords. When properties do come to market in SL1, they are selling. The 34 sales per month is a healthy figure for a single postcode.
SL2 and SL3 both record 8% turnover with 23 and 27 sales per month respectively. These are smaller markets than SL1 but the slightly higher turnover suggests marginally more stock movement. For investors planning an exit, SL1 offers the deepest buyer pool. SL2 and SL3 are adequate but with fewer monthly transactions, selling may take longer.
Property Data Sources
Our location guide relies on diverse, authoritative datasets including:
- HM Land Registry UK House Price Index
- Ministry of Housing, Communities and Local Government
- Ordnance Survey Data Hub
- Propertydata.co.uk
We update our property data quarterly to ensure accuracy. Last update: March 2026. All data is presented as provided by our sources without adjustments or amendments.

Slough Rental Market Analysis
For investors weighing up whether rental property is a worthwhile investment in Slough, the data below breaks down average monthly rents and gross rental yields across the borough's postcodes.
Rental data is available for all 3 of Slough's active postcodes. Monthly rents range from £1,398 in SL1 to £1,625 in SL3 and gross yields range from 4.2% to 4.9%. If you are looking to build a property portfolio in the South East, Slough's combination of Elizabeth Line access and yields approaching 5% from a sub-£350,000 entry point sets it apart from much of the region.
Average Rent & Gross Rental Yields in Slough
SL1 delivers Slough's highest gross yield at 4.9%, where monthly rents of £1,398 meet asking prices of £342,649. SL2 and SL3 both sit at 4.2%, but from very different asking prices (£458,043 vs £465,165) and similar rents (£1,610 vs £1,625). The yield spread across Slough is 0.7 percentage points. In a borough with only three postcodes, that small gap means the entry price is the primary differentiator.
Gross rental yield is calculated from the average asking price and average monthly rent for each postcode. It does not account for void periods, maintenance, management fees, or mortgage costs. It is a starting point for comparison, not a profit forecast.
| Area | Average Monthly Rent | Average Asking Price | Gross Yield |
|---|---|---|---|
| SL1 (Town Centre, Burnham) | £1,398 | £342,649 | 4.9% |
| SL2 (Britwell, Farnham Common) | £1,610 | £458,043 | 4.2% |
| SL3 (Langley, Colnbrook) | £1,625 | £465,165 | 4.2% |
| SL95 (Slough Large User) | Not enough data | Not enough data | Not enough data |
SL1's yield advantage comes entirely from its lower asking price, not from higher rents. SL1's rent of £1,398 is actually the lowest in Slough. But at £342,649, the entry price is £115,000 cheaper than SL2. That price gap more than compensates for the lower rent and pushes the yield 0.7 points higher. An investor buying in SL1 pays less upfront and gets more income per pound invested.
SL2 and SL3 match at 4.2% but serve different tenant pools. SL3 Langley benefits from Heathrow proximity and draws aviation and logistics workers. SL2's Farnham Common end attracts families priced out of South Buckinghamshire. Both deliver rents above £1,600 per month, which in absolute terms is strong for the South East outside London.
Is Slough Rent High?
All three Slough postcodes show rent above 40% of the local median gross monthly salary, ranging from 43.6% in SL1 to 50.7% in SL3. The general benchmark is that rent becomes stretched above 30% of gross income. Slough sits well above that level across the board.
The median gross weekly salary in Slough is £740.10, which equates to £3,207 per month or £38,483 per year. This is below the South East regional median of £800.30 per week and below the Great Britain median of £752.40 per week. Data from the Nomis Labour Market Profile (ASHE 2025). The combination of below-median local wages and South East rental prices explains those elevated ratios.
| Rank | Area | Rent as % of Income |
|---|---|---|
| 1 | SL3 (Langley, Colnbrook) | 50.7% |
| 2 | SL2 (Britwell, Farnham Common) | 50.2% |
| 3 | SL1 (Town Centre, Burnham) | 43.6% |
| — | SL95 (Slough Large User) | Not enough data |
SL2 and SL3 at 50.2% and 50.7% are among the most stretched rental affordability ratios in any PIUK location guide. Half of the median gross salary going to rent is a headline figure. But Slough's workforce includes significant numbers of dual-income households and commuters earning London wages who rent locally. The median salary is a borough-wide figure that understates what many Slough tenants actually earn.
SL1 at 43.6% is the most affordable of the three but still well above the 30% benchmark. The lower asking prices and lower rents in SL1 produce a slightly less stretched ratio. For landlords, SL1's lower affordability pressure relative to SL2 and SL3 may translate to more sustainable tenancies, even if all three postcodes sit above comfortable levels on paper.
Thinking of Buying?
We have off-market investment properties averaging 8%+ annual yield.
View Property DealsBuy-to-Let Considerations
Are Slough House Prices High? Price-to-Earnings Ratios
Purchasing a property in Slough requires between 8.9 and 12.1 times the local median annual salary of £38,483. All three postcodes sit above the national benchmark of 7.5x (England's £291,865 against GB's median salary of £39,125). Data from the Nomis Labour Market Profile for Slough.
SL1 at 8.9x is the closest to the benchmark. SL2 and SL3 at 11.9x and 12.1x are significantly stretched. This reflects Slough's position as a South East location with below-national-median wages. Property prices are driven by London commuter demand, not by what locally-employed residents earn.
| Rank | Area | Price-to-Earnings Ratio |
|---|---|---|
| 1 | SL1 (Town Centre, Burnham) | 8.9x |
| 2 | SL2 (Britwell, Farnham Common) | 11.9x |
| 3 | SL3 (Langley, Colnbrook) | 12.1x |
| — | SL95 (Slough Large User) | Not enough data |
SL1 at 8.9x is the only postcode within reach of the national benchmark. At £342,649, it requires 8.9 times the local median salary. Still above the 7.5x national figure, but considerably more affordable than SL2 and SL3. The 3.2x gap between SL1 (8.9x) and SL3 (12.1x) is one of the largest within-borough spreads in any three-postcode PIUK guide.
The elevated ratios across Slough reflect the commuter premium. Slough's property prices are set by buyers who earn London and South East salaries. The local median of £38,483 understates the purchasing power of the people actually buying in this market. For investors, the high ratios mean most local residents cannot easily buy, which sustains rental demand.
Deposit Requirements in Slough
A 30% buy-to-let deposit in Slough ranges from £102,795 in SL1 to £139,550 in SL3. No Slough postcode offers a sub-£100,000 entry at 30%. Most buy-to-let mortgage lenders require a minimum 25% deposit, but the table below uses a more conservative 30% to reflect the rates and products available at higher loan-to-value ratios. A 30% deposit typically unlocks better interest rates, which matters for cash flow in a market where yields sit below 5%.
Investors looking for below market value properties may find individual listings below the postcode averages shown here.
| Rank | Area | 30% Deposit Required |
|---|---|---|
| 1 | SL1 (Town Centre, Burnham) | £102,795 |
| 2 | SL2 (Britwell, Farnham Common) | £137,413 |
| 3 | SL3 (Langley, Colnbrook) | £139,550 |
| — | SL95 (Slough Large User) | Not enough data |
SL1's deposit of £102,795 buys access to the highest yield (4.9%), the strongest one-year growth (7.8%), and the most liquid postcode (34 sales per month). The £34,618 saving over SL2's deposit of £137,413 is significant, and SL1 outperforms SL2 on yield, short-term growth, and transaction volume. The data does not show a trade-off between price and quality in Slough. SL1 leads on most metrics.
SL2 and SL3 require similar deposits at £137,413 and £139,550. The £2,137 difference is negligible. The choice between these two comes down to tenant profile and growth trajectory. SL2 has stronger five-year growth (20.4% vs 6.6%) while SL3 offers marginally higher rents (£1,625 vs £1,610).
Deposit is only part of the upfront cost. Budget for stamp duty (use our stamp duty calculator for an accurate figure), legal fees, and survey costs. For a full breakdown, see our guide to buy-to-let costs. Investors looking to reduce capital requirements may also consider repossessed properties or low-deposit strategies.

What the Slough Data Tells Buy-to-Let Investors
SL1 (Town Centre, Burnham) leads across the widest range of metrics in Slough. Highest yield at 4.9%, lowest asking price at £342,649, strongest one-year growth at 7.8%, strongest three-year growth at 12.3%, lowest deposit at £102,795, and the deepest buyer pool at 34 sales per month. In a borough with only three active postcodes, that concentration of positive data in one area is unusual. Investors considering investment property in the South East may find SL1's combination of price and yield relevant.
SL2 (Britwell, Farnham Common) has the strongest five-year growth at 20.4% but yields match SL3 at 4.2%. The deposit requirement of £137,413 is 33.7% higher than SL1's. SL2 serves a different part of Slough, ranging from the Britwell estate (social housing origins, now mixed tenure) to Farnham Common (affluent, semi-rural). That internal diversity within a single postcode makes generalisations harder than in SL1, where the housing stock is more consistent.
SL3 (Langley, Colnbrook) shows negative one-year (-2.6%) and three-year (-3.7%) growth alongside the weakest five-year figure at 6.6%. Rents are the highest in Slough at £1,625 per month, driven by Heathrow proximity. But the falling prices compress the total return. Investors looking for off-market property or renovation opportunities in Slough may find the current softening in SL3 creates negotiation room, but the growth data over multiple time periods shows this is not a short-term dip.
How Slough Buy-to-Let Compares to Nearby Areas
Slough's mean asking price of £421,952 sits second-lowest in a group of five western commuter belt locations, behind Reading at £415,265. The table below compares Slough against four nearby locations using the same methodology: mean asking price across all postcodes, mean monthly rent across postcodes with data, and top single-postcode gross yield.
| Location | Mean Asking Price | Mean Monthly Rent | Top Gross Yield |
|---|---|---|---|
| Reading | £415,265 | £1,603 | 6.1% |
| Slough | £421,952 | £1,544 | 4.9% |
| Hounslow | £506,393 | £1,915 | 5.6% |
| High Wycombe | £541,303 | £1,575 | 5.2% |
| Bracknell | £555,697 | £1,934 | 4.6% |
Reading's mean asking price of £415,265 is £6,687 below Slough's, with a top yield of 6.1% that leads the group. Reading has more postcodes and a larger data set, which creates wider internal variation and a higher top yield in its strongest area. The key difference between the two is transport. Slough has the Elizabeth Line with direct services through central London. Reading relies on Great Western Railway to Paddington. Both towns sit on the M4 corridor but the direct Elizabeth Line route is a different type of commuter connection.
Hounslow at £506,393 is £84,441 more expensive than Slough but delivers higher rents (£1,915) and a higher top yield (5.6%). Hounslow sits inside the Greater London boundary and benefits from London borough infrastructure. High Wycombe and Bracknell are both significantly more expensive at £541,303 and £555,697, with lower top yields than Reading and Hounslow.
Slough has the lowest top yield in this group at 4.9%. That reflects Slough's three-postcode concentration. With only three data points, the top yield is capped by the best single postcode (SL1). Reading, Hounslow, and High Wycombe all have more postcodes, giving them more chances to produce a high-yielding outlier. On price, Slough's SL1 at £342,649 is cheaper than the cheapest postcode in both Hounslow and Bracknell, though Reading and High Wycombe each have individual postcodes below that level. For a broader comparison across the country, see the best buy-to-let areas guide.
Frequently Asked Questions
How does Slough compare to Reading for buy-to-let?
Reading has a lower mean asking price (£415,265 vs £421,952) and a higher top yield (6.1% vs 4.9%). Slough's SL1 at £342,649 is cheaper than any individual Reading postcode average, and the Elizabeth Line provides direct central London access that Reading's Great Western services do not match. The two towns are seven miles apart and serve overlapping tenant pools. The data differences are driven by postcode count and housing stock composition rather than fundamentally different market dynamics.
What areas in Slough have buy-to-let rental data?
Three of Slough's four postcodes: SL1 (Town Centre, Burnham), SL2 (Britwell, Farnham Common), and SL3 (Langley, Colnbrook). SL95 is a Royal Mail large user postcode with no residential property data. SL1 covers the area closest to Slough station and the town centre. SL2 extends south towards Farnham Common. SL3 covers Langley and Colnbrook to the east, closer to Heathrow Airport.
How has the Elizabeth Line affected Slough's property market?
Prices rose 49.9% between December 2013 and December 2016, during Crossrail confirmation and construction. That surge happened before the line opened. When the Elizabeth Line began full services in 2022, Slough prices were already at £341,849. By December 2025, prices had softened to £337,206 with annual change at -1.7%. The data suggests the connectivity premium was largely priced in during the anticipation phase (2014-2016) rather than after the line opened.
Is Slough part of London?
No. Slough is a unitary authority in Berkshire (ONS code E06000039) governed by Slough Borough Council. The Greater London boundary runs along Slough's eastern edge, with the London Borough of Hillingdon on the other side. Slough sits 20 miles west of central London and the Elizabeth Line journey to Paddington takes 15 minutes. That proximity drives rental demand and commuter activity, but Slough is administered, taxed, and governed independently from London.
Are there property investment companies operating in Slough?
Several firms market buy-to-let properties in Slough, particularly new-build apartments near the Elizabeth Line station. Any property sold through an investment company can be benchmarked against the figures in this guide, but these are average values, not guaranteed prices. For current listings on the open market, browse buy-to-let properties for sale.