Where to Buy Property Investments in Bracknell: Yields of 4.6%
Bracknell's top postcode delivers a gross rental yield of 4.6% from an average asking price of £352,248. RG12, covering Bracknell's town centre and Easthampstead, is the most affordable entry point across seven postcodes in the Bracknell Forest unitary authority. Average sold prices across Bracknell Forest stand at £394,751 as of December 2025, which is 35.3% above the England average of £291,865. The borough's population grew 10.1% between the 2011 and 2021 censuses, reaching 124,607 residents.
Bracknell is not a typical budget buy-to-let market. Prices sit above both the England and South East (£378,800) averages, and every postcode carries a price-to-earnings ratio above the 7.5x national benchmark. RG12 combines the lowest entry price, the highest yield, and the strongest five-year growth of any postcode in the borough. That pattern is unusual. In most locations, affordability and growth pull in opposite directions. Across seven postcodes, six have rental data and one (RG45, Crowthorne) lacks sufficient rental market activity for reliable figures.
Bracknell is a town in Berkshire, South East England. Bracknell Forest is the unitary authority, coded E06000036 by the ONS. The seven postcodes in this guide cover Bracknell town centre, Warfield, Wokingham, Crowthorne, Sandhurst, and parts of Windsor and Ascot. The borough sits within the Thames Valley tech corridor, neighboured by Reading to the west and Slough to the north. Investors looking at buy-to-let property in the South East will find Bracknell positioned between the commuter belt and the M4 corridor employment hubs.
Article updated: March 2026
Bracknell Buy-to-Let Market Overview 2026
Bracknell Forest's property market sits above the England average, with entry-level postcodes offering the strongest yield and growth combination in the borough.
- Average sold price: £394,751 (35.3% above England's £291,865)
- Asking price range: £352,248 (RG12, Bracknell South) to £893,412 (SL5, Ascot)
- Rental yields: 3.5% (GU47) to 4.6% (RG12) across 6 postcodes with rental data
- Rental income: Monthly rents from £1,361 (RG12) to £3,169 (SL5)
- Price per sq ft: House prices from £418/sq ft (RG12) to £527/sq ft (SL5)
- Market activity: Sales ranging from 15 per month (RG45) to 55 per month (RG12)
- Deposit requirements: 30% deposits range from £105,674 (RG12) to £268,024 (SL5)
- Affordability ratios: Property prices from 8.2 to 20.7 times Bracknell's median annual salary of £43,206
Contents

-
by Robert Jones, Founder of Property Investments UK
With two decades in UK property, Rob has been investing in buy-to-let since 2005, and uses property data to develop tools for property market analysis.

Property Data Sources
Our location guide relies on diverse, authoritative datasets including:
- HM Land Registry UK House Price Index
- Ministry of Housing, Communities and Local Government
- Ordnance Survey Data Hub
- Propertydata.co.uk
We update our property data quarterly to ensure accuracy. Last update: March 2026. All data is presented as provided by our sources without adjustments or amendments.
Why Invest in Bracknell?
Bracknell Forest's population reached 124,607 in the 2021 Census, growing 10.1% from 113,205 in 2011. That growth rate outpaces the England average of 6.6% and reflects ongoing housing development across the borough. The town's position within the Thames Valley technology corridor underpins both employment demand and the rental market.
Bracknell's median annual salary stands at £43,206, putting local earnings above both the South East and national medians. The weekly figure of £830.90 compares to £800.30 for the South East region and £752.40 for Great Britain. This earnings premium is driven by the concentration of technology and telecommunications companies headquartered in and around the borough, including major employers along the Western Corridor.
An employment rate of 83.7% and an unemployment rate of just 2.3% point to a tight local labour market. High employment and above-average earnings underpin local rental demand. Tenants in Bracknell's most affordable postcode (RG12) would spend 37.8% of gross monthly income on rent, which is within standard affordability thresholds.
Bracknell Economic Summary
- Population: 124,607 (2021 Census). Growth of 10.1% from 2011.
- Median annual salary: £43,206 (local), £41,616 (South East), £39,125 (Great Britain)
- Employment rate: 83.7% (local), 78.8% (South East), 75.7% (Great Britain)
- Unemployment rate: 2.3% (local), 3.4% (South East), 3.9% (Great Britain)
- Key employment sectors: Technology, telecommunications, financial services, defence
Source: ONS Census 2021, Nomis Labour Market Profile (ASHE 2025, Employment 2025)
Regeneration and Investment in Bracknell
Over £770 million of public and private investment has reshaped Bracknell Forest from a 1960s new town into a modern employment and retail centre. Two live housing schemes are adding to the borough's housing stock, with a third already completed.
- Market Street / Brickmark Place (Under construction, completion late 2026): 169 new homes with 81 designated affordable (52 social rent, 29 shared ownership), plus 848 sq m of commercial space delivered by the Bracknell Forest Cambium Partnership. The scheme adds housing supply and public realm improvements directly to Bracknell town centre, supporting rental demand in RG12. Updates at Bracknell Forest Council.
- Coopers Hill (Completed November 2025): 52 new homes on a brownfield site including 13 affordable, with EV charging and dedicated cycle routes connecting to the town centre. The first completed project of the £131 million Cambium Partnership between the council and Countryside Partnerships (Vistry Group). Updates at Bracknell Forest Council.
- Borough-Wide Regeneration Programme (Ongoing, £770 million+): The wider programme includes The Lexicon (£240 million town centre retail and leisure district, opened 2017), £112 million in education, £250 million in healthcare, and £30 million in transport infrastructure. The Cambium Partnership targets approximately 400 homes across council-owned sites. Updates at Bracknell Forest Council.

Bracknell Property Market Analysis
When was the last house price crash in Bracknell?
Bracknell is in the unitary authority of Bracknell Forest so all sold property prices from HM Land Registry are available at this level.
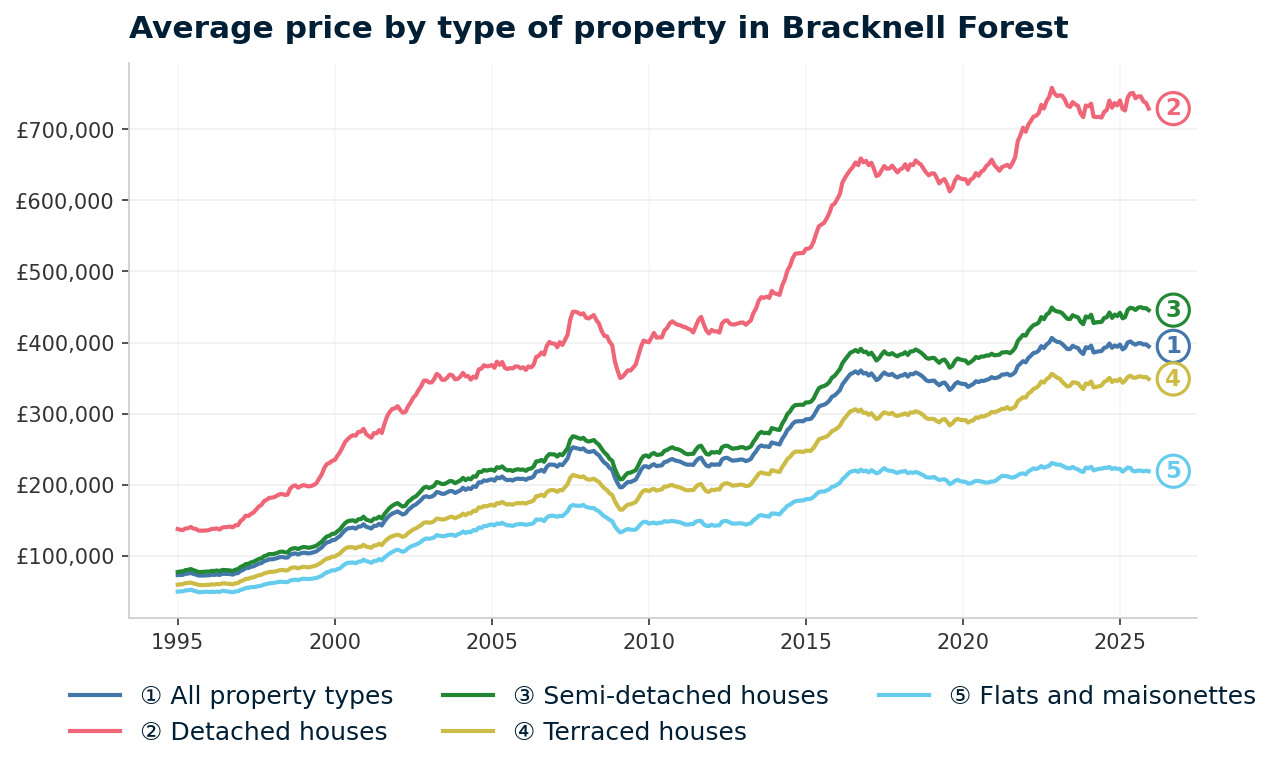
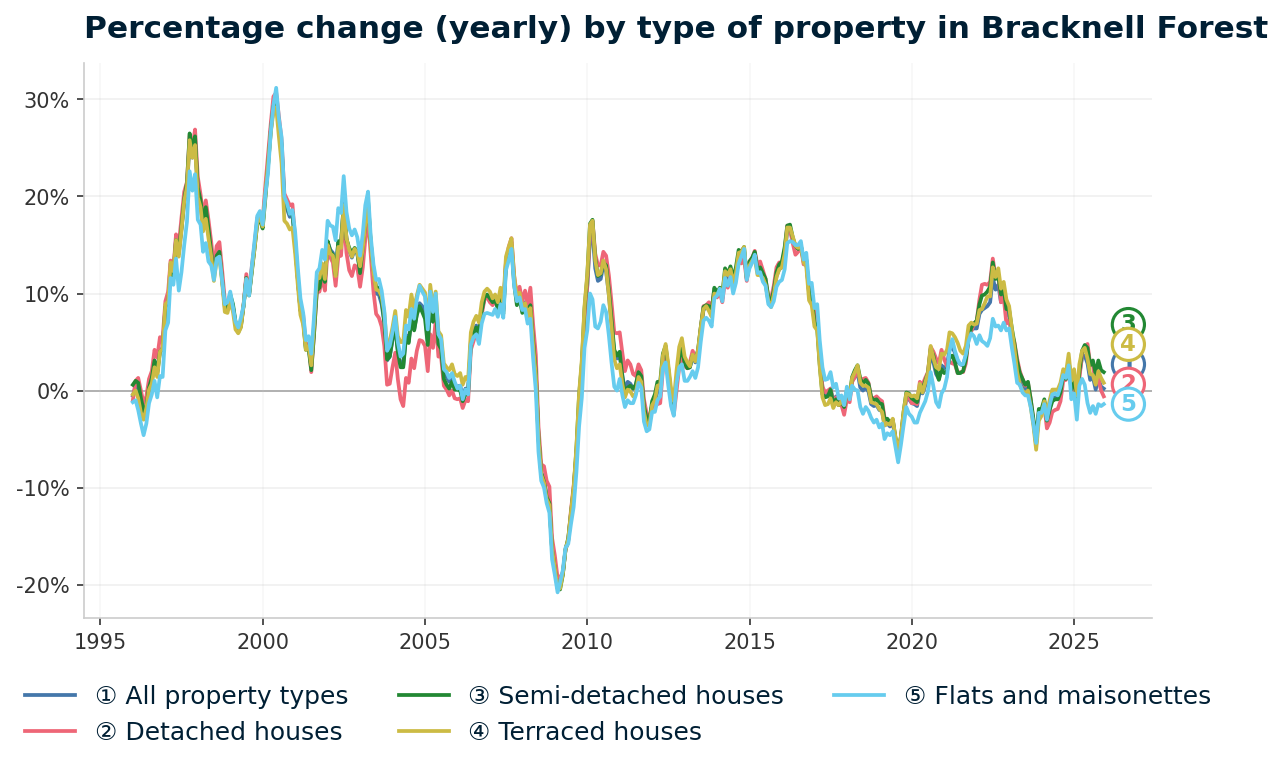
Bracknell Forest's average property price fell 22.3% during the 2008-2009 financial crisis, from a peak of £252,900 in August 2007 to a trough of £196,525 in February 2009. That decline was steeper than both the South East region (20.0%) and England as a whole (18.2%). The worst single annual change reading hit -20.2% in February 2009. Prices did not recover to their pre-crash peak until July 2013, when the average reached £252,990. A full cycle-by-cycle breakdown follows.
- 1995-2007 (The Boom): Bracknell Forest started the Land Registry index at £73,309 in January 1995. Prices more than tripled over the next twelve years, reaching £252,900 by August 2007. The Thames Valley technology boom and strong commuter demand from London fuelled sustained growth, with annual increases regularly above 10%.
- 2008-2009 (The Financial Crisis): From the August 2007 peak of £252,900, prices dropped to £196,525 by February 2009. The 22.3% decline exceeded England's 18.2% fall (peak £183,883 in September 2007, trough £150,438 in March 2009) and the South East's 20.0% fall (peak £240,647 in October 2007, trough £192,598 in March 2009). The annual change reading hit -20.2% in February 2009.
- 2010-2013 (Stagnation and Recovery): Prices stabilised around £224,000-£235,000 through this period. By January 2013, the average stood at £235,459. Recovery was slow compared to London, reflecting Bracknell's dependence on the wider South East employment market rather than city-centre finance.
- 2013-2016 (Turning Point): Prices passed the pre-crash peak in July 2013 at £252,990. Growth then accelerated sharply, with annual changes above 9% through 2014-2016. By January 2016, prices had reached £329,283, driven by stamp duty reform and a shortage of family housing stock.
- 2017-2019 (Pre-pandemic plateau): Growth slowed markedly. Prices peaked at £360,925 in October 2016 then drifted sideways, ending December 2019 at £342,611 with a year-on-year change of -0.9%. The opening of The Lexicon in September 2017 brought retail and employment but did not immediately translate into price growth.
- 2020-2022 (Pandemic surge): Despite an initial dip, prices climbed from £341,871 in January 2020 to a peak of £406,621 in November 2022. The stamp duty holiday and demand for space drove annual growth above 9% through mid-2022.
- 2023 (Rate shock): Interest rate rises cooled the market. Prices fell from £403,291 in December 2022 to £393,522 by December 2023, a year-on-year decline of 2.4%.
- 2024-2025 (Current): Prices stabilised through 2024 and ended December 2025 at £394,751 with annual growth of 0.2%. The market is flat rather than falling.
Over 30 years, Bracknell Forest property prices have grown 441.1%. The long-term trajectory is clear despite the volatility of individual cycles.
Long-term growth summary:
- 5 years (2020-2025): +12.3% (£351,524 to £394,751)
- 10 years (2015-2025): +21.2% (£325,669 to £394,751)
- 15 years (2010-2025): +68.9% (£233,678 to £394,751)
- 20 years (2005-2025): +89.5% (£208,357 to £394,751)
- 30 years (December 1995 to December 2025): +441.1% (£72,949 to £394,751)
The 2008-2009 crash hit Bracknell harder than the national average, and recovery took approximately six years. The borough's higher price point meant a larger absolute loss for investors who bought near the peak. The current market is flat after the pandemic surge, with the rate shock of 2023 having been absorbed. Bracknell's price trajectory since 2016 has been more volatile than the steady pre-2007 growth period.
Source: HM Land Registry House Price Index for Bracknell Forest, January 1995 to December 2025.
Thinking of Buying?
We have off-market investment properties averaging 8%+ annual yield.
View Property DealsSold House Prices in Bracknell
The average sold price across all property types in Bracknell Forest is £394,751, which is £102,886 (35.3%) above the England average of £291,865. That premium is concentrated in houses rather than flats. Detached and semi-detached properties carry the largest gaps, while flats are almost exactly level with the national figure.
| Property Type | Bracknell Forest Average | England Average | Difference |
|---|---|---|---|
| Detached houses | £728,880 | £471,667 | +£257,213 (+54.5%) |
| Semi-detached houses | £445,647 | £289,135 | +£156,512 (+54.1%) |
| Terraced houses | £348,914 | £244,830 | +£104,084 (+42.5%) |
| Flats and maisonettes | £219,249 | £219,340 | -£91 (-0.0%) |
| All property types | £394,751 | £291,865 | +£102,886 (+35.3%) |
Detached houses in Bracknell Forest cost £728,880, a 54.5% premium over England's £471,667. This reflects the large-plot family housing stock in postcodes like SL5 and RG40. The premium narrows but remains substantial for semi-detached properties at 54.1% above the national average, making even mid-market family homes a significant step up from typical England prices.
Terraced houses carry a 42.5% premium at £348,914 versus £244,830 nationally. The terraced stock in Bracknell is concentrated in the town centre postcodes (RG12, RG42) and dates largely from the new town era of the 1950s-1970s. These smaller houses form the core of the investable stock for buy-to-let.
Flats in Bracknell Forest are priced at £219,249, virtually identical to the England average of £219,340. This is the standout finding in the sold prices data. While houses carry premiums of 42% to 55%, the flat market is level with the national benchmark. Bracknell's flat market sits at national-average pricing within a borough where earnings and employment are both above national averages.
Property Data Sources
Our location guide relies on diverse, authoritative datasets including:
- HM Land Registry UK House Price Index
- Ministry of Housing, Communities and Local Government
- Ordnance Survey Data Hub
- Propertydata.co.uk
We update our property data quarterly to ensure accuracy. Last update: March 2026. All data is presented as provided by our sources without adjustments or amendments.
Price Per Square Foot in Bracknell
Price per square foot strips out the effect of property size and reveals where the underlying land and build value sits across postcodes. In Bracknell, transaction-based prices range from £418 per square foot in RG12 (Bracknell South, Easthampstead) to £527 per square foot in SL5 (Ascot, Sunninghill). The spread is relatively tight at £109 per sq ft, which is narrower than most locations with this many postcodes. That tells you the premium in postcodes like SL5 is driven more by plot size and property type than by fundamentally higher land values per unit of space.
| Rank | Area | Price Per Sq Ft |
|---|---|---|
| 1 | RG12 (Bracknell South, Easthampstead) | £418 |
| 2 | GU47 (Sandhurst, College Town) | £450 |
| 3 | RG45 (Crowthorne) | £460 |
| 4 | RG40 (Wokingham) | £481 |
| 5 | RG42 (Bracknell North, Warfield) | £493 |
| 6 | SL4 (Windsor, Ascot) | £522 |
| 7 | SL5 (Ascot, Sunninghill) | £527 |
RG12 at £418 per sq ft is the lowest cost per unit of space in Bracknell. A 600 sq ft flat in RG12 would cost approximately £250,800 on a per-square-foot basis, compared to £316,200 for the same size in SL5. That is a £65,400 difference on an equivalent property size. RG12 also has the highest yield (4.6%) and strongest five-year growth (33.4%).
For Sale Asking Prices in Bracknell
Asking prices reflect what is currently on the market. They sit higher than Land Registry sold prices because they include vendor expectations and have not been tested at completion. Across Bracknell's seven postcodes, the mean asking price is £555,697. That figure is pulled upward by SL5 (Ascot, Sunninghill) at £893,412. Without SL5, the mean drops to £499,411.
| Rank | Area | Asking Price |
|---|---|---|
| 1 | RG12 (Bracknell South, Easthampstead) | £352,248 |
| 2 | GU47 (Sandhurst, College Town) | £477,308 |
| 3 | RG42 (Bracknell North, Warfield) | £510,077 |
| 4 | RG45 (Crowthorne) | £511,846 |
| 5 | RG40 (Wokingham) | £559,798 |
| 6 | SL4 (Windsor, Ascot) | £585,187 |
| 7 | SL5 (Ascot, Sunninghill) | £893,412 |
The gap between the cheapest and most expensive postcodes is £541,164. That is a 2.5x multiple from RG12 to SL5. In most buy-to-let locations analysed on this site, the spread is 1.5x to 2x. Bracknell's wider spread reflects the inclusion of premium residential areas around Windsor and Ascot within the same local authority boundary. The town centre postcodes (RG12, RG42) have the highest sales volumes and lowest asking prices in the borough. Browse below market value properties in the South East.

House Price Growth in Bracknell
Five-year growth data reveals the two-speed dynamic that defines Bracknell's property market. RG12 (Bracknell South) has grown 33.4% over five years, making it the standout growth postcode in the borough. At the other end, SL5 (Ascot, Sunninghill) has fallen 3.8% over the same period. The cheapest postcode grew fastest. The most expensive shrank.
| Area | 1 Year | 3 Years | 5 Years |
|---|---|---|---|
| RG12 (Bracknell South, Easthampstead) | +2.5% | +5.8% | +33.4% |
| RG40 (Wokingham) | +5.6% | +5.7% | +14.0% |
| GU47 (Sandhurst, College Town) | +6.5% | +9.8% | +13.4% |
| RG42 (Bracknell North, Warfield) | +4.8% | -1.0% | +11.6% |
| RG45 (Crowthorne) | -4.4% | -5.0% | +8.7% |
| SL4 (Windsor, Ascot) | +2.3% | -1.5% | +0.8% |
| SL5 (Ascot, Sunninghill) | -3.2% | -18.1% | -3.8% |
RG12's 33.4% five-year growth is more than double the next best performer (RG40 at 14.0%). An investor who purchased at the RG12 average five years ago has seen approximately £88,000 of capital appreciation on a single property. The town centre regeneration programme and new housing delivery have not dampened values. They appear to have supported them.
SL5's three-year decline of 18.1% stands out as the sharpest correction in the dataset. Properties in the Ascot and Sunninghill area have lost nearly a fifth of their value since 2023. With an average asking price still at £893,412 and a turnover rate of just 5%, the premium end of the market is both expensive and illiquid. SL4 (Windsor) shows a similar pattern at a smaller scale, with only 0.8% growth over five years.
Monthly Property Sales in Bracknell
RG12 records 55 sales per month with a turnover rate of 21%, making it the most liquid market in Bracknell by a significant margin. Turnover measures the percentage of housing stock that changes hands annually. Higher turnover means more buying opportunities and a deeper pool of comparables for mortgage valuations.
| Area | Sales Per Month | Turnover | Asking Price |
|---|---|---|---|
| RG12 (Bracknell South, Easthampstead) | 55 | 21% | £352,248 |
| SL4 (Windsor, Ascot) | 35 | 9% | £585,187 |
| RG40 (Wokingham) | 31 | 20% | £559,798 |
| RG42 (Bracknell North, Warfield) | 29 | 14% | £510,077 |
| GU47 (Sandhurst, College Town) | 20 | 39% | £477,308 |
| SL5 (Ascot, Sunninghill) | 20 | 5% | £893,412 |
| RG45 (Crowthorne) | 15 | 13% | £511,846 |
GU47 (Sandhurst) has the highest turnover rate at 39%, meaning more than a third of its housing stock transacts annually. Combined with 20 sales per month and an asking price of £477,308, this indicates a fast-moving market with strong demand relative to stock size. GU47 also recorded the highest one-year growth at 6.5%.
SL5's turnover of 5% is the lowest in the borough. Twenty sales per month from a large housing stock means properties move slowly. Low turnover means fewer properties come to market and resale timelines tend to be longer.
Property Data Sources
Our location guide relies on diverse, authoritative datasets including:
- HM Land Registry UK House Price Index
- Ministry of Housing, Communities and Local Government
- Ordnance Survey Data Hub
- Propertydata.co.uk
We update our property data quarterly to ensure accuracy. Last update: March 2026. All data is presented as provided by our sources without adjustments or amendments.

Bracknell Rental Market Analysis
The data below breaks down average monthly rents and gross rental yields across Bracknell's postcodes. Read more on whether rental property is a worthwhile investment.
Six of Bracknell's seven postcodes have sufficient rental data. RG45 (Crowthorne) lacks reliable rental market figures. If you are looking to build a property portfolio in the South East, Bracknell's combination of above-average tenant earnings and town centre regeneration supports rental demand across the most active postcodes.
Average Rent & Gross Rental Yields in Bracknell
Gross rental yields in Bracknell range from 3.5% in GU47 (Sandhurst) to 4.6% in RG12 (Bracknell South), with monthly rents from £1,361 to £3,169. That 1.1 percentage point yield spread is narrow compared to many locations on this site, where the gap between top and bottom postcodes can reach 3-4 points. What separates Bracknell is that the highest yield comes from the cheapest, most liquid, and fastest-growing postcode. In most markets, those metrics pull in different directions.
| Area | Monthly Rent | Asking Price | Gross Yield |
|---|---|---|---|
| RG12 (Bracknell South, Easthampstead) | £1,361 | £352,248 | 4.6% |
| RG42 (Bracknell North, Warfield) | £1,828 | £510,077 | 4.3% |
| SL4 (Windsor, Ascot) | £2,119 | £585,187 | 4.3% |
| SL5 (Ascot, Sunninghill) | £3,169 | £893,412 | 4.3% |
| RG40 (Wokingham) | £1,717 | £559,798 | 3.7% |
| GU47 (Sandhurst, College Town) | £1,409 | £477,308 | 3.5% |
| RG45 (Crowthorne) | Not enough data | £511,846 | Not enough data |
RG12 tops the yield table at 4.6% from a monthly rent of £1,361 and an asking price of £352,248. That yield level is modest by national standards but strong for the South East, where entry prices routinely push yields below 4%. RG12's sub-£400,000 entry point sits alongside rents supported by local tech sector earnings.
SL5 achieves the highest absolute rent at £3,169 per month, yet only delivers a 4.3% yield. The £893,412 entry price absorbs the rental premium. An investor in SL5 would need a 30% deposit of £268,024 to access the same yield that RG12 delivers from a £105,674 deposit. The same yield from 2.5x the capital deployed is the core trade-off between Bracknell's two market tiers.
Is Bracknell Rent High?
Rent as a percentage of income measures how much of a tenant's gross monthly salary goes on rent. In Bracknell, this ranges from 37.8% in RG12 to 88.0% in SL5. The standard affordability threshold used by lenders and housing associations is 30-35% of gross income. Only one postcode (RG12) comes close to that threshold. Every other postcode exceeds it, with the premium areas significantly above.
The median gross weekly salary in Bracknell is £830.90, which equates to £3,600 per month or £43,206 per year. This is above the South East regional median of £800.30 per week and the Great Britain median of £752.40 per week. Data from the Nomis Labour Market Profile (ASHE 2025).
| Rank | Area | Rent as % of Income |
|---|---|---|
| 1 | SL5 (Ascot, Sunninghill) | 88.0% |
| 2 | SL4 (Windsor, Ascot) | 58.9% |
| 3 | RG42 (Bracknell North, Warfield) | 50.8% |
| 4 | RG40 (Wokingham) | 47.7% |
| 5 | GU47 (Sandhurst, College Town) | 39.1% |
| 6 | RG12 (Bracknell South, Easthampstead) | 37.8% |
| — | RG45 (Crowthorne) | Not enough data |
RG12 and GU47 are the only postcodes where rent sits below 40% of gross income. These two postcodes represent the tenant base most likely to sustain rental payments without financial strain. Lower rent-to-income ratios are associated with lower arrears rates and longer average tenancy durations.
SL5's rent-to-income ratio of 88.0% reflects the disconnect between local median earnings and Ascot-area rents. Tenants in SL5 are not typically earning the Bracknell median. They are London commuters, international relocators, or high earners in specialist roles. The tenant pool is smaller and more volatile, which explains the postcode's low turnover rate of 5%.
Thinking of Buying?
We have off-market investment properties averaging 8%+ annual yield.
View Property DealsBuy-to-Let Considerations
Are House Prices High? Price-to-Earnings Ratios
Purchasing a property in Bracknell requires between 8.2 and 20.7 times the median annual salary. This is based on the Nomis Labour Market Profile for Bracknell showing the median gross annual income for Bracknell residents is £43,206.
Every postcode in Bracknell sits above the national benchmark of approximately 7.5x (England average sold price of £291,865 divided by Great Britain median annual salary of £39,125). This means Bracknell is expensive by national standards even at its most affordable. The relevant question for investors is not whether prices are high in absolute terms, but how they compare to the rents the market generates.
| Rank | Area | Price-to-Earnings Ratio |
|---|---|---|
| 1 | RG12 (Bracknell South, Easthampstead) | 8.2x |
| 2 | GU47 (Sandhurst, College Town) | 11.0x |
| 3 | RG42 (Bracknell North, Warfield) | 11.8x |
| 4 | RG45 (Crowthorne) | 11.8x |
| 5 | RG40 (Wokingham) | 13.0x |
| 6 | SL4 (Windsor, Ascot) | 13.5x |
| 7 | SL5 (Ascot, Sunninghill) | 20.7x |
RG12 at 8.2x is the closest to the national benchmark, and the only postcode below 10x. At 8.2 times earnings, RG12 is expensive relative to national norms but competitive within the South East, where ratios of 10x or higher are common. Read this alongside the yield data: a 4.6% gross yield from an 8.2x price-to-earnings ratio is the tightest alignment between tenant earnings and rental costs in the borough.
SL5 at 20.7x means an Ascot property costs nearly 21 years of median Bracknell income. This ratio confirms SL5 as a different market segment entirely. SL5's yield, growth, and liquidity metrics all sit at the bottom of the borough's range. The data here aligns with the negative growth, low turnover, and elevated rent-to-income ratio seen in earlier sections. The no deposit investment property guide covers alternative entry strategies.
Deposit Requirements in Bracknell
A 30% deposit is standard for buy-to-let mortgage products. Deposits in Bracknell range from £105,674 in RG12 to £268,024 in SL5. The £162,350 gap between the lowest and highest deposit requirement illustrates the capital barrier that separates the two tiers of Bracknell's market. Investors considering the full costs of purchase can use the stamp duty calculator and review the buy-to-let costs guide to model total outlay.
| Rank | Area | 30% Deposit Required |
|---|---|---|
| 1 | RG12 (Bracknell South, Easthampstead) | £105,674 |
| 2 | GU47 (Sandhurst, College Town) | £143,192 |
| 3 | RG42 (Bracknell North, Warfield) | £153,023 |
| 4 | RG45 (Crowthorne) | £153,554 |
| 5 | RG40 (Wokingham) | £167,939 |
| 6 | SL4 (Windsor, Ascot) | £175,556 |
| 7 | SL5 (Ascot, Sunninghill) | £268,024 |
Four postcodes require deposits between £143,000 and £168,000. This middle band (GU47, RG42, RG45, RG40) represents the bulk of Bracknell's housing stock outside the town centre. Each of these postcodes delivers yields between 3.5% and 4.3%, with mixed growth profiles. The deposit data here should be read alongside the growth table. RG42, for example, requires £153,023 but has seen negative three-year growth of -1.0%. Investors looking to reduce their upfront capital may also consider renovation properties where purchase prices sit below the postcode average.
What the Bracknell Data Tells Buy-to-Let Investors
RG12 leads every key metric: lowest entry price (£352,248), highest yield (4.6%), strongest five-year growth (33.4%), highest sales volume (55 per month), and the most affordable rent-to-income ratio (37.8%). A 30% deposit of £105,674 buys access to a rental market supported by tech corridor earnings and town centre regeneration. The tenant profile in RG12 skews toward younger professionals and key workers drawn to the most affordable housing within the borough.
The growth data separates Bracknell into two distinct tiers. The town centre and mid-range postcodes (RG12, RG42, GU47, RG40) have all delivered positive five-year growth between 11.6% and 33.4%. The premium postcodes (SL4 at 0.8%, SL5 at -3.8%) have stalled or declined. Capital deployed in the premium tier has underperformed cash over five years. The data shows that affordability and growth are aligned in this market, not opposed.
RG45 (Crowthorne) lacks rental data and recorded negative one-year growth of -4.4%. With 15 sales per month and 13% turnover, it is a low-volume market. SL5's three-year decline of 18.1%, combined with a 5% turnover rate and a 20.7x price-to-earnings ratio, makes it the most expensive and least liquid postcode in the borough. These metrics are presented as they appear in the data.
Bracknell Forest does not currently operate a selective licensing scheme for private landlords. Bracknell's town centre stock (RG12) sits below the borough average on price while recording the highest yield and growth figures in the dataset. Browse investment property in the South East.
How Bracknell Compares
Four South East locations provide useful context for Bracknell's buy-to-let market. Bracknell's mean asking price of £555,697 is the second highest of the five locations, while its top yield of 4.6% is the lowest. The comparison reveals the trade-off investors face in the South East: Bracknell's higher price point buys proximity to London and tech corridor employment, but yields are compressed by those same elevated prices.
| Location | Mean Asking Price | Mean Monthly Rent | Top Gross Yield |
|---|---|---|---|
| Reading | £415,265 | £1,603 | 6.1% |
| Slough | £421,952 | £1,544 | 4.9% |
| Basingstoke and Deane | £489,238 | £1,472 | 5.7% |
| Bracknell | £555,697 | £1,934 | 4.6% |
| Guildford | £639,106 | £2,259 | 6.3% |
Reading offers a lower mean asking price (£415,265) and a significantly higher top yield (6.1%). Reading's top yield of 6.1% delivers more rental return per pound at a lower entry price. Bracknell's RG12 postcode has delivered 33.4% five-year growth, which outperforms most South East postcodes over that period.
Guildford is more expensive at £639,106 but achieves a top yield of 6.3%. That combination of higher prices and higher yields reflects Guildford's university-driven rental market and its stronger overall rental demand. Slough at £421,952 and Basingstoke at £489,238 both offer lower entry points with higher yields than Bracknell. Investors comparing best buy-to-let areas across the South East will find Bracknell's yield is compressed by the inclusion of premium postcodes (SL4, SL5) in its borough boundary.
Frequently Asked Questions
Is Bracknell a nice place to live?
Bracknell has changed since the £770 million regeneration programme began. The Lexicon town centre, opened in 2017, replaced the dated 1960s precinct with 70 retail and leisure outlets, a 12-screen cinema, and public squares. The borough has an employment rate of 83.7%, an unemployment rate of 2.3%, and median earnings of £43,206, all above national averages.
Population grew 10.1% between 2011 and 2021 to 124,607. Bracknell South (RG12) and Sandhurst (GU47) have proximity to green space, good transport links, and town centre amenities.
Is Bracknell posh?
Parts of it are considered posh. The SL4 (Windsor) and SL5 (Ascot, Sunninghill) postcodes include premium residential areas with average asking prices of £585,187 and £893,412 respectively. These sit alongside the borough's original new town housing in RG12, where asking prices average £352,248. Price per square foot ranges from £418 (RG12) to £527 (SL5), a gap of just 26%, meaning the premium is driven more by property size than by fundamentally different land values. SL4 and SL5 have higher rents (£2,272 and £2,600/month) and yields of 4.3%, with flat or negative recent growth. RG12 has lower rents (£1,347/month) but the highest yield in the borough at 4.6% and five-year growth of 33.4%.
How does Bracknell compare to Reading for buy-to-let?
Reading has a lower mean asking price (£415,265 vs Bracknell's £555,697) and a higher top yield (6.1% vs 4.6%). Bracknell's RG12 postcode has delivered 33.4% five-year growth from the lowest entry price in the borough (£352,248). Reading is 10 miles west along the M4 corridor and shares Bracknell's tech sector employment base. Both towns draw tenants from the same professional demographic. Reading's yield data covers more postcodes; Bracknell's strongest figures are concentrated in one postcode. Read the full Reading buy-to-let guide linked above for a detailed comparison.
What are the best areas to invest in Bracknell?
RG12 (Bracknell South, Easthampstead) has the highest yield (4.6%), strongest five-year growth (33.4%), lowest asking price (£352,248), highest sales volume (55 per month), and the lowest deposit requirement (£105,674 at 30%). GU47 (Sandhurst, College Town) is the second most affordable at £477,308 with the highest turnover rate at 39%. RG42 (Bracknell North, Warfield) has a 4.3% yield with higher rents (£1,828/month) but negative three-year growth (-1.0%). SL4 and SL5 have higher rents and prices but lower yields and weaker recent growth. Browse off-market property in the South East.
Can I find buy-to-let property under £300,000 in Bracknell?
Sub-£300,000 properties exist in Bracknell but sit below the RG12 postcode average of £352,248. RG12's average includes family houses. The Land Registry data shows flats in Bracknell Forest averaging £219,249, which is level with the England average for flats. Individual flats and smaller terraced houses in RG12 and RG42 transact below £300,000. RG12 records 55 sales per month. Repossessed properties can also list below postcode averages.
What is the weather like in Bracknell?
Bracknell has a temperate maritime climate with an average annual temperature of around 10.6°C. Summer highs reach approximately 21°C in July, while January averages sit close to freezing. Annual rainfall is moderate at around 736mm, spread fairly evenly across the year. The town's inland position in Berkshire means it avoids the coastal exposure that affects building exteriors in seaside locations.