Where to Buy Property Investments in Canterbury: Yields of 5.1%
Canterbury is a cathedral city and district in east Kent, 61 miles south-east of London. Gross rental yields range from 3.7% to 5.1% across all six postcodes, with CT1 delivering the highest returns. Average sold prices sit 14.9% above the England average but 11.5% below the South East regional average. The district's population grew 4.16% to 157,432 between the 2011 and 2021 censuses.
Canterbury's average sold price of £335,342 places it in an unusual position for buy-to-let property investors. Above the national average, yet meaningfully below the South East region where the typical sold price is £378,800. That discount to the regional average creates relative value that most Kent locations cannot match. Asking prices start from £304,981 in CT1, and all six postcodes have full rental data.
This guide covers all 6 Canterbury postcodes from CT1 to CT6 under the Canterbury district local authority (ONS code E07000106). The district spans Canterbury city centre, the villages of Chartham, Bridge, Wingham and Littlebourne, and the coastal towns of Whitstable and Herne Bay. Investors comparing options across the region can explore our guides to Brighton and Kent, or browse all South East location guides.
Article updated: March 2026
Canterbury Buy-to-Let Market Overview 2026
Canterbury sits above the England average for sold prices but below the South East region, with two universities driving consistent rental demand across the district's urban, village, and coastal postcodes.
- Average sold price: £335,342 (14.9% above England's £291,865)
- Asking price range: £304,981 (CT1) to £544,837 (CT4)
- Rental yields: 3.7% (CT4) to 5.1% (CT1) across all 6 postcodes
- Rental income: Monthly rents from £1,188 (CT6) to £1,697 (CT4)
- Price per sq ft: House prices from £341/sq ft (CT3) to £421/sq ft (CT5)
- Market activity: Sales ranging from 16 per month (CT3, CT4) to 40 per month (CT6)
- Deposit requirements: 30% deposits range from £91,494 (CT1) to £163,451 (CT4)
- Affordability ratios: Property prices from 8.1 to 14.5 times Canterbury's median annual salary of £37,682
Contents

-
by Robert Jones, Founder of Property Investments UK
With two decades in UK property, Rob has been investing in buy-to-let since 2005, and uses property data to develop tools for property market analysis.

Property Data Sources
Our location guide relies on diverse, authoritative datasets including:
- HM Land Registry UK House Price Index
- Ministry of Housing, Communities and Local Government
- Ordnance Survey Data Hub
- Propertydata.co.uk
We update our property data quarterly to ensure accuracy. Last update: March 2026. All data is presented as provided by our sources without adjustments or amendments.
Why Invest in Canterbury?
Canterbury's rental demand is underwritten by two universities, a UNESCO World Heritage cathedral, and a major NHS hospital trust. Canterbury Cathedral, a UNESCO World Heritage Site since 1988, anchors a tourism and heritage sector that draws over a million visitors each year. That visitor economy sustains the city centre's retail, hospitality, and service businesses and creates consistent demand for short-term and long-term rental accommodation.
The University of Kent and Canterbury Christ Church University between them bring tens of thousands of students into the district each academic year. Students and university staff generate reliable rental demand in CT1 (City Centre) and CT2 (St Dunstans, Hales Place), the two postcodes closest to both campuses. CT1 and CT2 are the popular areas for HMOs in Canterbury, where shared student houses deliver per-room income that exceeds the single-let averages in this guide.
Canterbury Christ Church University runs healthcare training programmes linked to the East Kent Hospitals University NHS Foundation Trust, adding a professional tenant pipeline beyond the traditional student market. Student accommodation in Canterbury city centre clusters around both campuses, and HMO landlords in CT1 report consistently low void rates outside the summer break.
Between the 2011 and 2021 censuses, Canterbury's population grew from 151,145 to 157,432, a rise of 4.16%. Canterbury's growth is constrained by the Kent Downs Area of Outstanding Natural Beauty and green belt land surrounding the city, which limits new housing supply. For investors, that supply constraint is structural. It supports long-term price stability in a way that cities with sprawling development land cannot.
Earnings in Canterbury sit below both the regional and national medians. The median annual salary is £37,682, compared to £800.30 per week across the South East and £752.40 per week for Great Britain. Lower local wages make the headline sold prices of £335,342 look expensive relative to what Canterbury workers earn. But rental demand in Canterbury is not driven solely by local wages. University staff, commuters to London (Canterbury East and Canterbury West both have high-speed services), and coastal lifestyle tenants in Whitstable and Herne Bay all contribute to a tenant pool that extends well beyond the local median salary.
Kent and Canterbury Hospital, part of the East Kent Hospitals University NHS Foundation Trust, is the district's largest single-site employer. Healthcare workers form a reliable tenant demographic: employed, salaried, and often relocating for training rotations.
Canterbury Economic Summary
- Population: 157,432 (2021 Census). Growth of 4.16% from 2011.
- Median annual salary: £37,682 (Canterbury), £800.30/week (South East), £752.40/week (Great Britain)
- Employment rate: 67.1% (Canterbury)
- Unemployment rate: Not available (sample size suppressed)
- Key employment sectors: Higher education, tourism and heritage, healthcare, public sector, retail and hospitality
Source: ONS Census 2021, Nomis Labour Market Profile (ASHE 2025)
Canterbury's employment rate of 67.1% looks low on paper. That figure is heavily influenced by the district's large student population, who are economically inactive in labour market statistics. The unemployment rate is suppressed by Nomis due to small sample sizes, which typically indicates very low unemployment rather than data concerns. For buy-to-let investors, the combination of two universities, a major hospital trust, and high-speed rail links to London creates a tenant demand profile that is more resilient than the headline employment rate suggests.
Source: Office for National Statistics - Population for Canterbury
Regeneration and Investment in Canterbury
Canterbury has £22.6m of Levelling Up funding under construction in the city centre and a Local Plan identifying sites for 23,000 new homes across the district. The investment pipeline spans active construction through to strategic planning.
- Canterbury Levelling Up Fund (under construction, £22.6m): Government-funded transformation of Canterbury city centre including public realm improvements, new cultural facilities, and enhanced pedestrian connectivity. The project is designed to increase footfall and commercial activity in the historic core. Updates at KentOnline.
- Canterbury Local Plan (pre-submission, 23,000 homes): The emerging Local Plan identifies sites for approximately 23,000 new homes across the district, along with new roads, schools, and community infrastructure. For investors, this signals long-term population growth and rental demand expansion across all six postcodes. Updates at KentOnline.
- Canterbury District Town Centre Strategies (planning stage): Canterbury City Council has commissioned strategic visions for Canterbury, Whitstable, and Herne Bay town centres, aimed at attracting private investment and revitalising high street activity. The strategies cover retail diversification, public space improvements, and mixed-use development opportunities. Updates at KentOnline.

Canterbury Property Market Analysis
When Was the Last House Price Crash in Canterbury?
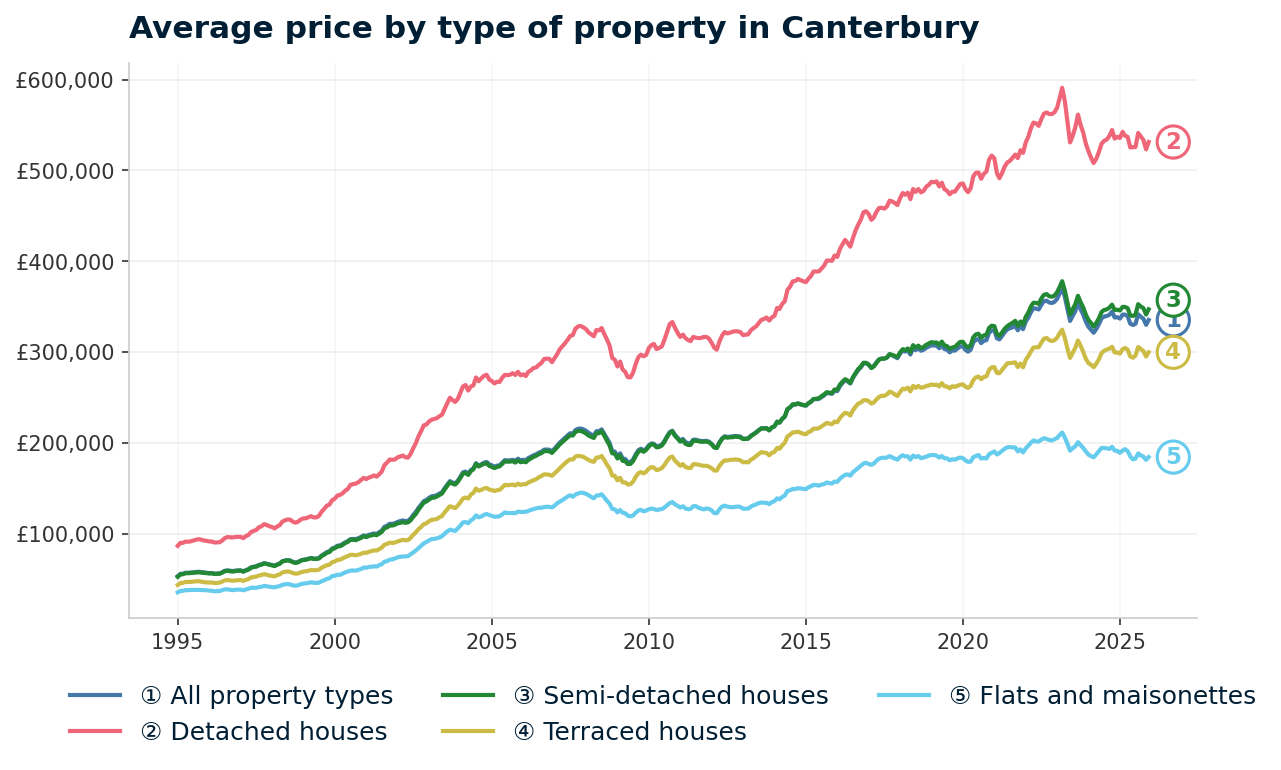
Canterbury's peak-to-trough decline during the 2008 financial crisis was 17.2%, less severe than England overall (-18.2%) and the South East region (-20.0%). All sold property prices from the HM Land Registry House Price Index are available at the Canterbury district level. The data runs from January 1995 to December 2025 and shows one major crash, a long recovery, a sharp pandemic-era surge, and a recent correction from the 2023 all-time peak.
- 1995-2000 (Steady growth): Canterbury began 1995 at £53,204. Prices rose consistently through the late 1990s, reaching £84,574 by January 2000. Growth was gradual at 5-10% per year. Canterbury was building from a low base while London and the South East accelerated ahead.
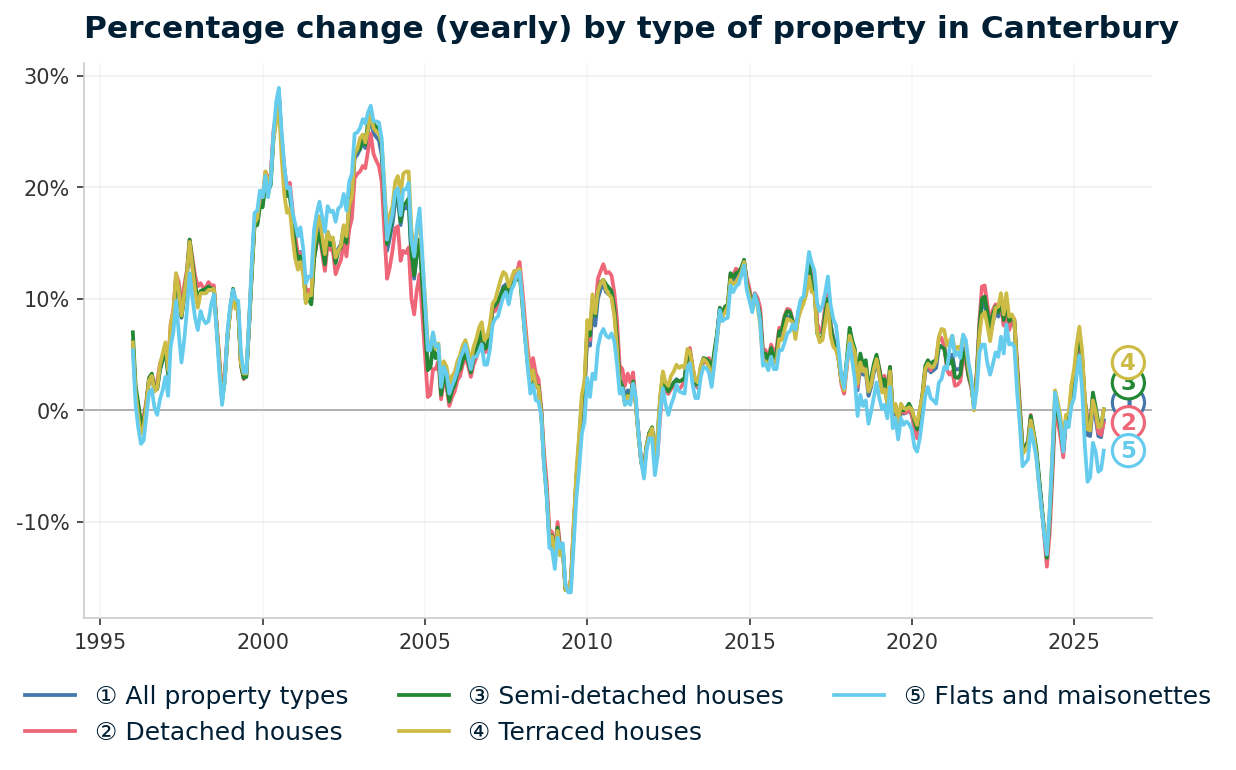
- 2000-2007 (The boom): Canterbury caught up. Prices more than doubled from £84,574 in January 2000 to a peak of £215,740 in November 2007. The strongest annual growth came in early 2004, when year-on-year change hit 19.0%. Cheap credit, rising demand from London commuters, and limited new supply in a constrained district pushed prices well beyond what local wages could support.
- 2007-2009 (The financial crisis): From the peak of £215,740 in November 2007 to the trough of £178,626 in June 2009, Canterbury lost 17.2% of its value in 19 months. The worst annual change reading was -16.1% in June 2009. All property types fell almost identically: detached -16.0%, semi-detached -16.1%, terraced -16.0%, flats -16.3%. Canterbury's peak-to-trough decline of 17.2% was less severe than England overall (-18.2%) and the South East region (-20.0%).
- 2009-2013 (Stagnation and recovery): Canterbury bounced from the trough to £193,406 by December 2009. But then growth stalled. Prices traded sideways, dipping as low as £194,621 in March 2012 before gradually climbing back. By August 2013, the average reached £215,993, finally passing the pre-crash peak. That recovery took 5 years and 9 months from the November 2007 peak.
Canterbury 2008 Crash Summary
- Pre-crash peak: £215,740 (November 2007)
- Trough: £178,626 (June 2009)
- Decline: -17.2% over 19 months
- Recovery to peak: August 2013 (5 years, 9 months)
- 2014-2016 (Strong growth): Canterbury entered a sustained growth phase. Annual changes exceeded 13% in late 2014 and late 2016. By December 2016, prices had reached £287,879. London commuter demand via high-speed rail services and limited supply in the AONB-constrained district drove this acceleration. Canterbury was no longer a slow-growth market.
- 2017-2019 (Pre-pandemic growth): Growth moderated to 1-3% per year. Prices rose from £285,978 in January 2017 to £306,110 by December 2019. Steady, unremarkable appreciation. The market was absorbing the gains of 2014-2016 without overheating.
- 2020-2022 (Pandemic surge): The stamp duty holiday and the shift toward lifestyle locations hit Canterbury. Prices jumped from £300,362 in March 2020 to £355,264 by December 2022. That is 18.3% growth in under three years. Whitstable and Herne Bay, with their coastal appeal, saw particular demand from London leavers.
- 2023 (Correction from peak): Canterbury hit its all-time peak of £370,486 in March 2023. Then prices reversed. By December 2023, the average had fallen to £333,570. Interest rate rises cooled demand, particularly in the higher-priced coastal and village postcodes.
- 2024-2025 (Stabilisation): The correction deepened in early 2024, with annual change hitting -8.6% in January 2024. But by December 2025, the annual decline had narrowed to just -0.9%, with the average at £335,342. Canterbury now sits 55.4% above its pre-crisis 2007 peak but 9.5% below its March 2023 all-time high.
Long-Term Property Value Growth in Canterbury
- 5 years (2020-2025): +3.5% (£323,873 to £335,342)
- 10 years (2015-2025): +30.2% (£257,595 to £335,342)
- 15 years (2010-2025): +63.1% (£205,629 to £335,342)
- 20 years (2005-2025): +85.6% (£180,656 to £335,342)
- 30 years (1995-2025): +489.2% (£56,910 to £335,342)
The 2008 crash is the reference point for Canterbury investors assessing downside exposure. A 17.2% decline took nearly six years to recover. The current correction from the 2023 peak is smaller in percentage terms (9.5%) and appears to be stabilising, with annual declines narrowing to -0.9% by December 2025. Canterbury's structural advantages are largely unchanged: two universities are still enrolling, the cathedral still draws visitors, and high-speed rail links to London still run. What has changed since 2007 is that Canterbury's commuter role is now embedded, not aspirational. The question is whether the pandemic-era price surge was justified or whether further correction is needed before growth resumes.
Source: HM Land Registry House Price Index for Canterbury, January 1995 to December 2025.
Thinking of Buying?
We have off-market investment properties averaging 8%+ annual yield.
View Property DealsSold House Prices in Canterbury
Canterbury's average sold price of £335,342 sits 14.9% above England's £291,865 but 11.5% below the South East's £378,800. That gap between national and regional positioning is the defining feature of Canterbury's market. It is more expensive than England, yet offers relative value within its own region. The size of the premium varies dramatically by property type.
Canterbury's terraced houses show the largest premium at 22.4% above England. At £299,740 versus England's £244,830, terraced stock in Canterbury commands a significant uplift. Two-university demand for HMO conversions, combined with the appeal of Victorian terraces near the city centre, pushes terraced prices well above the national average.
| Property Type | Canterbury Average | England Average | Difference |
|---|---|---|---|
| Detached houses | £531,356 | £471,667 | +12.7% |
| Semi-detached houses | £347,065 | £289,135 | +20.0% |
| Terraced houses | £299,740 | £244,830 | +22.4% |
| Flats and maisonettes | £184,296 | £219,340 | -16.0% |
| All property types | £335,342 | £291,865 | +14.9% |
Detached houses sit 12.7% above England at £531,356. Canterbury's detached stock is concentrated in the village postcodes of CT3 (Wingham, Littlebourne) and CT4 (Chartham, Bridge), where period properties and rural homes attract lifestyle buyers from London and the wider South East. The premium is moderate compared to terraced and semi-detached because Canterbury's detached market competes directly with other Kent villages.
Semi-detached houses command a 20.0% premium at £347,065. Family housing demand in Canterbury is strong. High-speed commuter services to London, combined with two universities and a major hospital, mean the professional family tenant pool is deeper than in many South East towns of similar size.
Terraced houses at £299,740 carry the widest premium at 22.4%. Canterbury's terraced stock near the city centre and university areas has been transformed by the student letting market. HMO conversions and professional house-shares push per-property values above what the individual terraced house would command in a purely owner-occupier market.
Flats are the exception. At £184,296, Canterbury's flat prices sit 16.0% below England's £219,340. This is the only property type trading below the national average. Canterbury lacks the large-scale new-build apartment developments that inflate flat prices in cities like Brighton or Reading. The flat stock here is older conversions and smaller purpose-built blocks. For yield-focused investors, that discount on flats is the entry point where Canterbury's numbers start to look different from the headline sold price.
Property Data Sources
Our location guide relies on diverse, authoritative datasets including:
- HM Land Registry UK House Price Index
- Ministry of Housing, Communities and Local Government
- Ordnance Survey Data Hub
- Propertydata.co.uk
We update our property data quarterly to ensure accuracy. Last update: March 2026. All data is presented as provided by our sources without adjustments or amendments.
Price Per Square Foot in Canterbury
Canterbury's price per square foot ranges from £341 in CT3 to £421 in CT5 (Whitstable), a spread of £80 per square foot across the district. Price per square foot strips out the distortion caused by different property sizes. A postcode with large detached houses will show high average prices simply because the properties are bigger. This metric reveals what the underlying land and location premium actually costs.
| Rank | Area | Price Per Sq Ft |
|---|---|---|
| 1 | CT3 (Wingham, Littlebourne) | £341 |
| 2 | CT1 (City Centre) | £345 |
| 3 | CT6 (Herne Bay) | £350 |
| 4 | CT2 (St Dunstans, Hales Place) | £351 |
| 5 | CT4 (Chartham, Bridge) | £373 |
| 6 | CT5 (Whitstable) | £421 |
CT1 City Centre at £345 per square foot sits close to the cheapest in the district. The city centre's lower per-foot cost reflects older, smaller properties including flats and terraced houses near the university areas. For investors, CT1 offers the second-cheapest space in Canterbury while delivering the highest gross yield at 5.1%. No other Canterbury postcode combines that cost per square foot with a 5.1% gross yield.
CT5 Whitstable at £421 per square foot is the clear premium postcode. The seaside town's appeal to London leavers and lifestyle buyers has pushed per-foot costs 23.5% above the cheapest postcodes. Whitstable's harbour, independent restaurants, and creative community have made it one of Kent's most desirable coastal addresses. Investors pay for that desirability in the price per square foot, but it shows in the yield data too: CT5 delivers just 3.9% gross yield, the third lowest in the district.
Four postcodes cluster between £341 and £351. CT3, CT1, CT6, and CT2 are within £10 per square foot of each other, suggesting similar underlying property values once size differences are removed. CT4 at £373 sits in a middle tier, reflecting its mix of village properties and larger rural homes.
Figures reflect averages across all property types and ages. Individual values depend on condition, location within the postcode, and building age.
For Sale Asking Prices in Canterbury
The gap between CT1 and CT4 tells the story of Canterbury's two markets. Canterbury's asking prices range from £304,981 in CT1 (City Centre) to £544,837 in CT4 (Chartham, Bridge), a span of nearly £240,000 within a single district. Remove the CT4 premium and the remaining five postcodes fall within a £125,000 range. That is a manageable spread for investors comparing entry points.
Asking prices reflect what sellers and agents expect the market to pay. They are not the same as sold prices from the Land Registry, which capture completed transactions. In a market where Canterbury's annual sold price change is -0.9%, asking prices may sit above what eventually transacts.
| Rank | Area | Average Asking Price |
|---|---|---|
| 1 | CT1 (City Centre) | £304,981 |
| 2 | CT6 (Herne Bay) | £372,405 |
| 3 | CT2 (St Dunstans, Hales Place) | £373,811 |
| 4 | CT3 (Wingham, Littlebourne) | £409,943 |
| 5 | CT5 (Whitstable) | £429,663 |
| 6 | CT4 (Chartham, Bridge) | £544,837 |
CT1 at £304,981 is the only postcode under £310,000. It is also the yield leader at 5.1% and the only postcode with positive growth across all three time horizons. The city centre combines Canterbury's cheapest entry point with its strongest rental performance. CT6 Herne Bay and CT2 St Dunstans sit closely together at £372,405 and £373,811, forming a natural second tier.
CT4 Chartham and Bridge at £544,837 is a different market entirely. Period village properties, larger plots, and rural character push asking prices 79% above CT1. Yet CT4 delivers the lowest yield in the district at 3.7% and negative growth across all three timeframes (-15.2% one-year, -13.2% three-year, -1.4% five-year). The postcard villages are where Canterbury's numbers work least well for income-focused investors.
The mean asking price across all six Canterbury postcodes is £405,940. That figure appears in the comparison section later, where Canterbury is measured against Maidstone, Medway, Eastbourne, and Hastings.
For investors looking for entry points below the Canterbury average, below market value properties can occasionally surface in CT1 and CT6 where older stock comes to market at prices below the postcode average. Canterbury's older housing stock also creates opportunities for renovation properties, particularly Victorian terraces in CT1 where value-add refurbishment can shift the yield calculation. Occasionally, repossessed properties surface in the district at prices below the postcode averages shown above.

House Price Growth in Canterbury
Are Canterbury's most expensive postcodes growing fastest? The opposite. Only one of Canterbury's six postcodes shows positive growth across all three timeframes, while CT4's five-year figure of -1.4% means investors who bought at the top of that market are sitting on a loss.
Five-year growth matters most for buy-to-let investors because it captures a full cycle and filters out short-term noise. One-year figures can swing on a handful of transactions. The five-year column shows where genuine appreciation has occurred.
| Area | 1 Year | 3 Years | 5 Years |
|---|---|---|---|
| CT3 (Wingham, Littlebourne) | 5.5% | -16.6% | 14.2% |
| CT6 (Herne Bay) | 1.4% | -5.0% | 6.9% |
| CT1 (City Centre) | 4.0% | 8.0% | 5.8% |
| CT2 (St Dunstans, Hales Place) | -3.4% | -8.3% | 4.3% |
| CT5 (Whitstable) | -6.8% | -6.8% | 2.6% |
| CT4 (Chartham, Bridge) | -15.2% | -13.2% | -1.4% |
CT3 leads on five-year growth at 14.2%, but the three-year figure of -16.6% tells a different story. That swing suggests CT3 surged early in the five-year window (likely during the pandemic stamp duty holiday) and has since given back a significant portion of those gains. Rural village postcodes like CT3 are more volatile than urban areas because individual high-value transactions can move the average significantly when monthly sales volumes are just 16.
CT1 is the only Canterbury postcode with positive growth across all three horizons. At 4.0% one-year, 8.0% three-year, and 5.8% five-year, the city centre has delivered consistent appreciation. CT1 is not the headline growth leader, but it is the most stable. For investors building a long-term portfolio, consistency matters more than a volatile five-year number that masks a three-year decline.
CT4 is negative across every timeframe. One-year growth of -15.2%, three-year of -13.2%, and five-year of -1.4%. The premium village market in Chartham and Bridge has been correcting since the pandemic peak. At £544,837 asking price, CT4 is Canterbury's most expensive postcode and the one where the post-pandemic adjustment has been most pronounced.
CT5 Whitstable shows the same pattern as CT4, just less extreme. Negative one-year (-6.8%) and three-year (-6.8%) growth, with a marginal five-year gain of 2.6%. The lifestyle coastal premium that drove Whitstable's pandemic surge is unwinding. Investors who bought in 2020-2021 are still in positive territory over five years, but the trajectory is downward.
Monthly Property Sales in Canterbury
Herne Bay dominates Canterbury's transaction volumes. CT6 records 40 sales per month, nearly double the city centre's 21 and more than twice the 16 transactions in CT3 and CT4. For investors, that liquidity matters at exit. If you need to sell, CT6 has the deepest buyer pool in the district.
| Area | Sales Per Month | Turnover | Asking Price |
|---|---|---|---|
| CT6 (Herne Bay) | 40 | 9% | £372,405 |
| CT5 (Whitstable) | 28 | 6% | £429,663 |
| CT2 (St Dunstans, Hales Place) | 24 | 10% | £373,811 |
| CT1 (City Centre) | 21 | 7% | £304,981 |
| CT3 (Wingham, Littlebourne) | 16 | 7% | £409,943 |
| CT4 (Chartham, Bridge) | 16 | 16% | £544,837 |
CT5 Whitstable at 28 sales per month with a 6% turnover rate presents an interesting combination. Healthy transaction volumes but low turnover suggest a large stock base where most owners hold long-term. Whitstable's owner-occupier and lifestyle buyer market means properties change hands relatively infrequently despite steady demand. For investors looking to exit, the volume is adequate but not as liquid as CT6.
CT4 has the highest turnover at 16% despite tying for the lowest sales volume at 16 per month. High turnover with low volume means a smaller stock base is turning over quickly. Combined with CT4's negative growth data across all timeframes, this suggests sellers are exiting the premium village market while buyer activity remains steady at a lower level.
CT1 City Centre at 21 sales per month and 7% turnover is a holding market. Landlords with city centre rental stock are not selling. Low turnover in the yield-leading postcode confirms that investors are generating returns and staying put. If you are buying to hold for ten years or more, the low turnover tells you other investors have reached the same conclusion.
Property Data Sources
Our location guide relies on diverse, authoritative datasets including:
- HM Land Registry UK House Price Index
- Ministry of Housing, Communities and Local Government
- Ordnance Survey Data Hub
- Propertydata.co.uk
We update our property data quarterly to ensure accuracy. Last update: March 2026. All data is presented as provided by our sources without adjustments or amendments.

Canterbury Rental Market Analysis
For investors weighing up whether rental property is a worthwhile investment in Canterbury, the data below breaks down average monthly rents and gross rental yields across the district's postcodes.
All six Canterbury postcodes have rental data, with monthly rents ranging from £1,188 in CT6 to £1,697 in CT4 and gross yields from 3.7% to 5.1%. If you are looking to build a property portfolio in the South East, Canterbury's combination of university-driven demand and regional price discounts creates consistent letting conditions across urban, suburban, and coastal areas.
Average Rent & Gross Rental Yields in Canterbury
Canterbury's six postcodes deliver gross yields from 3.7% to 5.1%, with a spread of just 1.4 percentage points across the district. Canterbury average rent prices range from £1,188 per month in CT6 to £1,697 in CT4. Gross rental yield is calculated from the average asking price and average monthly rent for each postcode. It does not account for void periods, maintenance, management fees, or mortgage costs. It is a starting point for comparison, not a profit forecast.
CT1 delivers Canterbury's highest gross yield at 5.1%, where monthly rents of £1,302 meet the district's lowest asking price of £304,981. The yield spread across Canterbury is 1.4 percentage points, from 5.1% down to 3.7%. That narrow range means the difference between the best and worst yield postcodes is less dramatic than in many cities. But 1.4 percentage points on a £300,000-plus property is still significant in cash flow terms.
| Area | Average Monthly Rent | Average Asking Price | Gross Yield |
|---|---|---|---|
| CT1 (City Centre) | £1,302 | £304,981 | 5.1% |
| CT2 (St Dunstans, Hales Place) | £1,480 | £373,811 | 4.8% |
| CT3 (Wingham, Littlebourne) | £1,565 | £409,943 | 4.6% |
| CT5 (Whitstable) | £1,404 | £429,663 | 3.9% |
| CT6 (Herne Bay) | £1,188 | £372,405 | 3.8% |
| CT4 (Chartham, Bridge) | £1,697 | £544,837 | 3.7% |
CT4 commands Canterbury's highest absolute rent at £1,697 per month but delivers the lowest yield at 3.7%. The village premium in Chartham and Bridge means asking prices of £544,837 absorb the strong rental income. Investors in CT4 are not buying for yield. This is a capital growth play in a postcode where the growth data currently shows declines.
CT1 and CT2 sit at the top of the yield table at 5.1% and 4.8%. These are the university-adjacent postcodes. CT1 delivers the highest yield from the lowest price. CT2 adds nearly £69,000 to the entry cost for an extra £178 per month in rent, but the yield drops 0.3 percentage points.
The data favours CT1 for pure income investors. Canterbury student buy-to-let demand concentrates in these two postcodes. CT2 offers a slightly different tenant profile with more family and professional renters alongside the student market.
The coastal postcodes underperform on yield. CT5 Whitstable at 3.9% and CT6 Herne Bay at 3.8% sit in the lower tier. Both have asking prices that reflect lifestyle demand from owner-occupiers, pushing yields below what income investors typically target. CT6's lower rent of £1,188 (the lowest in the district) combined with a still-significant asking price of £372,405 explains why the yield compresses here.
Is Canterbury Rent High?
Every Canterbury postcode exceeds the 30% affordability benchmark. Across all six postcodes, rent ranges from 37.8% to 54.0% of the local median gross monthly salary. The general benchmark is that rent becomes stretched above 30% of gross income. Canterbury clears that threshold in every single area.
The median gross weekly salary in Canterbury is £724.70, which equates to £3,140 per month or £37,682 per year. This is below the South East regional median of £800.30 per week and the Great Britain median of £752.40 per week. Data from the Nomis Labour Market Profile (ASHE 2025).
| Rank | Area | Rent as % of Income |
|---|---|---|
| 1 | CT4 (Chartham, Bridge) | 54.0% |
| 2 | CT3 (Wingham, Littlebourne) | 49.8% |
| 3 | CT2 (St Dunstans, Hales Place) | 47.1% |
| 4 | CT5 (Whitstable) | 44.7% |
| 5 | CT1 (City Centre) | 41.5% |
| 6 | CT6 (Herne Bay) | 37.8% |
CT4 and CT3 at 54.0% and 49.8% look severely stretched. But these are village postcodes where rents of £1,697 and £1,565 per month target professional tenants who earn well above Canterbury's median. University lecturers, hospital consultants, and London commuters earning South East or London salaries are the actual tenant pool for these areas. The median salary is a district-wide figure that understates what tenants in CT4 and CT3 actually earn.
CT6 Herne Bay at 37.8% is the most affordable postcode in Canterbury. Rents of £1,188 against a local median monthly income of £3,140 place Herne Bay closest to the 30% benchmark. For investors, lower rent-to-income ratios typically mean more reliable tenants with less financial stress. CT6 also has the highest transaction volume in the district at 40 sales per month, suggesting a deep market on both sides.
CT1 at 41.5% sits in the middle of the table. The city centre's rent of £1,302 against the local median looks stretched, but the student tenant pool does not rely on local median salaries. Students are funded through loans, family support, and part-time work, and typically share properties. The per-room economics in a shared house or HMO are different from the headline single-let figure.
Thinking of Buying?
We have off-market investment properties averaging 8%+ annual yield.
View Property DealsCanterbury Buy-to-Let Considerations
Are Canterbury House Prices High? Price-to-Earnings Ratios
Every Canterbury postcode exceeds the national price-to-earnings benchmark of 7.5x, with ratios ranging from 8.1x in CT1 to 14.5x in CT4. The ratio compares each postcode's average asking price to Canterbury's median annual salary of £37,682. The national benchmark of 7.5x is calculated from England's average sold price of £291,865 against Great Britain's median annual salary of £39,125.
Purchasing a property in Canterbury requires between 8.1 and 14.5 times the median annual salary. This is based on the Nomis Labour Market Profile for Canterbury showing the median gross annual income for Canterbury residents is £37,682.
No Canterbury postcode sits below the national benchmark of 7.5x. CT1 at 8.1x comes closest, but even the cheapest entry point in the district requires over eight times the local salary. Canterbury is not an affordable market by national standards. The combination of South East location, heritage appeal, and two-university demand pushes all price-to-earnings ratios above the national average.
| Rank | Area | Price-to-Earnings Ratio |
|---|---|---|
| 1 | CT1 (City Centre) | 8.1x |
| 2 | CT6 (Herne Bay) | 9.9x |
| 3 | CT2 (St Dunstans, Hales Place) | 9.9x |
| 4 | CT3 (Wingham, Littlebourne) | 10.9x |
| 5 | CT5 (Whitstable) | 11.4x |
| 6 | CT4 (Chartham, Bridge) | 14.5x |
CT1 at 8.1x is the most accessible postcode, and it is also the yield leader. That alignment is significant. In many South East locations, the highest-yielding postcodes are in areas where price-to-earnings ratios are already stretched. Canterbury's city centre bucks that pattern. The most affordable entry point delivers the best income returns.
CT4 at 14.5x is almost double the national benchmark. Village properties in Chartham and Bridge are priced for lifestyle buyers and London commuters, not local incomes. At nearly 15 times the Canterbury median salary, CT4 is detached from local affordability in the same way as prime Surrey or Oxfordshire villages.
CT6 and CT2 both sit at 9.9x. Herne Bay and St Dunstans offer similar affordability relative to local wages, but CT2 delivers the higher yield (4.8% vs 3.8%). That difference comes from CT2's slightly lower asking price and significantly higher rent, driven by university-adjacent demand that CT6's coastal location does not generate.
Deposit Requirements in Canterbury
Canterbury is not a low-capital entry market. The cheapest 30% deposit in Canterbury is £91,494 in CT1, rising to £163,451 in CT4. Even the most affordable postcode requires a deposit approaching six figures. Most buy-to-let mortgage lenders require a minimum 25% deposit, but the table below uses a more conservative 30% to reflect the rates and products available at higher loan-to-value ratios.
| Rank | Area | 30% Deposit Required |
|---|---|---|
| 1 | CT1 (City Centre) | £91,494 |
| 2 | CT6 (Herne Bay) | £111,721 |
| 3 | CT2 (St Dunstans, Hales Place) | £112,143 |
| 4 | CT3 (Wingham, Littlebourne) | £122,983 |
| 5 | CT5 (Whitstable) | £128,899 |
| 6 | CT4 (Chartham, Bridge) | £163,451 |
CT1 at £91,494 is the clear entry point for Canterbury buy-to-let. It requires £20,000 less than the next cheapest options (CT6 and CT2 at around £112,000). That £20,000 saving buys access to the same postcode that leads on yield (5.1%), delivers consistent growth, and has the lowest price-to-earnings ratio. For investors with capital constraints, CT1 is where the numbers converge most favourably.
A clear gap separates the sub-£115,000 tier from the rest. CT3 at £122,983, CT5 at £128,899, and CT4 at £163,451 each represent a significant step up in capital commitment. The deposit difference between CT1 and CT4 is £71,957. That additional capital buys a premium village postcode with the lowest yield and negative growth. The data does not support the price premium on pure investment metrics.
Deposit is only part of the upfront cost. Budget for stamp duty (use our stamp duty calculator for an accurate figure), legal fees, and survey costs. For a full breakdown, see our guide to buy-to-let costs. Investors looking at lower-deposit routes can explore no-deposit investment property options, though these typically involve higher monthly costs.

What the Canterbury Data Tells Buy-to-Let Investors
CT1 leads on yield (5.1%), growth (positive across all three timeframes), and affordability (8.1x price-to-earnings). The postcode-level data across this guide points to a clear split between Canterbury's urban core and its village and coastal postcodes.
For yield, the numbers favour CT1 (5.1%) and CT2 (4.8%). These are the university-adjacent postcodes with 30% deposits of £91,494 and £112,143 respectively. CT1 is the only postcode with positive growth across all three timeframes (4.0% one-year, 8.0% three-year, 5.8% five-year). That convergence of yield, growth, and affordability in the same postcode is unusual for a South East district. Investors looking for investment property in Kent will find CT1's data profile stands out across multiple measures.
The coastal and village postcodes tell a different story. CT4 (Chartham, Bridge) shows negative growth at every horizon and the lowest yield at 3.7% despite the highest rents. CT5 (Whitstable) has declined over one and three years. CT6 (Herne Bay) has the lowest rent in the district and weak three-year growth.
These postcodes attract lifestyle buyers and owner-occupiers, but the investment metrics do not support entry at current asking prices for income-focused portfolios. Investors exploring the broader market may find off-market property opportunities where pricing is more favourable.
Canterbury does not have a selective licensing scheme in place. The district operates standard HMO licensing under national mandatory requirements. Properties housing five or more tenants forming two or more households require an HMO licence from Canterbury City Council.
How Canterbury Buy-to-Let Compares to Nearby Areas
Canterbury's mean asking price of £405,940 sits between Eastbourne (£333,016) and Maidstone (£477,473). The table below compares Canterbury against four nearby Kent and South East coastal locations using the same methodology: mean asking price across all postcodes, mean monthly rent across postcodes with data, and top single-postcode gross yield.
| Location | Mean Asking Price | Mean Monthly Rent | Top Gross Yield |
|---|---|---|---|
| Canterbury | £405,940 | £1,439 | 5.1% |
| Eastbourne | £333,016 | £1,287 | 5.4% |
| Medway | £338,351 | £1,356 | 6.3% |
| Hastings | £366,342 | £1,142 | 4.9% |
| Maidstone | £477,473 | £1,539 | 5.3% |
Canterbury sits in the middle of this group on price, but its top yield of 5.1% is competitive. Medway offers the highest top yield at 6.3% with a significantly lower mean asking price of £338,351. For pure income investors, Medway's numbers are stronger. But Canterbury's two-university tenant base and heritage appeal provide a depth of demand that the Medway Towns do not replicate.
Maidstone is the most expensive comparison at £477,473 mean asking price but delivers a strong top yield of 5.3%. Canterbury's mean asking price is £71,533 lower than Maidstone's, which means lower deposits for a similar yield profile. Eastbourne offers the cheapest entry with a higher top yield (5.4%), but lacks Canterbury's university-driven rental demand.
Hastings has the lowest mean rent at £1,142 and the lowest top yield at 4.9%. Canterbury's higher rents reflect its stronger tenant demand from universities and London commuters. For investors comparing across the South East, Canterbury's position between the expensive commuter towns and the more affordable coastal locations makes it a middle-ground option where both yield and tenant quality are above average for the region. See our full guide to the best buy-to-let locations for a broader comparison.
Frequently Asked Questions
Canterbury's most common investor questions centre on university demand, flat prices, and how the district compares to nearby Kent locations.
How does Canterbury compare to Maidstone for buy-to-let?
Canterbury is £71,533 cheaper on mean asking price (£405,940 vs £477,473) with a similar top yield (5.1% vs 5.3%). That price gap translates to significantly smaller deposits. Canterbury's two-university student population creates a tenant demand profile that Maidstone cannot match. Maidstone benefits from stronger London commuter connectivity and a larger commercial economy. Canterbury offers lower entry costs with comparable yields and a more diverse tenant base including students, healthcare workers, and tourism-linked professionals.
Is student accommodation a good investment in Canterbury?
Two universities and a consistent shared housing market make Canterbury one of the stronger student letting locations in the South East. The University of Kent and Canterbury Christ Church University create demand concentrated in CT1 and CT2. The headline single-let figures in this guide understate what experienced landlords achieve through HMO lettings, where per-room income typically exceeds the per-property average. Seasonal void risk exists during summer months, though Canterbury's tourism economy and year-round university programmes help mitigate extended vacancies. For a broader view of the sector, see our guide to purpose-built student accommodation.
Is Canterbury expensive for property investment?
Above the England average, but below the South East regional average. Canterbury's average sold price of £335,342 is 14.9% above England's £291,865, but 11.5% below the South East's £378,800. Compared to nearby Kent locations like Maidstone (£477,473 mean asking price) or Brighton (£420,745), Canterbury offers relative value. The most affordable entry point is CT1 (City Centre) at £304,981, with a 30% deposit of £91,494.
Are there property investment companies operating in Canterbury?
Yes, several firms market buy-to-let properties in Canterbury and the wider Kent area, particularly new-build developments. Any company offering guaranteed yields or charging sourcing fees above 2-3% of purchase price warrants scrutiny. The data in this guide covers the open market. Any property sold through an investment company can be benchmarked against these figures, but the advertised yield and the actual market yield are often different. The open-market data provides the baseline for comparison.
Are Canterbury flats a good entry point for buy-to-let?
Canterbury flats average £184,296, which is 16.0% below the England average of £219,340. That makes flats the only property type in Canterbury trading below the national average. Flats in Canterbury are predominantly older conversions and smaller purpose-built blocks rather than large new-build apartment schemes. In CT1 and CT6, individual flats regularly list below £200,000, placing 30% deposits under £60,000. The lower entry cost shifts the yield arithmetic. For investors looking at flats to buy in Canterbury, the city centre and Herne Bay offer the most accessible price points.
What is the student accommodation market like in Canterbury?
Canterbury has two universities generating year-round rental demand. The University of Kent and Canterbury Christ Church University between them support a significant shared housing market concentrated in CT1 and CT2. HMO rent prices in Canterbury reflect per-room lettings that typically exceed the single-let averages shown in this guide. Canterbury Christ Church University also trains healthcare professionals, adding a non-student professional tenant pipeline. Seasonal void periods exist over summer, though Canterbury's tourism economy and year-round postgraduate programmes help fill gaps.
Can I find buy-to-let property in Canterbury under £300,000?
Canterbury's average flat price is £184,296 from the Land Registry, so sub-£300,000 stock exists, particularly in CT1 and CT6. The average asking prices in this guide range from £304,981 (CT1) to £544,837 (CT4), but these are postcode averages across all property types. Individual flats and smaller terraced properties do list below £300,000, especially older stock and ex-local authority properties. At that price point, a 30% deposit is under £90,000. At the lower end of the market, the specific property, lease terms, service charges, and building condition all need checking before committing.