
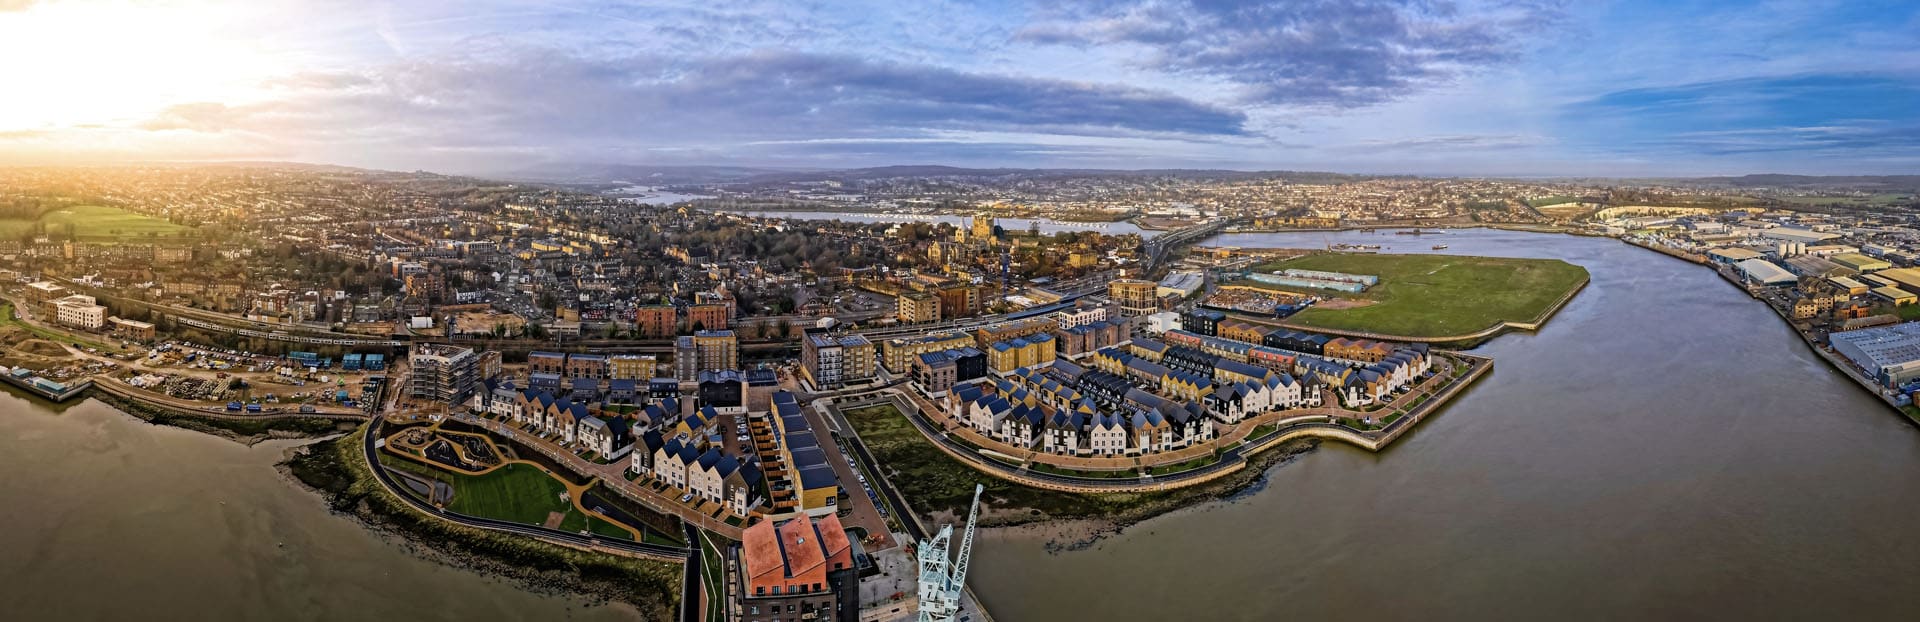
The Medway Towns are a conurbation in Kent, in the South East of England. Average sold prices across Medway sit at £297,435 on the HM Land Registry House Price Index, just 2.6% above the England average of £289,946, while the cheapest postcode, ME4 in Chatham, carries an asking price of £245,959. That combination is the whole story of the Medway Towns: a large south-east conurbation priced within touching distance of the national average, less than 40 miles from central London, where the cheapest postcode also happens to deliver the highest rental yield. The local authority's population grew 6.0% between the 2011 and 2021 censuses, from 263,925 to 279,773 residents.
Medway is not one town but five that have grown into each other: Chatham, Gillingham, Rochester, Strood and Rainham, plus the outlying areas around Walderslade and the Hoo Peninsula. Median gross weekly earnings across the local authority are £762.00, which is below the South East regional median of £800.30 but above the Great Britain median of £752.40. That wage base supports steady local tenant demand across ten postcodes, and the spread between ME4 in Chatham at £245,959 and ME3 around Hoo at £413,566 creates a wide two-tier market inside a single conurbation.
This guide covers the unitary authority of Medway (ONS code E06000035) across the ME1 to ME8 postcodes plus the neighbouring DA12, ME14 and ME20 areas that share the Medway property market. Medway sits in the South East region on the River Medway in north Kent, with fast trains reaching London St Pancras in around 40 minutes. The wider Kent buy-to-let region also includes Maidstone to the south and the coastal towns to the east.
Article updated: July 2026
Why Invest in the Medway Towns?
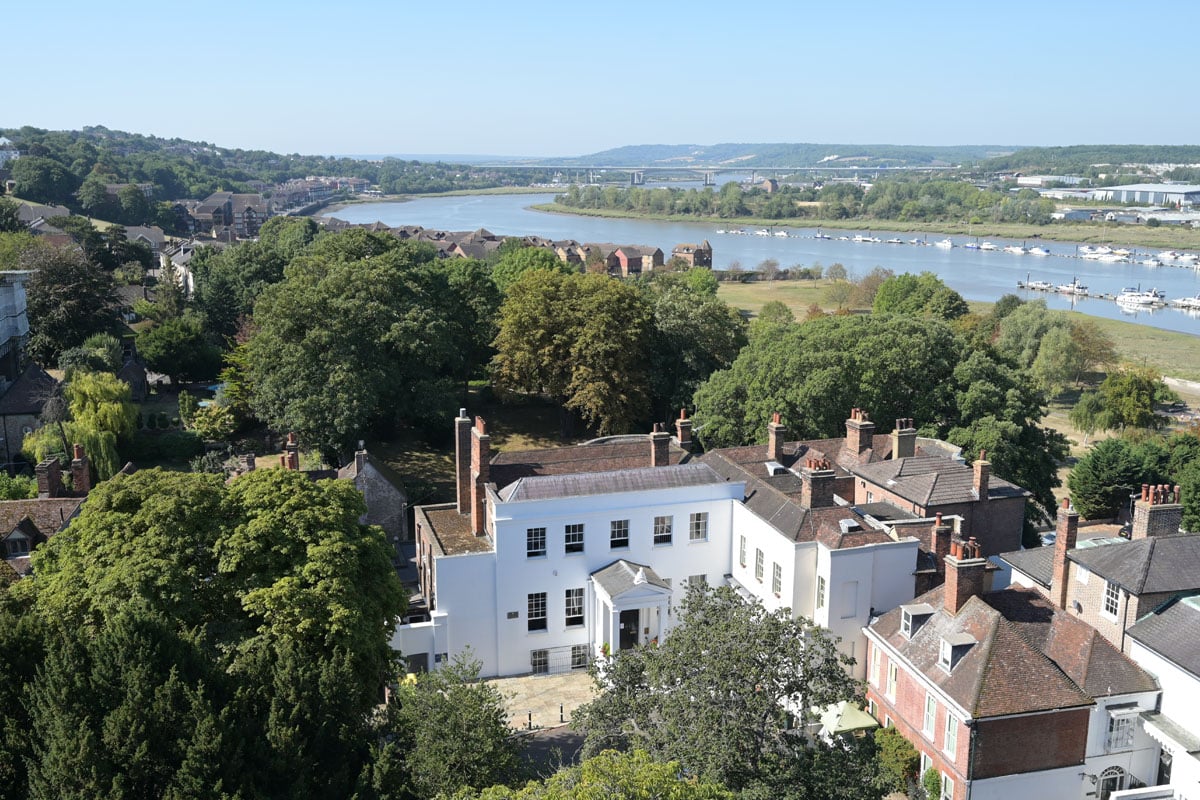
Medway grew its population 6.0% between the 2011 and 2021 censuses, from 263,925 to 279,773 residents, making it the largest urban area in Kent. That growth sits close to the England and Wales average of 6.3% and has been driven in part by households moving out of London in search of cheaper space within commuting distance. Medway's appeal rests on that London link, a working river frontage, and a heritage running from Rochester Castle and Cathedral to the historic naval dockyard at Chatham.
The local employment rate of 81.7% is above the Great Britain average of 75.6%, and unemployment sits at 3.7%. The economy was built on the maritime trades around the Chatham dockyard and now runs on services, distribution and light industry, helped by the M2, A2 and M20 roads that make north Kent a logistics corridor between London and the Channel ports. The Universities at Medway campus, shared between the University of Kent, the University of Greenwich and Canterbury Christ Church University, adds a modest student population concentrated around Chatham Maritime.
Median gross annual earnings across Medway are £39,622, which is above the Great Britain median of £39,125 but below the South East regional median of roughly £41,600. Local wages that broadly track the national average, rather than the higher South East figure, are part of why Medway prices sit so close to the England line while much of the surrounding county trades well above it.
Medway Economic Summary
- Population (Medway): 279,773 (2021 Census). Growth of 6.0% from 2011.
- Median annual salary: £39,622 (local), £39,125 (Great Britain)
- Employment rate: 81.7% (local), 75.6% (Great Britain)
- Unemployment rate: 3.7% (local)
- Key employment sectors: Wholesale and retail, health and social work, transport and storage, education, construction
Source: ONS Census 2021, Nomis Labour Market Profile (ASHE 2025)
Regeneration and Investment in the Medway Towns
Medway's regeneration is concentrated along the waterfront, from the completed Chatham Maritime scheme on the former dockyard to the planned Lower Thames Crossing that will reshape road access to north Kent. The council coordinates a long-running regeneration programme aimed at bringing new homes and commercial space onto brownfield river sites.
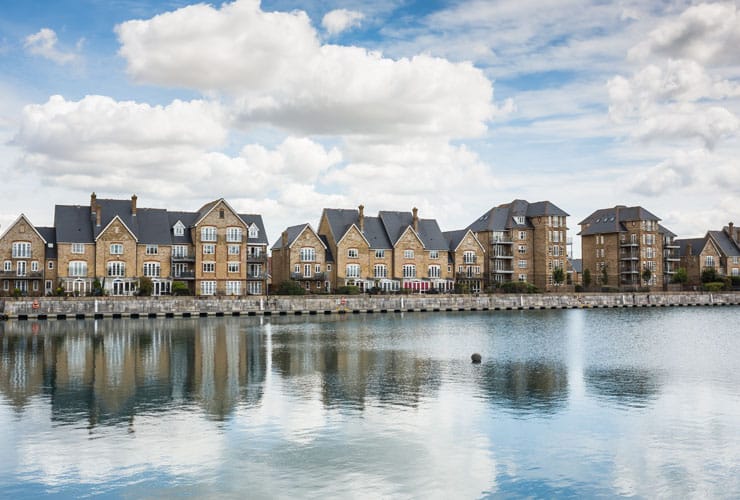
- Chatham Waters and Chatham Maritime (Delivered and ongoing): The former naval dockyard land north of Chatham has been redeveloped into a mix of new housing, offices, retail and a university campus around St Mary's Island and Chatham Waters. The scheme has added a substantial residential component to Chatham and anchored the Universities at Medway presence. Updates at Medway Council regeneration programme.
- Lower Thames Crossing (Planned): The proposed new road crossing of the River Thames linking Kent to Essex is expected to connect to the A2 and M2 near Strood, easing the congestion at the Dartford Crossing. National Highways has been progressing the scheme through the planning process, and better road access is a long-term factor in Medway's position as a place to work and live within the London orbit. Updates at National Highways.
- Universities at Medway (Active): The shared campus between the University of Kent, the University of Greenwich and Canterbury Christ Church University sits at Chatham Maritime and supports a small but steady student rental market within walking distance of the site. It is the main driver of the student and HMO demand that exists in the ME4 and ME7 postcodes. Updates at Universities at Medway.
Medway Towns Property Market Analysis
Average property prices across Medway have risen 531.3% since January 1995, from £47,115 to £297,435. The sections below trace that journey cycle by cycle, then drill into current postcode-level data for sold prices, price per square foot, asking prices, growth trends and monthly transaction volumes.
When was the last house price crash in the Medway Towns?
The Medway Towns sit within the unitary authority of Medway, so all sold property prices from HM Land Registry are recorded at this level. The Land Registry House Price Index tracks average prices from January 1995 to March 2026, covering 31 years of market cycles.
The 1995 to 2007 boom: Medway started at £47,115 in January 1995 and drifted to £44,648 by December that year, the cheapest the index has ever recorded here. By December 2000, prices had reached £75,682, and the early 2000s ran hot: the average passed £147,991 by December 2005. The market peaked at £169,743 in December 2007 after a decade of near-continuous gains fuelled by rising mortgage availability.
2008 to 2009, the financial crisis: Prices fell from the December 2007 peak of £169,743 to a trough of £132,011 in May 2009, a decline of 22.2% over 17 months. The worst year-on-year reading was -20.7% in May 2009. Medway fell more steeply than markets built on higher-value stock: as an affordable commuter belt with a large mortgaged owner base, it was exposed to the credit squeeze rather than protected from it.
The 2010 to 2013 stagnation: Prices bounced off the May 2009 trough but then drifted sideways. By December 2010 the average stood at £148,249, and it was still only £149,740 by December 2012 before edging up to £159,656 by December 2013. Medway spent close to four years stuck below its pre-crash peak.
Recovery, 2014 to 2016: Growth returned sharply. Prices first passed the December 2007 peak of £169,743 in June 2014, at £170,690, roughly six and a half years after the crash began. Momentum built through the commuter surge, with the average reaching £208,620 by March 2016 as London buyers priced into cheaper north Kent stock.
The 2017 to 2019 slowdown: The rapid catch-up cooled. Prices moved from £242,114 in December 2017 to £245,439 in December 2018, then slipped to £238,465 by December 2019 as the post-referendum south-east market softened. Annual growth turned briefly negative at -2.8% in that final month.
2020 to 2022, the pandemic surge: The stamp duty holiday and the race for space reignited Medway. Prices climbed from £241,360 in June 2020 to £250,994 by December 2020, then £273,357 by December 2021 (8.9% annual). The run topped out at an all-time high of £302,237 in January 2023.
The 2023 rate shock: Higher mortgage rates cooled the market from that January 2023 high. Prices eased to £288,290 by June 2023 and £289,309 by December 2023, with the annual reading falling to -4.1%. Medway's affordable, mortgage-reliant buyer base felt higher rates quickly.
2024 to present: The market steadied. Prices recovered from £283,970 in July 2024 to £296,497 by March 2025, and the latest reading is £297,435 in March 2026. That still sits marginally below the January 2023 peak of £302,237, and it is 75.2% above the December 2007 pre-crash peak.
Long-term growth summary:
- 5 years (March 2021 to March 2026): 15.7% growth (£257,026 to £297,435)
- 10 years (March 2016 to March 2026): 42.6% growth (£208,620 to £297,435)
- 15 years (March 2011 to March 2026): 101.4% growth (£147,683 to £297,435)
- 20 years (March 2006 to March 2026): 101.1% growth (£147,931 to £297,435)
- 30 years (January 1995 to March 2026): 531.3% growth (£47,115 to £297,435)
Medway's 22.2% crash was deeper than England's fall of 18.2% across the same downturn, and the recovery to the old peak took around six and a half years. The 30-year return of 531.3% is stronger than many higher-priced south-east markets, a reflection of how far a cheap commuter belt can travel when London demand spills outward. An investor who bought at the exact peak in December 2007 would now be sitting on gains of 75.2% on the Land Registry average.
- All property types
- Detached
- Semi-detached
- Terraced
- Flats
Source: HM Land Registry House Price Index
| Year | All property types | Detached | Semi-detached | Terraced | Flats |
|---|---|---|---|---|---|
| 1995-01 | £47,115 | £87,861 | £54,173 | £41,938 | £33,689 |
| 1995-02 | £45,887 | £84,936 | £52,929 | £40,836 | £32,831 |
| 1995-03 | £45,999 | £84,822 | £53,035 | £40,995 | £32,872 |
| 1995-04 | £45,281 | £83,112 | £52,229 | £40,386 | £32,386 |
| 1995-05 | £45,802 | £84,002 | £52,802 | £40,869 | £32,779 |
| 1995-06 | £45,771 | £84,117 | £52,837 | £40,763 | £32,880 |
| 1995-07 | £46,147 | £85,153 | £53,277 | £41,086 | £32,969 |
| 1995-08 | £46,400 | £86,197 | £53,551 | £41,292 | £32,900 |
| 1995-09 | £46,266 | £86,092 | £53,366 | £41,214 | £32,554 |
| 1995-10 | £45,271 | £84,415 | £52,375 | £40,202 | £32,018 |
| 1995-11 | £44,670 | £83,290 | £51,768 | £39,589 | £31,799 |
| 1995-12 | £44,648 | £83,290 | £51,809 | £39,509 | £31,913 |
| 1996-01 | £45,927 | £85,831 | £53,260 | £40,673 | £32,633 |
| 1996-02 | £46,520 | £86,802 | £54,002 | £41,210 | £32,969 |
| 1996-03 | £46,360 | £86,752 | £53,943 | £41,000 | £32,717 |
| 1996-04 | £45,889 | £85,585 | £53,330 | £40,650 | £32,454 |
| 1996-05 | £45,458 | £84,619 | £52,686 | £40,372 | £32,116 |
| 1996-06 | £45,493 | £84,529 | £52,580 | £40,478 | £32,354 |
| 1996-07 | £45,991 | £85,704 | £53,186 | £40,887 | £32,567 |
| 1996-08 | £46,669 | £87,551 | £53,984 | £41,424 | £32,874 |
| 1996-09 | £47,310 | £89,121 | £54,675 | £42,007 | £33,022 |
| 1996-10 | £47,637 | £89,970 | £55,112 | £42,243 | £33,171 |
| 1996-11 | £47,521 | £89,558 | £55,009 | £42,138 | £33,194 |
| 1996-12 | £47,747 | £89,709 | £55,380 | £42,326 | £33,283 |
| 1997-01 | £47,588 | £89,339 | £55,121 | £42,249 | £33,076 |
| 1997-02 | £48,458 | £91,280 | £56,171 | £42,952 | £33,643 |
| 1997-03 | £48,560 | £91,606 | £56,175 | £43,060 | £33,810 |
| 1997-04 | £49,438 | £92,970 | £57,249 | £43,833 | £34,488 |
| 1997-05 | £49,395 | £92,513 | £57,235 | £43,867 | £34,212 |
| 1997-06 | £50,137 | £94,109 | £58,160 | £44,524 | £34,408 |
| 1997-07 | £50,395 | £94,846 | £58,398 | £44,815 | £34,253 |
| 1997-08 | £51,396 | £97,211 | £59,538 | £45,676 | £34,815 |
| 1997-09 | £52,471 | £99,255 | £60,781 | £46,644 | £35,474 |
| 1997-10 | £53,223 | £100,869 | £61,776 | £47,218 | £36,014 |
| 1997-11 | £53,266 | £101,003 | £61,876 | £47,227 | £36,021 |
| 1997-12 | £53,158 | £100,859 | £61,875 | £47,053 | £35,967 |
| 1998-01 | £52,849 | £100,517 | £61,391 | £46,810 | £35,780 |
| 1998-02 | £53,227 | £101,097 | £61,829 | £47,139 | £36,247 |
| 1998-03 | £53,629 | £101,852 | £62,277 | £47,519 | £36,509 |
| 1998-04 | £54,574 | £103,371 | £63,510 | £48,339 | £37,106 |
| 1998-05 | £55,166 | £104,190 | £64,112 | £48,966 | £37,311 |
| 1998-06 | £55,540 | £104,948 | £64,467 | £49,307 | £37,673 |
| 1998-07 | £55,922 | £105,904 | £64,823 | £49,662 | £37,900 |
| 1998-08 | £56,429 | £107,554 | £65,377 | £50,056 | £38,194 |
| 1998-09 | £56,619 | £108,125 | £65,591 | £50,225 | £38,197 |
| 1998-10 | £57,201 | £109,287 | £66,297 | £50,705 | £38,694 |
| 1998-11 | £57,234 | £109,624 | £66,540 | £50,593 | £38,876 |
| 1998-12 | £57,706 | £110,454 | £67,200 | £50,941 | £39,389 |
| 1999-01 | £57,831 | £110,817 | £67,436 | £50,996 | £39,500 |
| 1999-02 | £57,220 | £109,389 | £66,706 | £50,488 | £39,093 |
| 1999-03 | £57,809 | £110,596 | £67,391 | £50,984 | £39,546 |
| 1999-04 | £58,382 | £111,085 | £67,937 | £51,612 | £39,899 |
| 1999-05 | £59,769 | £113,411 | £69,479 | £52,916 | £40,772 |
| 1999-06 | £59,653 | £113,092 | £69,226 | £52,900 | £40,544 |
| 1999-07 | £59,829 | £113,966 | £69,348 | £53,053 | £40,531 |
| 1999-08 | £60,390 | £115,307 | £69,833 | £53,604 | £40,796 |
| 1999-09 | £62,202 | £119,242 | £71,815 | £55,197 | £42,032 |
| 1999-10 | £63,791 | £122,569 | £73,847 | £56,442 | £43,386 |
| 1999-11 | £65,134 | £125,068 | £75,482 | £57,572 | £44,483 |
| 1999-12 | £65,405 | £125,048 | £75,837 | £57,810 | £44,890 |
| 2000-01 | £65,561 | £125,660 | £76,057 | £57,938 | £44,810 |
| 2000-02 | £65,433 | £125,734 | £75,895 | £57,771 | £44,735 |
| 2000-03 | £66,342 | £127,830 | £77,114 | £58,506 | £45,128 |
| 2000-04 | £67,998 | £130,277 | £78,866 | £60,031 | £46,509 |
| 2000-05 | £70,484 | £134,815 | £81,853 | £62,208 | £48,230 |
| 2000-06 | £72,713 | £138,894 | £84,475 | £64,132 | £49,939 |
| 2000-07 | £74,063 | £142,619 | £86,295 | £65,187 | £50,620 |
| 2000-08 | £74,872 | £145,027 | £87,442 | £65,698 | £51,329 |
| 2000-09 | £75,735 | £147,915 | £88,420 | £66,333 | £51,941 |
| 2000-10 | £75,888 | £148,242 | £88,815 | £66,335 | £52,250 |
| 2000-11 | £76,161 | £149,106 | £89,113 | £66,514 | £52,559 |
| 2000-12 | £75,682 | £147,714 | £88,683 | £65,989 | £52,625 |
| 2001-01 | £77,044 | £150,180 | £89,967 | £67,258 | £53,727 |
| 2001-02 | £77,704 | £150,826 | £90,628 | £67,945 | £54,156 |
| 2001-03 | £79,106 | £153,440 | £92,279 | £69,254 | £54,849 |
| 2001-04 | £79,328 | £153,762 | £92,424 | £69,502 | £54,982 |
| 2001-05 | £80,656 | £155,948 | £93,968 | £70,699 | £55,922 |
| 2001-06 | £81,797 | £157,648 | £95,108 | £71,733 | £57,038 |
| 2001-07 | £83,151 | £160,459 | £96,803 | £72,870 | £57,943 |
| 2001-08 | £84,367 | £163,543 | £98,058 | £73,900 | £58,875 |
| 2001-09 | £85,767 | £167,241 | £99,507 | £75,101 | £59,824 |
| 2001-10 | £87,159 | £169,748 | £101,164 | £76,251 | £61,101 |
| 2001-11 | £88,050 | £171,343 | £102,458 | £76,903 | £61,947 |
| 2001-12 | £88,775 | £171,976 | £103,567 | £77,391 | £63,006 |
| 2002-01 | £90,218 | £175,006 | £105,277 | £78,571 | £64,229 |
| 2002-02 | £91,825 | £177,898 | £106,892 | £80,045 | £65,520 |
| 2002-03 | £92,732 | £179,341 | £107,970 | £80,920 | £65,900 |
| 2002-04 | £93,671 | £180,174 | £108,885 | £81,811 | £66,916 |
| 2002-05 | £95,781 | £183,354 | £111,547 | £83,639 | £68,545 |
| 2002-06 | £98,580 | £188,463 | £114,448 | £86,169 | £70,797 |
| 2002-07 | £101,069 | £193,546 | £117,307 | £88,401 | £72,257 |
| 2002-08 | £103,600 | £198,713 | £120,153 | £90,622 | £74,040 |
| 2002-09 | £106,513 | £204,877 | £123,942 | £93,046 | £75,822 |
| 2002-10 | £109,734 | £210,920 | £128,065 | £95,707 | £78,291 |
| 2002-11 | £111,321 | £214,120 | £129,923 | £97,037 | £79,584 |
| 2002-12 | £113,653 | £217,466 | £132,723 | £99,032 | £81,762 |
| 2003-01 | £114,731 | £219,047 | £133,596 | £100,116 | £82,675 |
| 2003-02 | £116,462 | £221,081 | £135,760 | £101,671 | £84,042 |
| 2003-03 | £116,897 | £221,864 | £136,020 | £102,185 | £84,151 |
| 2003-04 | £119,589 | £225,997 | £139,512 | £104,491 | £86,176 |
| 2003-05 | £121,358 | £229,233 | £141,681 | £106,068 | £87,206 |
| 2003-06 | £123,073 | £231,580 | £143,739 | £107,538 | £88,859 |
| 2003-07 | £123,833 | £232,375 | £144,552 | £108,341 | £89,188 |
| 2003-08 | £124,756 | £233,328 | £145,404 | £109,288 | £89,903 |
| 2003-09 | £126,446 | £236,342 | £147,394 | £110,930 | £90,460 |
| 2003-10 | £127,855 | £238,380 | £148,877 | £112,262 | £91,535 |
| 2003-11 | £129,497 | £240,913 | £150,840 | £113,749 | £92,665 |
| 2003-12 | £130,387 | £240,160 | £151,577 | £114,766 | £93,770 |
| 2004-01 | £131,721 | £242,207 | £152,916 | £116,034 | £94,810 |
| 2004-02 | £132,860 | £242,955 | £153,846 | £117,239 | £95,869 |
| 2004-03 | £133,625 | £244,280 | £154,444 | £118,045 | £96,281 |
| 2004-04 | £134,290 | £242,339 | £154,981 | £119,070 | £96,648 |
| 2004-05 | £135,819 | £242,255 | £156,272 | £120,863 | £97,842 |
| 2004-06 | £138,462 | £244,874 | £159,189 | £123,388 | £100,019 |
| 2004-07 | £140,842 | £248,584 | £161,928 | £125,621 | £101,549 |
| 2004-08 | £144,578 | £255,419 | £166,295 | £128,950 | £104,089 |
| 2004-09 | £146,750 | £259,841 | £168,703 | £130,968 | £105,312 |
| 2004-10 | £147,575 | £261,181 | £169,323 | £131,655 | £106,485 |
| 2004-11 | £146,401 | £258,690 | £167,690 | £130,639 | £106,013 |
| 2004-12 | £144,834 | £254,362 | £165,505 | £129,412 | £105,319 |
| 2005-01 | £144,883 | £254,346 | £165,171 | £129,578 | £105,467 |
| 2005-02 | £144,805 | £253,734 | £165,176 | £129,509 | £105,432 |
| 2005-03 | £145,927 | £255,733 | £166,683 | £130,474 | £106,062 |
| 2005-04 | £146,233 | £254,436 | £167,176 | £130,905 | £106,177 |
| 2005-05 | £146,609 | £254,885 | £167,290 | £131,400 | £106,391 |
| 2005-06 | £145,896 | £251,995 | £165,989 | £131,128 | £105,808 |
| 2005-07 | £146,710 | £253,811 | £166,918 | £131,936 | £106,040 |
| 2005-08 | £146,487 | £253,451 | £166,451 | £131,914 | £105,579 |
| 2005-09 | £147,263 | £255,668 | £167,265 | £132,610 | £105,962 |
| 2005-10 | £146,417 | £253,833 | £165,803 | £131,928 | £105,799 |
| 2005-11 | £146,963 | £253,897 | £166,363 | £132,482 | £106,330 |
| 2005-12 | £147,991 | £254,270 | £167,123 | £133,523 | £107,617 |
| 2006-01 | £147,912 | £254,039 | £166,892 | £133,654 | £107,144 |
| 2006-02 | £148,318 | £253,910 | £167,079 | £134,144 | £107,688 |
| 2006-03 | £147,931 | £254,022 | £166,935 | £133,784 | £106,880 |
| 2006-04 | £148,793 | £254,376 | £167,946 | £134,646 | £107,541 |
| 2006-05 | £149,846 | £256,144 | £169,286 | £135,579 | £108,170 |
| 2006-06 | £151,561 | £257,737 | £171,086 | £137,308 | £109,451 |
| 2006-07 | £153,148 | £260,493 | £172,662 | £138,938 | £110,248 |
| 2006-08 | £154,602 | £263,278 | £174,107 | £140,491 | £110,685 |
| 2006-09 | £155,869 | £266,745 | £175,635 | £141,592 | £111,194 |
| 2006-10 | £156,742 | £268,507 | £176,574 | £142,278 | £112,137 |
| 2006-11 | £157,094 | £268,918 | £177,090 | £142,573 | £112,367 |
| 2006-12 | £158,067 | £268,928 | £177,849 | £143,654 | £113,418 |
| 2007-01 | £159,149 | £270,607 | £179,086 | £144,703 | £114,009 |
| 2007-02 | £159,622 | £271,069 | £179,540 | £145,049 | £114,912 |
| 2007-03 | £159,316 | £270,847 | £179,223 | £144,863 | £114,248 |
| 2007-04 | £159,744 | £270,540 | £179,474 | £145,467 | £114,512 |
| 2007-05 | £161,734 | £272,662 | £181,386 | £147,548 | £115,913 |
| 2007-06 | £164,245 | £276,546 | £183,944 | £149,893 | £118,034 |
| 2007-07 | £165,238 | £278,897 | £185,010 | £150,808 | £118,518 |
| 2007-08 | £167,078 | £283,391 | £187,068 | £152,596 | £118,906 |
| 2007-09 | £167,419 | £284,855 | £187,486 | £152,826 | £119,050 |
| 2007-10 | £168,541 | £287,269 | £188,568 | £153,755 | £120,267 |
| 2007-11 | £169,491 | £289,294 | £189,763 | £154,357 | £121,566 |
| 2007-12 | £169,743 | £289,665 | £189,993 | £154,529 | £122,066 |
| 2008-01 | £168,217 | £287,396 | £188,302 | £153,101 | £120,962 |
| 2008-02 | £166,369 | £284,587 | £186,226 | £151,420 | £119,491 |
| 2008-03 | £166,085 | £284,915 | £186,368 | £151,207 | £118,338 |
| 2008-04 | £166,298 | £285,627 | £186,673 | £151,567 | £117,887 |
| 2008-05 | £166,380 | £285,140 | £186,957 | £151,760 | £117,618 |
| 2008-06 | £164,123 | £280,489 | £184,275 | £149,815 | £116,128 |
| 2008-07 | £162,552 | £277,442 | £182,908 | £148,250 | £115,018 |
| 2008-08 | £156,613 | £267,640 | £175,981 | £142,854 | £110,934 |
| 2008-09 | £154,500 | £266,235 | £173,468 | £140,715 | £109,473 |
| 2008-10 | £149,449 | £258,363 | £167,695 | £135,933 | £106,219 |
| 2008-11 | £147,004 | £254,384 | £165,181 | £133,564 | £104,526 |
| 2008-12 | £142,646 | £245,555 | £160,297 | £129,740 | £101,451 |
| 2009-01 | £140,511 | £242,694 | £157,787 | £127,700 | £100,064 |
| 2009-02 | £139,388 | £241,315 | £156,601 | £126,518 | £99,378 |
| 2009-03 | £135,629 | £235,428 | £152,435 | £122,886 | £97,067 |
| 2009-04 | £133,342 | £230,177 | £150,135 | £120,921 | £95,165 |
| 2009-05 | £132,011 | £227,289 | £148,740 | £119,882 | £93,747 |
| 2009-06 | £135,029 | £232,308 | £152,372 | £122,798 | £94,998 |
| 2009-07 | £137,294 | £236,632 | £154,975 | £125,038 | £95,746 |
| 2009-08 | £139,647 | £241,019 | £157,585 | £127,379 | £96,697 |
| 2009-09 | £139,915 | £241,792 | £157,940 | £127,672 | £96,508 |
| 2009-10 | £143,395 | £247,977 | £162,142 | £130,746 | £98,675 |
| 2009-11 | £146,082 | £253,094 | £165,078 | £133,326 | £100,101 |
| 2009-12 | £148,769 | £256,387 | £168,210 | £136,002 | £101,674 |
| 2010-01 | £148,121 | £256,239 | £167,505 | £135,616 | £100,153 |
| 2010-02 | £148,504 | £257,229 | £168,448 | £135,789 | £100,069 |
| 2010-03 | £150,322 | £262,460 | £170,631 | £137,108 | £101,373 |
| 2010-04 | £151,895 | £264,564 | £172,551 | £138,405 | £103,033 |
| 2010-05 | £152,263 | £265,295 | £172,936 | £138,714 | £103,377 |
| 2010-06 | £150,359 | £261,234 | £170,820 | £137,238 | £101,543 |
| 2010-07 | £150,912 | £263,338 | £171,457 | £137,782 | £101,146 |
| 2010-08 | £150,343 | £263,178 | £171,110 | £137,183 | £100,085 |
| 2010-09 | £153,444 | £270,121 | £174,677 | £139,835 | £101,841 |
| 2010-10 | £151,744 | £267,236 | £172,809 | £138,137 | £101,042 |
| 2010-11 | £151,629 | £267,701 | £172,626 | £137,869 | £101,231 |
| 2010-12 | £148,249 | £261,541 | £168,984 | £134,668 | £99,179 |
| 2011-01 | £149,096 | £263,757 | £169,864 | £135,311 | £99,916 |
| 2011-02 | £147,998 | £262,036 | £168,341 | £134,322 | £99,450 |
| 2011-03 | £147,683 | £263,057 | £167,842 | £133,864 | £99,193 |
| 2011-04 | £146,620 | £260,899 | £166,488 | £132,979 | £98,565 |
| 2011-05 | £147,799 | £262,157 | £167,881 | £133,983 | £99,847 |
| 2011-06 | £148,695 | £261,999 | £169,083 | £134,902 | £100,662 |
| 2011-07 | £149,767 | £263,341 | £170,319 | £135,877 | £101,601 |
| 2011-08 | £148,844 | £262,409 | £169,587 | £135,151 | £99,912 |
| 2011-09 | £149,222 | £264,119 | £169,947 | £135,582 | £99,549 |
| 2011-10 | £148,157 | £263,341 | £169,197 | £134,452 | £98,198 |
| 2011-11 | £147,634 | £262,506 | £168,654 | £133,739 | £98,429 |
| 2011-12 | £147,144 | £261,235 | £168,391 | £133,096 | £98,453 |
| 2012-01 | £147,592 | £261,706 | £169,077 | £133,538 | £98,553 |
| 2012-02 | £146,563 | £259,515 | £167,787 | £132,885 | £97,448 |
| 2012-03 | £146,315 | £258,037 | £167,425 | £132,926 | £97,268 |
| 2012-04 | £146,099 | £257,351 | £166,944 | £132,788 | £97,479 |
| 2012-05 | £148,509 | £261,325 | £169,664 | £135,021 | £99,161 |
| 2012-06 | £148,562 | £261,343 | £169,432 | £135,339 | £98,807 |
| 2012-07 | £150,204 | £263,930 | £171,152 | £137,060 | £99,559 |
| 2012-08 | £149,318 | £262,119 | £170,105 | £136,474 | £98,435 |
| 2012-09 | £150,313 | £264,951 | £171,218 | £137,231 | £98,994 |
| 2012-10 | £148,218 | £261,238 | £169,035 | £135,200 | £97,698 |
| 2012-11 | £149,516 | £263,865 | £170,557 | £136,282 | £98,624 |
| 2012-12 | £149,740 | £264,406 | £171,091 | £136,336 | £98,743 |
| 2013-01 | £152,324 | £269,321 | £174,448 | £138,573 | £99,983 |
| 2013-02 | £151,808 | £268,418 | £173,843 | £138,031 | £99,755 |
| 2013-03 | £151,459 | £268,084 | £173,373 | £137,548 | £99,820 |
| 2013-04 | £150,680 | £266,605 | £172,147 | £136,908 | £99,573 |
| 2013-05 | £151,805 | £268,196 | £173,558 | £137,880 | £100,494 |
| 2013-06 | £154,447 | £271,876 | £176,622 | £140,598 | £101,775 |
| 2013-07 | £155,314 | £272,880 | £177,394 | £141,619 | £102,217 |
| 2013-08 | £156,725 | £275,615 | £178,986 | £143,006 | £102,770 |
| 2013-09 | £157,939 | £278,819 | £180,367 | £143,911 | £103,624 |
| 2013-10 | £159,320 | £282,562 | £182,272 | £144,774 | £104,610 |
| 2013-11 | £159,834 | £283,778 | £183,064 | £145,069 | £105,033 |
| 2013-12 | £159,656 | £282,438 | £183,140 | £144,877 | £105,151 |
| 2014-01 | £161,169 | £284,798 | £184,657 | £146,377 | £106,212 |
| 2014-02 | £162,972 | £288,463 | £186,616 | £147,966 | £107,453 |
| 2014-03 | £164,798 | £292,238 | £188,885 | £149,541 | £108,387 |
| 2014-04 | £166,526 | £294,745 | £190,888 | £151,176 | £109,509 |
| 2014-05 | £169,124 | £298,345 | £193,930 | £153,725 | £110,984 |
| 2014-06 | £170,690 | £300,799 | £195,568 | £155,365 | £111,698 |
| 2014-07 | £175,003 | £308,480 | £200,529 | £159,502 | £113,929 |
| 2014-08 | £178,431 | £315,123 | £204,402 | £162,728 | £115,752 |
| 2014-09 | £181,253 | £320,429 | £207,451 | £165,330 | £117,582 |
| 2014-10 | £181,740 | £321,818 | £208,294 | £165,559 | £118,013 |
| 2014-11 | £181,822 | £322,370 | £208,563 | £165,376 | £118,435 |
| 2014-12 | £183,526 | £326,048 | £210,693 | £166,593 | £120,031 |
| 2015-01 | £183,731 | £326,535 | £210,934 | £166,569 | £120,672 |
| 2015-02 | £182,681 | £324,836 | £209,601 | £165,463 | £120,442 |
| 2015-03 | £181,442 | £323,494 | £208,504 | £164,112 | £119,612 |
| 2015-04 | £180,681 | £322,509 | £207,599 | £163,514 | £118,800 |
| 2015-05 | £184,040 | £328,372 | £211,786 | £166,602 | £120,632 |
| 2015-06 | £186,543 | £331,813 | £214,573 | £169,336 | £121,565 |
| 2015-07 | £190,660 | £338,635 | £219,560 | £173,119 | £124,072 |
| 2015-08 | £192,595 | £342,358 | £221,654 | £175,058 | £124,923 |
| 2015-09 | £195,825 | £349,501 | £225,178 | £177,768 | £127,282 |
| 2015-10 | £197,269 | £352,964 | £226,891 | £179,121 | £127,789 |
| 2015-11 | £200,416 | £358,997 | £230,781 | £181,802 | £129,875 |
| 2015-12 | £202,507 | £362,951 | £233,567 | £183,609 | £131,032 |
| 2016-01 | £203,289 | £364,087 | £234,770 | £184,150 | £131,751 |
| 2016-02 | £206,085 | £369,319 | £238,074 | £186,656 | £133,488 |
| 2016-03 | £208,620 | £373,761 | £240,855 | £188,979 | £135,232 |
| 2016-04 | £214,814 | £384,779 | £247,915 | £194,629 | £139,260 |
| 2016-05 | £216,535 | £386,262 | £249,434 | £196,287 | £141,089 |
| 2016-06 | £221,416 | £394,795 | £255,025 | £200,644 | £144,512 |
| 2016-07 | £224,058 | £399,087 | £257,596 | £203,156 | £146,516 |
| 2016-08 | £227,000 | £405,372 | £261,211 | £205,755 | £148,051 |
| 2016-09 | £227,160 | £405,753 | £261,600 | £205,858 | £148,038 |
| 2016-10 | £226,787 | £406,680 | £261,612 | £204,937 | £148,283 |
| 2016-11 | £227,496 | £409,979 | £262,718 | £205,030 | £149,161 |
| 2016-12 | £228,244 | £412,104 | £263,473 | £205,414 | £150,201 |
| 2017-01 | £229,550 | £414,861 | £264,895 | £206,608 | £150,964 |
| 2017-02 | £230,517 | £415,381 | £265,354 | £207,504 | £152,663 |
| 2017-03 | £231,737 | £417,907 | £266,989 | £208,312 | £153,947 |
| 2017-04 | £234,282 | £421,796 | £269,716 | £210,500 | £156,356 |
| 2017-05 | £235,051 | £422,205 | £271,159 | £211,034 | £157,030 |
| 2017-06 | £237,596 | £424,787 | £273,918 | £213,544 | £158,948 |
| 2017-07 | £239,543 | £427,042 | £276,057 | £215,413 | £160,441 |
| 2017-08 | £242,861 | £432,846 | £279,556 | £218,779 | £161,980 |
| 2017-09 | £242,228 | £432,811 | £278,776 | £218,224 | £161,206 |
| 2017-10 | £242,316 | £434,648 | £279,558 | £218,084 | £160,595 |
| 2017-11 | £242,223 | £435,600 | £280,002 | £217,748 | £160,279 |
| 2017-12 | £242,114 | £434,941 | £280,252 | £217,678 | £159,880 |
| 2018-01 | £242,084 | £434,823 | £280,392 | £217,627 | £159,761 |
| 2018-02 | £241,719 | £434,754 | £279,917 | £217,267 | £159,453 |
| 2018-03 | £241,472 | £434,228 | £279,690 | £217,236 | £158,902 |
| 2018-04 | £243,257 | £436,699 | £281,724 | £219,317 | £159,313 |
| 2018-05 | £242,773 | £435,302 | £281,617 | £219,329 | £157,802 |
| 2018-06 | £246,301 | £441,835 | £286,191 | £222,458 | £159,735 |
| 2018-07 | £245,646 | £441,782 | £285,471 | £221,823 | £159,065 |
| 2018-08 | £249,022 | £447,956 | £289,263 | £224,901 | £161,276 |
| 2018-09 | £248,219 | £447,279 | £288,224 | £224,304 | £160,384 |
| 2018-10 | £247,324 | £445,242 | £287,281 | £223,366 | £160,097 |
| 2018-11 | £246,023 | £444,310 | £286,182 | £222,110 | £158,693 |
| 2018-12 | £245,439 | £443,005 | £285,625 | £221,351 | £158,751 |
| 2019-01 | £244,395 | £442,906 | £284,876 | £220,177 | £157,675 |
| 2019-02 | £243,712 | £441,857 | £284,046 | £219,227 | £157,958 |
| 2019-03 | £243,133 | £441,814 | £283,893 | £218,629 | £156,973 |
| 2019-04 | £243,338 | £440,651 | £284,019 | £219,152 | £156,855 |
| 2019-05 | £241,599 | £436,178 | £282,092 | £218,007 | £154,993 |
| 2019-06 | £241,678 | £435,635 | £282,004 | £218,240 | £155,054 |
| 2019-07 | £241,880 | £435,562 | £281,854 | £218,580 | £155,360 |
| 2019-08 | £241,704 | £435,811 | £281,470 | £218,531 | £155,021 |
| 2019-09 | £241,408 | £434,982 | £280,533 | £218,584 | £154,807 |
| 2019-10 | £241,841 | £435,998 | £281,859 | £218,734 | £154,687 |
| 2019-11 | £241,656 | £436,131 | £282,380 | £218,295 | £154,275 |
| 2019-12 | £238,465 | £430,674 | £279,124 | £215,301 | £151,896 |
| 2020-01 | £236,334 | £427,378 | £276,666 | £213,487 | £150,085 |
| 2020-02 | £235,914 | £426,565 | £275,991 | £213,391 | £149,346 |
| 2020-03 | £238,838 | £432,167 | £279,671 | £216,035 | £150,825 |
| 2020-04 | £238,531 | £432,095 | £279,165 | £216,022 | £150,003 |
| 2020-05 | £240,974 | £436,267 | £282,325 | £217,912 | £152,075 |
| 2020-06 | £241,360 | £436,361 | £282,958 | £218,553 | £151,604 |
| 2020-07 | £242,566 | £437,750 | £284,380 | £219,651 | £152,588 |
| 2020-08 | £243,393 | £440,470 | £285,542 | £220,754 | £151,670 |
| 2020-09 | £246,102 | £446,968 | £288,674 | £223,224 | £152,882 |
| 2020-10 | £248,712 | £453,235 | £291,782 | £225,794 | £153,505 |
| 2020-11 | £249,043 | £453,715 | £291,534 | £226,457 | £153,567 |
| 2020-12 | £250,994 | £457,066 | £293,354 | £228,613 | £154,434 |
| 2021-01 | £254,647 | £460,294 | £297,239 | £232,188 | £157,564 |
| 2021-02 | £256,578 | £459,741 | £298,820 | £234,305 | £160,083 |
| 2021-03 | £257,026 | £456,525 | £298,638 | £235,003 | £161,987 |
| 2021-04 | £256,234 | £454,964 | £297,102 | £234,524 | £161,741 |
| 2021-05 | £256,906 | £457,035 | £297,933 | £235,125 | £161,739 |
| 2021-06 | £260,992 | £462,665 | £301,930 | £239,714 | £163,829 |
| 2021-07 | £260,995 | £462,964 | £302,643 | £239,328 | £163,773 |
| 2021-08 | £264,375 | £470,238 | £307,301 | £242,265 | £164,770 |
| 2021-09 | £266,788 | £475,974 | £311,006 | £244,050 | £165,508 |
| 2021-10 | £269,753 | £485,171 | £314,720 | £246,535 | £165,897 |
| 2021-11 | £272,582 | £491,499 | £318,201 | £248,914 | £167,398 |
| 2021-12 | £273,357 | £495,946 | £319,584 | £249,222 | £166,934 |
| 2022-01 | £278,749 | £503,458 | £326,065 | £254,618 | £169,729 |
| 2022-02 | £280,989 | £506,533 | £328,525 | £256,814 | £171,479 |
| 2022-03 | £281,844 | £508,621 | £330,235 | £257,250 | £171,738 |
| 2022-04 | £283,861 | £511,821 | £332,249 | £259,390 | £172,828 |
| 2022-05 | £283,670 | £510,941 | £332,274 | £259,481 | £171,761 |
| 2022-06 | £288,493 | £517,491 | £337,334 | £264,547 | £174,711 |
| 2022-07 | £291,612 | £521,759 | £341,247 | £267,717 | £175,917 |
| 2022-08 | £297,602 | £531,876 | £347,952 | £273,725 | £178,762 |
| 2022-09 | £298,823 | £534,636 | £349,687 | £274,904 | £178,532 |
| 2022-10 | £302,040 | £541,645 | £353,262 | £277,757 | £180,428 |
| 2022-11 | £301,773 | £542,291 | £353,163 | £277,203 | £180,290 |
| 2022-12 | £301,693 | £541,783 | £353,018 | £277,075 | £180,684 |
| 2023-01 | £302,237 | £544,045 | £354,384 | £277,065 | £180,764 |
| 2023-02 | £301,130 | £544,225 | £353,263 | £275,566 | £180,146 |
| 2023-03 | £297,382 | £541,259 | £349,927 | £271,059 | £177,603 |
| 2023-04 | £288,034 | £525,698 | £339,238 | £262,127 | £172,187 |
| 2023-05 | £286,816 | £521,707 | £337,932 | £261,073 | £171,708 |
| 2023-06 | £288,290 | £522,397 | £338,996 | £263,146 | £172,252 |
| 2023-07 | £291,833 | £527,291 | £343,214 | £266,808 | £173,837 |
| 2023-08 | £293,088 | £529,670 | £344,645 | £268,415 | £173,635 |
| 2023-09 | £292,804 | £528,933 | £344,264 | £268,378 | £173,108 |
| 2023-10 | £293,186 | £528,410 | £344,205 | £268,855 | £173,893 |
| 2023-11 | £292,210 | £528,162 | £343,571 | £267,260 | £173,872 |
| 2023-12 | £289,309 | £522,897 | £340,383 | £264,225 | £172,733 |
| 2024-01 | £283,858 | £513,682 | £334,019 | £259,347 | £169,047 |
| 2024-02 | £280,717 | £505,640 | £330,013 | £256,969 | £167,092 |
| 2024-03 | £277,584 | £499,406 | £326,338 | £253,994 | £165,646 |
| 2024-04 | £277,367 | £497,223 | £325,896 | £253,859 | £166,092 |
| 2024-05 | £277,224 | £495,747 | £325,615 | £253,780 | £166,360 |
| 2024-06 | £279,806 | £498,647 | £328,208 | £256,839 | £167,380 |
| 2024-07 | £283,970 | £505,857 | £333,026 | £261,145 | £168,965 |
| 2024-08 | £286,305 | £510,170 | £335,532 | £263,846 | £169,386 |
| 2024-09 | £287,112 | £513,859 | £337,027 | £264,433 | £168,960 |
| 2024-10 | £287,221 | £515,277 | £336,865 | £264,310 | £169,484 |
| 2024-11 | £287,379 | £516,648 | £337,704 | £264,127 | £169,254 |
| 2024-12 | £287,949 | £518,710 | £338,407 | £264,612 | £169,354 |
| 2025-01 | £290,872 | £525,005 | £342,474 | £267,338 | £170,010 |
| 2025-02 | £292,516 | £528,138 | £343,825 | £269,102 | £171,139 |
| 2025-03 | £296,497 | £530,262 | £347,453 | £273,420 | £175,305 |
| 2025-04 | £294,114 | £529,203 | £345,346 | £270,521 | £173,413 |
| 2025-05 | £294,079 | £530,425 | £345,662 | £270,466 | £172,489 |
| 2025-06 | £293,244 | £532,841 | £346,025 | £269,224 | £169,814 |
| 2025-07 | £295,726 | £533,138 | £348,529 | £272,526 | £171,095 |
| 2025-08 | £297,107 | £534,891 | £350,736 | £273,816 | £171,479 |
| 2025-09 | £296,074 | £533,523 | £349,702 | £273,070 | £169,983 |
| 2025-10 | £296,306 | £534,896 | £350,285 | £273,051 | £169,901 |
| 2025-11 | £295,815 | £534,107 | £349,374 | £272,760 | £169,594 |
| 2025-12 | £297,524 | £535,607 | £351,268 | £274,634 | £170,687 |
| 2026-01 | £297,781 | £534,299 | £351,843 | £275,304 | £170,258 |
| 2026-02 | £298,183 | £535,279 | £353,024 | £275,505 | £169,906 |
| 2026-03 | £297,435 | £534,634 | £352,779 | £274,861 | £168,288 |
- All property types
- Detached
- Semi-detached
- Terraced
- Flats
Source: HM Land Registry House Price Index
| Year | All property types | Detached | Semi-detached | Terraced | Flats |
|---|---|---|---|---|---|
| 1996-01 | -2.5% | -2.3% | -1.7% | -3.0% | -3.1% |
| 1996-02 | +1.4% | +2.2% | +2.0% | +0.9% | +0.4% |
| 1996-03 | +0.8% | +2.3% | +1.7% | 0.0% | -0.5% |
| 1996-04 | +1.3% | +3.0% | +2.1% | +0.7% | +0.2% |
| 1996-05 | -0.8% | +0.7% | -0.2% | -1.2% | -2.0% |
| 1996-06 | -0.6% | +0.5% | -0.5% | -0.7% | -1.6% |
| 1996-07 | -0.3% | +0.6% | -0.2% | -0.5% | -1.2% |
| 1996-08 | +0.6% | +1.6% | +0.8% | +0.3% | -0.1% |
| 1996-09 | +2.3% | +3.5% | +2.5% | +1.9% | +1.4% |
| 1996-10 | +5.2% | +6.6% | +5.2% | +5.1% | +3.6% |
| 1996-11 | +6.4% | +7.5% | +6.3% | +6.4% | +4.4% |
| 1996-12 | +6.9% | +7.7% | +6.9% | +7.1% | +4.3% |
| 1997-01 | +3.6% | +4.1% | +3.5% | +3.9% | +1.4% |
| 1997-02 | +4.2% | +5.2% | +4.0% | +4.2% | +2.0% |
| 1997-03 | +4.7% | +5.6% | +4.1% | +5.0% | +3.3% |
| 1997-04 | +7.7% | +8.6% | +7.3% | +7.8% | +6.3% |
| 1997-05 | +8.7% | +9.3% | +8.6% | +8.7% | +6.5% |
| 1997-06 | +10.2% | +11.3% | +10.6% | +10.0% | +6.3% |
| 1997-07 | +9.6% | +10.7% | +9.8% | +9.6% | +5.2% |
| 1997-08 | +10.1% | +11.0% | +10.3% | +10.3% | +5.9% |
| 1997-09 | +10.9% | +11.4% | +11.2% | +11.0% | +7.4% |
| 1997-10 | +11.7% | +12.1% | +12.1% | +11.8% | +8.6% |
| 1997-11 | +12.1% | +12.8% | +12.5% | +12.1% | +8.5% |
| 1997-12 | +11.3% | +12.4% | +11.7% | +11.2% | +8.1% |
| 1998-01 | +11.1% | +12.5% | +11.4% | +10.8% | +8.2% |
| 1998-02 | +9.8% | +10.8% | +10.1% | +9.7% | +7.7% |
| 1998-03 | +10.4% | +11.2% | +10.9% | +10.4% | +8.0% |
| 1998-04 | +10.4% | +11.2% | +10.9% | +10.3% | +7.6% |
| 1998-05 | +11.7% | +12.6% | +12.0% | +11.6% | +9.1% |
| 1998-06 | +10.8% | +11.5% | +10.8% | +10.7% | +9.5% |
| 1998-07 | +11.0% | +11.7% | +11.0% | +10.8% | +10.6% |
| 1998-08 | +9.8% | +10.6% | +9.8% | +9.6% | +9.7% |
| 1998-09 | +7.9% | +8.9% | +7.9% | +7.7% | +7.7% |
| 1998-10 | +7.5% | +8.3% | +7.3% | +7.4% | +7.4% |
| 1998-11 | +7.4% | +8.5% | +7.5% | +7.1% | +7.9% |
| 1998-12 | +8.6% | +9.5% | +8.6% | +8.3% | +9.5% |
| 1999-01 | +9.4% | +10.2% | +9.8% | +8.9% | +10.4% |
| 1999-02 | +7.5% | +8.2% | +7.9% | +7.1% | +7.8% |
| 1999-03 | +7.8% | +8.6% | +8.2% | +7.3% | +8.3% |
| 1999-04 | +7.0% | +7.5% | +7.0% | +6.8% | +7.5% |
| 1999-05 | +8.3% | +8.8% | +8.4% | +8.1% | +9.3% |
| 1999-06 | +7.4% | +7.8% | +7.4% | +7.3% | +7.6% |
| 1999-07 | +7.0% | +7.6% | +7.0% | +6.8% | +6.9% |
| 1999-08 | +7.0% | +7.2% | +6.8% | +7.1% | +6.8% |
| 1999-09 | +9.9% | +10.3% | +9.5% | +9.9% | +10.0% |
| 1999-10 | +11.5% | +12.2% | +11.4% | +11.3% | +12.1% |
| 1999-11 | +13.8% | +14.1% | +13.4% | +13.8% | +14.4% |
| 1999-12 | +13.3% | +13.2% | +12.9% | +13.5% | +14.0% |
| 2000-01 | +13.4% | +13.4% | +12.8% | +13.6% | +13.4% |
| 2000-02 | +14.4% | +14.9% | +13.8% | +14.4% | +14.4% |
| 2000-03 | +14.8% | +15.6% | +14.4% | +14.8% | +14.1% |
| 2000-04 | +16.5% | +17.3% | +16.1% | +16.3% | +16.6% |
| 2000-05 | +17.9% | +18.9% | +17.8% | +17.6% | +18.3% |
| 2000-06 | +21.9% | +22.8% | +22.0% | +21.2% | +23.2% |
| 2000-07 | +23.8% | +25.1% | +24.4% | +22.9% | +24.9% |
| 2000-08 | +24.0% | +25.8% | +25.2% | +22.6% | +25.8% |
| 2000-09 | +21.8% | +24.0% | +23.1% | +20.2% | +23.6% |
| 2000-10 | +19.0% | +20.9% | +20.3% | +17.5% | +20.4% |
| 2000-11 | +16.9% | +19.2% | +18.1% | +15.5% | +18.2% |
| 2000-12 | +15.7% | +18.1% | +16.9% | +14.1% | +17.2% |
| 2001-01 | +17.5% | +19.5% | +18.3% | +16.1% | +19.9% |
| 2001-02 | +18.8% | +20.0% | +19.4% | +17.6% | +21.1% |
| 2001-03 | +19.2% | +20.0% | +19.7% | +18.4% | +21.5% |
| 2001-04 | +16.7% | +18.0% | +17.2% | +15.8% | +18.2% |
| 2001-05 | +14.4% | +15.7% | +14.8% | +13.6% | +15.9% |
| 2001-06 | +12.5% | +13.5% | +12.6% | +11.9% | +14.2% |
| 2001-07 | +12.3% | +12.5% | +12.2% | +11.8% | +14.5% |
| 2001-08 | +12.7% | +12.8% | +12.1% | +12.5% | +14.7% |
| 2001-09 | +13.2% | +13.1% | +12.5% | +13.2% | +15.2% |
| 2001-10 | +14.9% | +14.5% | +13.9% | +14.9% | +16.9% |
| 2001-11 | +15.6% | +14.9% | +15.0% | +15.6% | +17.9% |
| 2001-12 | +17.3% | +16.4% | +16.8% | +17.3% | +19.7% |
| 2002-01 | +17.1% | +16.5% | +17.0% | +16.8% | +19.5% |
| 2002-02 | +18.2% | +17.9% | +17.9% | +17.8% | +21.0% |
| 2002-03 | +17.2% | +16.9% | +17.0% | +16.8% | +20.1% |
| 2002-04 | +18.1% | +17.2% | +17.8% | +17.7% | +21.7% |
| 2002-05 | +18.8% | +17.6% | +18.7% | +18.3% | +22.6% |
| 2002-06 | +20.5% | +19.5% | +20.3% | +20.1% | +24.1% |
| 2002-07 | +21.5% | +20.6% | +21.2% | +21.3% | +24.7% |
| 2002-08 | +22.8% | +21.5% | +22.5% | +22.6% | +25.8% |
| 2002-09 | +24.2% | +22.5% | +24.6% | +23.9% | +26.7% |
| 2002-10 | +25.9% | +24.3% | +26.6% | +25.5% | +28.1% |
| 2002-11 | +26.4% | +25.0% | +26.8% | +26.2% | +28.5% |
| 2002-12 | +28.0% | +26.5% | +28.2% | +28.0% | +29.8% |
| 2003-01 | +27.2% | +25.2% | +26.9% | +27.4% | +28.7% |
| 2003-02 | +26.8% | +24.3% | +27.0% | +27.0% | +28.3% |
| 2003-03 | +26.1% | +23.7% | +26.0% | +26.3% | +27.7% |
| 2003-04 | +27.7% | +25.4% | +28.1% | +27.7% | +28.8% |
| 2003-05 | +26.7% | +25.0% | +27.0% | +26.8% | +27.2% |
| 2003-06 | +24.8% | +22.9% | +25.6% | +24.8% | +25.5% |
| 2003-07 | +22.5% | +20.1% | +23.2% | +22.6% | +23.4% |
| 2003-08 | +20.4% | +17.4% | +21.0% | +20.6% | +21.4% |
| 2003-09 | +18.7% | +15.4% | +18.9% | +19.2% | +19.3% |
| 2003-10 | +16.5% | +13.0% | +16.3% | +17.3% | +16.9% |
| 2003-11 | +16.3% | +12.5% | +16.1% | +17.2% | +16.4% |
| 2003-12 | +14.7% | +10.4% | +14.2% | +15.9% | +14.7% |
| 2004-01 | +14.8% | +10.6% | +14.5% | +15.9% | +14.7% |
| 2004-02 | +14.1% | +9.9% | +13.3% | +15.3% | +14.1% |
| 2004-03 | +14.3% | +10.1% | +13.5% | +15.5% | +14.4% |
| 2004-04 | +12.3% | +7.2% | +11.1% | +14.0% | +12.2% |
| 2004-05 | +11.9% | +5.7% | +10.3% | +13.9% | +12.2% |
| 2004-06 | +12.5% | +5.7% | +10.7% | +14.7% | +12.6% |
| 2004-07 | +13.7% | +7.0% | +12.0% | +16.0% | +13.9% |
| 2004-08 | +15.9% | +9.5% | +14.4% | +18.0% | +15.8% |
| 2004-09 | +16.1% | +9.9% | +14.5% | +18.1% | +16.4% |
| 2004-10 | +15.4% | +9.6% | +13.7% | +17.3% | +16.3% |
| 2004-11 | +13.1% | +7.4% | +11.2% | +14.8% | +14.4% |
| 2004-12 | +11.1% | +5.9% | +9.2% | +12.8% | +12.3% |
| 2005-01 | +10.0% | +5.0% | +8.0% | +11.7% | +11.2% |
| 2005-02 | +9.0% | +4.4% | +7.4% | +10.5% | +10.0% |
| 2005-03 | +9.2% | +4.7% | +7.9% | +10.5% | +10.2% |
| 2005-04 | +8.9% | +5.0% | +7.9% | +9.9% | +9.9% |
| 2005-05 | +7.9% | +5.2% | +7.1% | +8.7% | +8.7% |
| 2005-06 | +5.4% | +2.9% | +4.3% | +6.3% | +5.8% |
| 2005-07 | +4.2% | +2.1% | +3.1% | +5.0% | +4.4% |
| 2005-08 | +1.3% | -0.8% | +0.1% | +2.3% | +1.4% |
| 2005-09 | +0.3% | -1.6% | -0.9% | +1.3% | +0.6% |
| 2005-10 | -0.8% | -2.8% | -2.1% | +0.2% | -0.6% |
| 2005-11 | +0.4% | -1.9% | -0.8% | +1.4% | +0.3% |
| 2005-12 | +2.2% | 0.0% | +1.0% | +3.2% | +2.2% |
| 2006-01 | +2.1% | -0.1% | +1.0% | +3.1% | +1.6% |
| 2006-02 | +2.4% | +0.1% | +1.2% | +3.6% | +2.1% |
| 2006-03 | +1.4% | -0.7% | +0.2% | +2.5% | +0.8% |
| 2006-04 | +1.8% | 0.0% | +0.5% | +2.9% | +1.3% |
| 2006-05 | +2.2% | +0.5% | +1.2% | +3.2% | +1.7% |
| 2006-06 | +3.9% | +2.3% | +3.1% | +4.7% | +3.4% |
| 2006-07 | +4.4% | +2.6% | +3.4% | +5.3% | +4.0% |
| 2006-08 | +5.5% | +3.9% | +4.6% | +6.5% | +4.8% |
| 2006-09 | +5.8% | +4.3% | +5.0% | +6.8% | +4.9% |
| 2006-10 | +7.1% | +5.8% | +6.5% | +7.8% | +6.0% |
| 2006-11 | +6.9% | +5.9% | +6.4% | +7.6% | +5.7% |
| 2006-12 | +6.8% | +5.8% | +6.4% | +7.6% | +5.4% |
| 2007-01 | +7.6% | +6.5% | +7.3% | +8.3% | +6.4% |
| 2007-02 | +7.6% | +6.8% | +7.5% | +8.1% | +6.7% |
| 2007-03 | +7.7% | +6.6% | +7.4% | +8.3% | +6.9% |
| 2007-04 | +7.4% | +6.4% | +6.9% | +8.0% | +6.5% |
| 2007-05 | +7.9% | +6.4% | +7.1% | +8.8% | +7.2% |
| 2007-06 | +8.4% | +7.3% | +7.5% | +9.2% | +7.8% |
| 2007-07 | +7.9% | +7.1% | +7.2% | +8.5% | +7.5% |
| 2007-08 | +8.1% | +7.6% | +7.4% | +8.6% | +7.4% |
| 2007-09 | +7.4% | +6.8% | +6.7% | +7.9% | +7.1% |
| 2007-10 | +7.5% | +7.0% | +6.8% | +8.1% | +7.2% |
| 2007-11 | +7.9% | +7.6% | +7.2% | +8.3% | +8.2% |
| 2007-12 | +7.4% | +7.7% | +6.8% | +7.6% | +7.6% |
| 2008-01 | +5.7% | +6.2% | +5.1% | +5.8% | +6.1% |
| 2008-02 | +4.2% | +5.0% | +3.7% | +4.4% | +4.0% |
| 2008-03 | +4.2% | +5.2% | +4.0% | +4.4% | +3.6% |
| 2008-04 | +4.1% | +5.6% | +4.0% | +4.2% | +2.9% |
| 2008-05 | +2.9% | +4.6% | +3.1% | +2.9% | +1.5% |
| 2008-06 | -0.1% | +1.4% | +0.2% | -0.1% | -1.6% |
| 2008-07 | -1.6% | -0.5% | -1.1% | -1.7% | -3.0% |
| 2008-08 | -6.3% | -5.6% | -5.9% | -6.4% | -6.7% |
| 2008-09 | -7.7% | -6.5% | -7.5% | -7.9% | -8.0% |
| 2008-10 | -11.3% | -10.1% | -11.1% | -11.6% | -11.7% |
| 2008-11 | -13.3% | -12.1% | -13.0% | -13.5% | -14.0% |
| 2008-12 | -16.0% | -15.2% | -15.6% | -16.0% | -16.9% |
| 2009-01 | -16.5% | -15.6% | -16.2% | -16.6% | -17.3% |
| 2009-02 | -16.2% | -15.2% | -15.9% | -16.4% | -16.8% |
| 2009-03 | -18.3% | -17.4% | -18.2% | -18.7% | -18.0% |
| 2009-04 | -19.8% | -19.4% | -19.6% | -20.2% | -19.3% |
| 2009-05 | -20.7% | -20.3% | -20.4% | -21.0% | -20.3% |
| 2009-06 | -17.7% | -17.2% | -17.3% | -18.0% | -18.2% |
| 2009-07 | -15.5% | -14.7% | -15.3% | -15.7% | -16.8% |
| 2009-08 | -10.8% | -9.9% | -10.5% | -10.8% | -12.8% |
| 2009-09 | -9.4% | -9.2% | -9.0% | -9.3% | -11.8% |
| 2009-10 | -4.1% | -4.0% | -3.3% | -3.8% | -7.1% |
| 2009-11 | -0.6% | -0.5% | -0.1% | -0.2% | -4.2% |
| 2009-12 | +4.3% | +4.4% | +4.9% | +4.8% | +0.2% |
| 2010-01 | +5.4% | +5.6% | +6.2% | +6.2% | +0.1% |
| 2010-02 | +6.5% | +6.6% | +7.6% | +7.3% | +0.7% |
| 2010-03 | +10.8% | +11.5% | +11.9% | +11.6% | +4.4% |
| 2010-04 | +13.9% | +14.9% | +14.9% | +14.5% | +8.3% |
| 2010-05 | +15.3% | +16.7% | +16.3% | +15.7% | +10.3% |
| 2010-06 | +11.4% | +12.5% | +12.1% | +11.8% | +6.9% |
| 2010-07 | +9.9% | +11.3% | +10.6% | +10.2% | +5.6% |
| 2010-08 | +7.7% | +9.2% | +8.6% | +7.7% | +3.5% |
| 2010-09 | +9.7% | +11.7% | +10.6% | +9.5% | +5.5% |
| 2010-10 | +5.8% | +7.8% | +6.6% | +5.7% | +2.4% |
| 2010-11 | +3.8% | +5.8% | +4.6% | +3.4% | +1.1% |
| 2010-12 | -0.3% | +2.0% | +0.5% | -1.0% | -2.5% |
| 2011-01 | +0.7% | +2.9% | +1.4% | -0.2% | -0.2% |
| 2011-02 | -0.3% | +1.9% | -0.1% | -1.1% | -0.6% |
| 2011-03 | -1.8% | +0.2% | -1.6% | -2.4% | -2.2% |
| 2011-04 | -3.5% | -1.4% | -3.5% | -3.9% | -4.3% |
| 2011-05 | -2.9% | -1.2% | -2.9% | -3.4% | -3.4% |
| 2011-06 | -1.1% | +0.3% | -1.0% | -1.7% | -0.9% |
| 2011-07 | -0.8% | 0.0% | -0.7% | -1.4% | +0.4% |
| 2011-08 | -1.0% | -0.3% | -0.9% | -1.5% | -0.2% |
| 2011-09 | -2.8% | -2.2% | -2.7% | -3.0% | -2.3% |
| 2011-10 | -2.4% | -1.5% | -2.1% | -2.7% | -2.8% |
| 2011-11 | -2.6% | -1.9% | -2.3% | -3.0% | -2.8% |
| 2011-12 | -0.7% | -0.1% | -0.4% | -1.2% | -0.7% |
| 2012-01 | -1.0% | -0.8% | -0.5% | -1.3% | -1.4% |
| 2012-02 | -1.0% | -1.0% | -0.3% | -1.1% | -2.0% |
| 2012-03 | -0.9% | -1.9% | -0.2% | -0.7% | -1.9% |
| 2012-04 | -0.4% | -1.4% | +0.3% | -0.1% | -1.1% |
| 2012-05 | +0.5% | -0.3% | +1.1% | +0.8% | -0.7% |
| 2012-06 | -0.1% | -0.3% | +0.2% | +0.3% | -1.8% |
| 2012-07 | +0.3% | +0.2% | +0.5% | +0.9% | -2.0% |
| 2012-08 | +0.3% | -0.1% | +0.3% | +1.0% | -1.5% |
| 2012-09 | +0.7% | +0.3% | +0.7% | +1.2% | -0.6% |
| 2012-10 | 0.0% | -0.8% | -0.1% | +0.6% | -0.5% |
| 2012-11 | +1.3% | +0.5% | +1.1% | +1.9% | +0.2% |
| 2012-12 | +1.8% | +1.2% | +1.6% | +2.4% | +0.3% |
| 2013-01 | +3.2% | +2.9% | +3.2% | +3.8% | +1.5% |
| 2013-02 | +3.6% | +3.4% | +3.6% | +3.9% | +2.4% |
| 2013-03 | +3.5% | +3.9% | +3.6% | +3.5% | +2.6% |
| 2013-04 | +3.1% | +3.6% | +3.1% | +3.1% | +2.1% |
| 2013-05 | +2.2% | +2.6% | +2.3% | +2.1% | +1.3% |
| 2013-06 | +4.0% | +4.0% | +4.2% | +3.9% | +3.0% |
| 2013-07 | +3.4% | +3.4% | +3.6% | +3.3% | +2.7% |
| 2013-08 | +5.0% | +5.1% | +5.2% | +4.8% | +4.4% |
| 2013-09 | +5.1% | +5.2% | +5.3% | +4.9% | +4.7% |
| 2013-10 | +7.5% | +8.2% | +7.8% | +7.1% | +7.1% |
| 2013-11 | +6.9% | +7.5% | +7.3% | +6.4% | +6.5% |
| 2013-12 | +6.6% | +6.8% | +7.0% | +6.3% | +6.5% |
| 2014-01 | +5.8% | +5.7% | +5.9% | +5.6% | +6.2% |
| 2014-02 | +7.4% | +7.5% | +7.3% | +7.2% | +7.7% |
| 2014-03 | +8.8% | +9.0% | +8.9% | +8.7% | +8.6% |
| 2014-04 | +10.5% | +10.6% | +10.9% | +10.4% | +10.0% |
| 2014-05 | +11.4% | +11.2% | +11.7% | +11.5% | +10.4% |
| 2014-06 | +10.5% | +10.6% | +10.7% | +10.5% | +9.8% |
| 2014-07 | +12.7% | +13.0% | +13.0% | +12.6% | +11.5% |
| 2014-08 | +13.8% | +14.3% | +14.2% | +13.8% | +12.6% |
| 2014-09 | +14.8% | +14.9% | +15.0% | +14.9% | +13.5% |
| 2014-10 | +14.1% | +13.9% | +14.3% | +14.4% | +12.8% |
| 2014-11 | +13.8% | +13.6% | +13.9% | +14.0% | +12.8% |
| 2014-12 | +15.0% | +15.4% | +15.0% | +15.0% | +14.2% |
| 2015-01 | +14.0% | +14.7% | +14.2% | +13.8% | +13.6% |
| 2015-02 | +12.1% | +12.6% | +12.3% | +11.8% | +12.1% |
| 2015-03 | +10.1% | +10.7% | +10.4% | +9.7% | +10.4% |
| 2015-04 | +8.5% | +9.4% | +8.8% | +8.2% | +8.5% |
| 2015-05 | +8.8% | +10.1% | +9.2% | +8.4% | +8.7% |
| 2015-06 | +9.3% | +10.3% | +9.7% | +9.0% | +8.8% |
| 2015-07 | +8.9% | +9.8% | +9.5% | +8.5% | +8.9% |
| 2015-08 | +7.9% | +8.6% | +8.4% | +7.6% | +7.9% |
| 2015-09 | +8.0% | +9.1% | +8.5% | +7.5% | +8.2% |
| 2015-10 | +8.5% | +9.7% | +8.9% | +8.2% | +8.3% |
| 2015-11 | +10.2% | +11.4% | +10.7% | +9.9% | +9.7% |
| 2015-12 | +10.3% | +11.3% | +10.9% | +10.2% | +9.2% |
| 2016-01 | +10.6% | +11.5% | +11.3% | +10.6% | +9.2% |
| 2016-02 | +12.8% | +13.7% | +13.6% | +12.8% | +10.8% |
| 2016-03 | +15.0% | +15.5% | +15.5% | +15.2% | +13.1% |
| 2016-04 | +18.9% | +19.3% | +19.4% | +19.0% | +17.2% |
| 2016-05 | +17.7% | +17.6% | +17.8% | +17.8% | +17.0% |
| 2016-06 | +18.7% | +19.0% | +18.9% | +18.5% | +18.9% |
| 2016-07 | +17.5% | +17.9% | +17.3% | +17.4% | +18.1% |
| 2016-08 | +17.9% | +18.4% | +17.8% | +17.5% | +18.5% |
| 2016-09 | +16.0% | +16.1% | +16.2% | +15.8% | +16.3% |
| 2016-10 | +15.0% | +15.2% | +15.3% | +14.4% | +16.0% |
| 2016-11 | +13.5% | +14.2% | +13.8% | +12.8% | +14.9% |
| 2016-12 | +12.7% | +13.5% | +12.8% | +11.9% | +14.6% |
| 2017-01 | +12.9% | +13.9% | +12.8% | +12.2% | +14.6% |
| 2017-02 | +11.9% | +12.5% | +11.5% | +11.2% | +14.4% |
| 2017-03 | +11.1% | +11.8% | +10.9% | +10.2% | +13.8% |
| 2017-04 | +9.1% | +9.6% | +8.8% | +8.2% | +12.3% |
| 2017-05 | +8.6% | +9.3% | +8.7% | +7.5% | +11.3% |
| 2017-06 | +7.3% | +7.6% | +7.4% | +6.4% | +10.0% |
| 2017-07 | +6.9% | +7.0% | +7.2% | +6.0% | +9.5% |
| 2017-08 | +7.0% | +6.8% | +7.0% | +6.3% | +9.4% |
| 2017-09 | +6.6% | +6.7% | +6.6% | +6.0% | +8.9% |
| 2017-10 | +6.8% | +6.9% | +6.9% | +6.4% | +8.3% |
| 2017-11 | +6.5% | +6.2% | +6.6% | +6.2% | +7.5% |
| 2017-12 | +6.1% | +5.5% | +6.4% | +6.0% | +6.4% |
| 2018-01 | +5.5% | +4.8% | +5.9% | +5.3% | +5.8% |
| 2018-02 | +4.9% | +4.7% | +5.5% | +4.7% | +4.4% |
| 2018-03 | +4.2% | +3.9% | +4.8% | +4.3% | +3.2% |
| 2018-04 | +3.8% | +3.5% | +4.5% | +4.2% | +1.9% |
| 2018-05 | +3.3% | +3.1% | +3.9% | +3.9% | +0.5% |
| 2018-06 | +3.7% | +4.0% | +4.5% | +4.2% | +0.5% |
| 2018-07 | +2.5% | +3.5% | +3.4% | +3.0% | -0.9% |
| 2018-08 | +2.5% | +3.5% | +3.5% | +2.8% | -0.4% |
| 2018-09 | +2.5% | +3.3% | +3.4% | +2.8% | -0.5% |
| 2018-10 | +2.1% | +2.4% | +2.8% | +2.4% | -0.3% |
| 2018-11 | +1.6% | +2.0% | +2.2% | +2.0% | -1.0% |
| 2018-12 | +1.4% | +1.9% | +1.9% | +1.7% | -0.7% |
| 2019-01 | +1.0% | +1.9% | +1.6% | +1.2% | -1.3% |
| 2019-02 | +0.8% | +1.6% | +1.5% | +0.9% | -0.9% |
| 2019-03 | +0.7% | +1.7% | +1.5% | +0.6% | -1.2% |
| 2019-04 | 0.0% | +0.9% | +0.8% | -0.1% | -1.5% |
| 2019-05 | -0.5% | +0.2% | +0.2% | -0.6% | -1.8% |
| 2019-06 | -1.9% | -1.4% | -1.5% | -1.9% | -2.9% |
| 2019-07 | -1.5% | -1.4% | -1.3% | -1.5% | -2.3% |
| 2019-08 | -2.9% | -2.7% | -2.7% | -2.8% | -3.9% |
| 2019-09 | -2.7% | -2.7% | -2.7% | -2.6% | -3.5% |
| 2019-10 | -2.2% | -2.1% | -1.9% | -2.1% | -3.4% |
| 2019-11 | -1.8% | -1.8% | -1.3% | -1.7% | -2.8% |
| 2019-12 | -2.8% | -2.8% | -2.3% | -2.7% | -4.3% |
| 2020-01 | -3.3% | -3.5% | -2.9% | -3.0% | -4.8% |
| 2020-02 | -3.2% | -3.5% | -2.8% | -2.7% | -5.5% |
| 2020-03 | -1.8% | -2.2% | -1.5% | -1.2% | -3.9% |
| 2020-04 | -2.0% | -1.9% | -1.7% | -1.4% | -4.4% |
| 2020-05 | -0.3% | 0.0% | +0.1% | 0.0% | -1.9% |
| 2020-06 | -0.1% | +0.2% | +0.3% | +0.1% | -2.2% |
| 2020-07 | +0.3% | +0.5% | +0.9% | +0.5% | -1.8% |
| 2020-08 | +0.7% | +1.1% | +1.4% | +1.0% | -2.2% |
| 2020-09 | +1.9% | +2.8% | +2.9% | +2.1% | -1.2% |
| 2020-10 | +2.8% | +4.0% | +3.5% | +3.2% | -0.8% |
| 2020-11 | +3.1% | +4.0% | +3.2% | +3.7% | -0.5% |
| 2020-12 | +5.3% | +6.1% | +5.1% | +6.2% | +1.7% |
| 2021-01 | +7.7% | +7.7% | +7.4% | +8.8% | +5.0% |
| 2021-02 | +8.8% | +7.8% | +8.3% | +9.8% | +7.2% |
| 2021-03 | +7.6% | +5.6% | +6.8% | +8.8% | +7.4% |
| 2021-04 | +7.4% | +5.3% | +6.4% | +8.6% | +7.8% |
| 2021-05 | +6.6% | +4.8% | +5.5% | +7.9% | +6.4% |
| 2021-06 | +8.1% | +6.0% | +6.7% | +9.7% | +8.1% |
| 2021-07 | +7.6% | +5.8% | +6.4% | +9.0% | +7.3% |
| 2021-08 | +8.6% | +6.8% | +7.6% | +9.7% | +8.6% |
| 2021-09 | +8.4% | +6.5% | +7.7% | +9.3% | +8.3% |
| 2021-10 | +8.5% | +7.0% | +7.9% | +9.2% | +8.1% |
| 2021-11 | +9.5% | +8.3% | +9.1% | +9.9% | +9.0% |
| 2021-12 | +8.9% | +8.5% | +8.9% | +9.0% | +8.1% |
| 2022-01 | +9.5% | +9.4% | +9.7% | +9.7% | +7.7% |
| 2022-02 | +9.5% | +10.2% | +9.9% | +9.6% | +7.1% |
| 2022-03 | +9.7% | +11.4% | +10.6% | +9.5% | +6.0% |
| 2022-04 | +10.8% | +12.5% | +11.8% | +10.6% | +6.9% |
| 2022-05 | +10.4% | +11.8% | +11.5% | +10.4% | +6.2% |
| 2022-06 | +10.5% | +11.9% | +11.7% | +10.4% | +6.6% |
| 2022-07 | +11.7% | +12.7% | +12.8% | +11.9% | +7.4% |
| 2022-08 | +12.6% | +13.1% | +13.2% | +13.0% | +8.5% |
| 2022-09 | +12.0% | +12.3% | +12.4% | +12.6% | +7.9% |
| 2022-10 | +12.0% | +11.6% | +12.2% | +12.7% | +8.8% |
| 2022-11 | +10.7% | +10.3% | +11.0% | +11.4% | +7.7% |
| 2022-12 | +10.4% | +9.2% | +10.5% | +11.2% | +8.2% |
| 2023-01 | +8.4% | +8.1% | +8.7% | +8.8% | +6.5% |
| 2023-02 | +7.2% | +7.4% | +7.5% | +7.3% | +5.1% |
| 2023-03 | +5.5% | +6.4% | +6.0% | +5.4% | +3.4% |
| 2023-04 | +1.5% | +2.7% | +2.1% | +1.1% | -0.4% |
| 2023-05 | +1.1% | +2.1% | +1.7% | +0.6% | 0.0% |
| 2023-06 | -0.1% | +0.9% | +0.5% | -0.5% | -1.4% |
| 2023-07 | +0.1% | +1.1% | +0.6% | -0.3% | -1.2% |
| 2023-08 | -1.5% | -0.4% | -1.0% | -1.9% | -2.9% |
| 2023-09 | -2.0% | -1.1% | -1.6% | -2.4% | -3.0% |
| 2023-10 | -2.9% | -2.4% | -2.6% | -3.2% | -3.6% |
| 2023-11 | -3.2% | -2.6% | -2.7% | -3.6% | -3.6% |
| 2023-12 | -4.1% | -3.5% | -3.6% | -4.6% | -4.4% |
| 2024-01 | -6.1% | -5.6% | -5.7% | -6.4% | -6.5% |
| 2024-02 | -6.8% | -7.1% | -6.6% | -6.7% | -7.2% |
| 2024-03 | -6.7% | -7.7% | -6.7% | -6.3% | -6.7% |
| 2024-04 | -3.7% | -5.4% | -3.9% | -3.2% | -3.5% |
| 2024-05 | -3.3% | -5.0% | -3.6% | -2.8% | -3.1% |
| 2024-06 | -2.9% | -4.5% | -3.2% | -2.4% | -2.8% |
| 2024-07 | -2.7% | -4.1% | -3.0% | -2.1% | -2.8% |
| 2024-08 | -2.3% | -3.7% | -2.6% | -1.7% | -2.4% |
| 2024-09 | -1.9% | -2.8% | -2.1% | -1.5% | -2.4% |
| 2024-10 | -2.0% | -2.5% | -2.1% | -1.7% | -2.5% |
| 2024-11 | -1.7% | -2.2% | -1.7% | -1.2% | -2.7% |
| 2024-12 | -0.5% | -0.8% | -0.6% | +0.1% | -2.0% |
| 2025-01 | +2.5% | +2.2% | +2.5% | +3.1% | +0.6% |
| 2025-02 | +4.2% | +4.4% | +4.2% | +4.7% | +2.4% |
| 2025-03 | +6.8% | +6.2% | +6.5% | +7.6% | +5.8% |
| 2025-04 | +6.0% | +6.4% | +6.0% | +6.6% | +4.4% |
| 2025-05 | +6.1% | +7.0% | +6.1% | +6.6% | +3.7% |
| 2025-06 | +4.8% | +6.8% | +5.4% | +4.8% | +1.4% |
| 2025-07 | +4.1% | +5.4% | +4.6% | +4.3% | +1.2% |
| 2025-08 | +3.8% | +4.8% | +4.5% | +3.8% | +1.2% |
| 2025-09 | +3.1% | +3.8% | +3.8% | +3.3% | +0.6% |
| 2025-10 | +3.2% | +3.8% | +4.0% | +3.3% | +0.2% |
| 2025-11 | +2.9% | +3.4% | +3.5% | +3.3% | +0.2% |
| 2025-12 | +3.3% | +3.3% | +3.8% | +3.8% | +0.8% |
| 2026-01 | +2.4% | +1.8% | +2.7% | +3.0% | +0.1% |
| 2026-02 | +1.9% | +1.4% | +2.7% | +2.4% | -0.7% |
| 2026-03 | +0.3% | +0.8% | +1.5% | +0.5% | -4.0% |
Sold House Prices in the Medway Towns
The average sold price across all property types in Medway is £297,435, which is 2.6% above the England average of £289,946 as of March 2026. That headline hides a sharp split by type. Detached and semi-detached homes carry double-digit premiums to England, while flats sell 21.6% below the national flat average. The pattern reflects Medway's housing mix: a deep stock of family houses that London movers compete for, and a shallow, mostly older flat market with none of the institutional city-centre premium seen in Manchester or Leeds.
| Property Type | Medway Average | England Average | Difference |
|---|---|---|---|
| Detached houses | £534,634 | £470,492 | +13.6% |
| Semi-detached houses | £352,779 | £288,185 | +22.4% |
| Terraced houses | £274,861 | £243,788 | +12.7% |
| Flats and maisonettes | £168,288 | £214,563 | -21.6% |
| All property types | £297,435 | £289,946 | +2.6% |
Detached houses at £534,634 sit 13.6% above England's £470,492. The larger detached stock is weighted towards the outlying areas, the Hoo Peninsula in ME3 and the village fringe around Aylesford in ME20, where plots are bigger and buyers are often trading down from pricier parts of the county. Annual growth of 0.8% was the softest reading of the four types over the past year.
Semi-detached houses at £352,779 carry the widest premium of any type at 22.4% above England's £288,185. This is the core of Medway's owner-occupier and family-let stock, spread across Gillingham, Rainham and Walderslade, and the 1.5% annual growth is the strongest reading of the four types. For a landlord, the semi is the workhorse purchase across most of the conurbation.
Terraced houses at £274,861 sit 12.7% above England's £243,788. Medway has a large Victorian and Edwardian terraced stock concentrated in Chatham, Rochester and Gillingham, much of it the smaller-unit housing that forms the buy-to-let market. Annual growth of 0.5% is modest but positive.
Flats and maisonettes at £168,288 show the only discount to England, at 21.6% below the £214,563 national figure. Medway is not a flat-heavy market; the apartment stock is a mix of older conversions and the newer Chatham Maritime waterfront blocks, without the scale that lifts flat values in the big regional cities. Annual change of -4.0% confirms a soft flat market.
Price Per Square Foot in the Medway Towns
Just under £100 per square foot separates Medway's cheapest postcode from its most expensive, with ME7 in Gillingham at £302 and ME20 around Aylesford at £399. Price per square foot strips out the effect of property size and gives a cleaner read on location value. Gillingham and Chatham anchor the affordable end, while the outlying Aylesford and Gravesend postcodes command the highest rates.
| Rank | Area | Price Per Sq Ft |
|---|---|---|
| 1 | ME7 (Gillingham, Hempstead) | £302 |
| 2 | ME4 (Chatham) | £303 |
| 3 | ME2 (Strood, Halling) | £359 |
| 4 | ME1 (Rochester) | £361 |
| 5 | ME5 (Walderslade) | £366 |
| 6 | ME8 (Rainham, Parkwood) | £375 |
| 7 | ME3 (Hoo, Chattenden) | £377 |
| 8 | DA12 (Gravesend, Shorne) | £380 |
| 9 | ME14 (Maidstone East, Bearsted) | £382 |
| 10 | ME20 (Aylesford) | £399 |
ME7 in Gillingham at £302 per square foot is the cheapest bricks-and-mortar in the Medway Towns, with ME4 in Chatham just behind at £303. Gillingham and Chatham hold the conurbation's largest concentration of terraced and smaller semi-detached stock, and that mix keeps the per-foot rate down even where headline asking prices are not the lowest.
ME20 around Aylesford at £399 per square foot tops the table, £97 above ME7. The higher rate reflects the newer and larger village-fringe housing on the Maidstone border, where buyers pay a premium for location and plot rather than for an urban postcode.
For Sale Asking Prices in the Medway Towns
ME4 in Chatham at £245,959 and ME3 around Hoo at £413,566 sit 68.1% apart, the widest asking-price gap across Medway's ten postcodes. That hierarchy broadly tracks sold prices, running from the affordable urban core out to the pricier village fringe. The mean asking price across all ten postcodes is £339,902.
| Rank | Area | Asking Price |
|---|---|---|
| 1 | ME4 (Chatham) | £245,959 |
| 2 | ME7 (Gillingham, Hempstead) | £274,272 |
| 3 | ME2 (Strood, Halling) | £311,059 |
| 4 | ME5 (Walderslade) | £324,208 |
| 5 | ME1 (Rochester) | £334,525 |
| 6 | ME8 (Rainham, Parkwood) | £359,675 |
| 7 | DA12 (Gravesend, Shorne) | £365,018 |
| 8 | ME14 (Maidstone East, Bearsted) | £366,129 |
| 9 | ME20 (Aylesford) | £404,610 |
| 10 | ME3 (Hoo, Chattenden) | £413,566 |
ME4 in Chatham at £245,959 is the lowest asking price in the Medway Towns and the only postcode that falls below the £250,000 mark. Chatham is the conurbation's main retail and service centre, with a dense terraced core, the university campus nearby and the widest pool of smaller stock. For an investor working to a fixed budget, ME4 offers the most property for the money and the lowest barrier to entry.
ME3 around Hoo at £413,566 is the priciest postcode, 68.1% above ME4. The Hoo Peninsula and Chattenden sit apart from the urban towns, with larger detached houses on bigger plots. It reads as owner-occupier and family territory rather than a rental market, and the yield data below confirms it.

House Price Growth in the Medway Towns
Every Medway postcode posted positive five-year growth, from 3.1% in ME1 around Rochester to 15.1% in ME20 near Aylesford, though the one-year and three-year readings are far more mixed. The outlying and suburban postcodes led over five years, while the urban core of Chatham and Rochester lagged after a softer recent run.
| Area | 1 Year | 3 Years | 5 Years |
|---|---|---|---|
| ME20 (Aylesford) | -0.5% | 1.4% | 15.1% |
| DA12 (Gravesend, Shorne) | 2.5% | 1.7% | 13.9% |
| ME5 (Walderslade) | -0.4% | 0.8% | 13.7% |
| ME2 (Strood, Halling) | 0.6% | -0.7% | 12.5% |
| ME7 (Gillingham, Hempstead) | 1.0% | 1.0% | 12.3% |
| ME8 (Rainham, Parkwood) | 0.7% | -0.9% | 12.0% |
| ME14 (Maidstone East, Bearsted) | 2.3% | 16.1% | 10.8% |
| ME3 (Hoo, Chattenden) | 1.6% | -2.1% | 8.6% |
| ME4 (Chatham) | -0.9% | -6.5% | 6.5% |
| ME1 (Rochester) | -5.1% | -2.8% | 3.1% |
ME20 near Aylesford leads on five-year growth at 15.1%, with DA12 around Gravesend and Shorne close behind at 13.9%. These are the outlying postcodes that gained most during the pandemic race for space, and both held onto those gains through the rate shock, with DA12 the only postcode still up over the past year at 2.5%.
ME1 around Rochester recorded the weakest one-year reading at -5.1% and the smallest five-year gain at 3.1%. The urban Rochester and Chatham postcodes, ME1 and ME4, both softened over the past one and three years after leading the earlier recovery, a common pattern where the cheapest stock moved first and then paused.
Monthly Property Sales in the Medway Towns
Transaction volumes across Medway run from 21 to 44 sales per postcode per month, with turnover rates between 9% and 20%. The busiest suburban postcodes record the most sales, while the urban core of Rochester clears the smallest share of its listings each month.
| Area | Sales Per Month | Turnover | Asking Price |
|---|---|---|---|
| ME5 (Walderslade) | 44 | 18% | £324,208 |
| ME7 (Gillingham, Hempstead) | 41 | 12% | £274,272 |
| ME8 (Rainham, Parkwood) | 40 | 18% | £359,675 |
| DA12 (Gravesend, Shorne) | 37 | 20% | £365,018 |
| ME14 (Maidstone East, Bearsted) | 34 | 12% | £366,129 |
| ME2 (Strood, Halling) | 33 | 16% | £311,059 |
| ME4 (Chatham) | 29 | 12% | £245,959 |
| ME1 (Rochester) | 28 | 9% | £334,525 |
| ME3 (Hoo, Chattenden) | 22 | 13% | £413,566 |
| ME20 (Aylesford) | 21 | 14% | £404,610 |
DA12 around Gravesend and Shorne has the highest turnover at 20%, with ME5 in Walderslade and ME8 in Rainham close behind at 18%. A higher turnover rate means each month's sales clear a larger share of what is advertised, which points to a shorter wait for a buyer when a landlord comes to sell.
ME1 around Rochester has the lowest turnover at 9%, despite a mid-table 28 sales a month. Rochester's stock includes a good deal of period and higher-value housing that sits longer before selling, so a similar monthly count represents a smaller share of a larger, slower-moving market. ME5 in Walderslade records the most transactions overall at 44 a month.
Medway Towns Rental Market Analysis
Monthly rents across Medway range from £1,241 in ME1 around Rochester to £1,627 in ME20 near Aylesford, with gross rental yields from 3.9% to 6.3%. For investors asking is buy to let worth it in the Medway Towns, the sections below break down rents, yields and tenant affordability postcode by postcode. If you are working out how to build a property portfolio in the South East, Medway's mix of near-national prices and above-national yields makes it one of the more accessible entry points in the region. Browse current buy-to-let investments for sale across the region.
Average Rent & Gross Rental Yields in the Medway Towns
Gross rental yields in the Medway Towns range from 3.9% in ME3 around Hoo to 6.3% in ME4 in Chatham. The cheapest postcode delivers the highest yield and the most expensive delivers the lowest, the familiar inverse pattern. ME4 pairs the lowest asking price at £245,959 with a solid £1,292 monthly rent to top the yield table.
| Area | Average Monthly Rent | Asking Price | Gross Yield |
|---|---|---|---|
| ME4 (Chatham) | £1,292 | £245,959 | 6.3% |
| ME7 (Gillingham, Hempstead) | £1,261 | £274,272 | 5.5% |
| ME2 (Strood, Halling) | £1,321 | £311,059 | 5.1% |
| ME20 (Aylesford) | £1,627 | £404,610 | 4.8% |
| ME5 (Walderslade) | £1,274 | £324,208 | 4.7% |
| ME1 (Rochester) | £1,241 | £334,525 | 4.5% |
| ME8 (Rainham, Parkwood) | £1,344 | £359,675 | 4.5% |
| DA12 (Gravesend, Shorne) | £1,329 | £365,018 | 4.4% |
| ME14 (Maidstone East, Bearsted) | £1,285 | £366,129 | 4.2% |
| ME3 (Hoo, Chattenden) | £1,355 | £413,566 | 3.9% |
ME4 in Chatham at 6.3% combines the lowest asking price with a mid-range rent to deliver the best yield in the Medway Towns. A 30% deposit of £73,788 gets an investor into the highest-yielding postcode, and Chatham's dense terraced stock and proximity to the university campus keep tenant demand broad.
ME3 around Hoo at 3.9% sits at the bottom of the yield table. The £1,355 monthly rent is respectable, but against a £413,566 asking price the income return is compressed. In ME3 the premium price does more for capital value than for rental yield.
Is Medway Towns Rent High?
Monthly rents in the Medway Towns take between 37.6% and 49.3% of the local median gross salary. The widely cited threshold for rent affordability is 30% of gross income, and every Medway postcode sits above it. That reflects two things at once: rents that have risen with the London commuter demand, and local wages that track the national rather than the higher South East average.
The median gross weekly salary in Medway is £762.00, which equates to £3,302 per month or £39,622 per year. This is above the Great Britain median of £752.40 per week but below the South East regional figure. Data from the Nomis Labour Market Profile (ASHE 2025).
| Rank | Area | Rent as % of Income |
|---|---|---|
| 1 | ME20 (Aylesford) | 49.3% |
| 2 | ME3 (Hoo, Chattenden) | 41.0% |
| 3 | ME8 (Rainham, Parkwood) | 40.7% |
| 4 | DA12 (Gravesend, Shorne) | 40.2% |
| 5 | ME2 (Strood, Halling) | 40.0% |
| 6 | ME4 (Chatham) | 39.1% |
| 7 | ME14 (Maidstone East, Bearsted) | 38.9% |
| 8 | ME5 (Walderslade) | 38.6% |
| 9 | ME7 (Gillingham, Hempstead) | 38.2% |
| 10 | ME1 (Rochester) | 37.6% |
ME1 around Rochester is the most affordable for tenants at 37.6% of median income, helped by the lowest rent in the conurbation at £1,241 a month. For a landlord, rents that sit closer to what local earners can comfortably carry tend to correlate with lower void periods and fewer arrears.
ME20 near Aylesford is the least affordable at 49.3%, reflecting the highest rent in the table at £1,627. Tenants renting at that level in the village-fringe postcodes are typically dual-income or commuting households earning above the local median rather than single earners on it.
Buy-to-Let Considerations
Are House Prices High in the Medway Towns? Price-to-Earnings Ratios
Buying a property in the Medway Towns takes between 6.2 and 10.4 times the median annual salary. This is based on the Nomis Labour Market Profile for Medway showing the median gross annual income for Medway residents is £39,622.
As a national yardstick, England's average sold home of £289,946 costs 7.4 times the Great Britain median salary of £39,125. Two of Medway's ten postcodes, ME4 and ME7, come in under that 7.4x mark, so they are more affordable against local wages than the country as a whole is against national wages.
| Rank | Area | Price-to-Earnings Ratio |
|---|---|---|
| 1 | ME4 (Chatham) | 6.2x |
| 2 | ME7 (Gillingham, Hempstead) | 6.9x |
| 3 | ME2 (Strood, Halling) | 7.9x |
| 4 | ME5 (Walderslade) | 8.2x |
| 5 | ME1 (Rochester) | 8.4x |
| 6 | ME8 (Rainham, Parkwood) | 9.1x |
| 7 | DA12 (Gravesend, Shorne) | 9.2x |
| 8 | ME14 (Maidstone East, Bearsted) | 9.2x |
| 9 | ME20 (Aylesford) | 10.2x |
| 10 | ME3 (Hoo, Chattenden) | 10.4x |
ME4 in Chatham at 6.2x is below the national benchmark of 7.4x, the most affordable entry point in the Medway Towns. A property at 6.2 times local earnings is competitive with the cheaper end of the South East while sitting inside a large conurbation with fast London links.
ME3 around Hoo at 10.4x is the least affordable, well above the national benchmark. At more than ten times the local median salary, the Hoo Peninsula is owner-occupier and family territory, where buyers are often relocating from pricier parts of the county rather than local earners on the median wage.
Deposit Requirements in the Medway Towns
A 30% deposit on a buy-to-let property in the Medway Towns ranges from £73,788 in ME4 around Chatham to £124,070 in ME3 near Hoo. The gap between the cheapest and most expensive deposit is £50,282. For investors comparing Medway with the rest of the South East, these figures sit well below the county's premium towns while still offering yields above the regional norm.
Beyond the deposit, the stamp duty and other buy-to-let running costs affect the total capital required.
| Rank | Area | 30% Deposit Required |
|---|---|---|
| 1 | ME4 (Chatham) | £73,788 |
| 2 | ME7 (Gillingham, Hempstead) | £82,282 |
| 3 | ME2 (Strood, Halling) | £93,318 |
| 4 | ME5 (Walderslade) | £97,262 |
| 5 | ME1 (Rochester) | £100,357 |
| 6 | ME8 (Rainham, Parkwood) | £107,902 |
| 7 | DA12 (Gravesend, Shorne) | £109,506 |
| 8 | ME14 (Maidstone East, Bearsted) | £109,839 |
| 9 | ME20 (Aylesford) | £121,383 |
| 10 | ME3 (Hoo, Chattenden) | £124,070 |
ME4 in Chatham is the cheapest way into the Medway Towns, at a £73,788 deposit for the highest-yielding postcode. Stepping up to ME7 in Gillingham costs roughly £8,500 more and brings a similar urban terraced market with a 5.5% yield. Between them, Chatham and Gillingham cover the affordable, higher-yielding heart of the conurbation.
At the other end, ME20 near Aylesford and ME3 around Hoo need deposits above £120,000. They buy a different kind of investment: larger village-fringe houses on the Maidstone and Hoo edges, where the money goes towards capital value and plot rather than yield, with returns of 4.8% and 3.9% respectively.
What the Medway Towns Data Tells Buy-to-Let Investors
In the Medway Towns the cheapest way in is also the highest-yielding postcode. ME4 in Chatham has the top yield at 6.3%, the lowest asking price for buying an investment property at £245,959, and the most affordable prices against local earnings at 6.2 times income. A 30% deposit there is £73,788, the lowest in the conurbation, for a home renting at £1,292 a month.
ME7 in Gillingham sits just behind on yield at 5.5% and second on affordability, so the two urban western postcodes cover the higher-income end of the market. ME2 in Strood follows at 5.1%. All three deliver above the 4.7% national benchmark yield while keeping asking prices below the Medway mean of £339,902.
The five-year growth picture reads differently. The outlying postcodes led, with ME20 near Aylesford up 15.1% and DA12 around Gravesend up 13.9%, while the urban core of Rochester and Chatham lagged at 3.1% and 6.5%. Buyers who want to come in below asking often look through off-market property in Medway channels.
Medway has no selective licensing scheme for private landlords across the conurbation as a whole, though HMOs still need the usual licensing. With an 81.7% employment rate, fast trains to London and sold prices only 2.6% above the England average, Medway reads as one of the more accessible South East markets: yields above the regional norm on prices close to the national line.
How the Medway Towns Compares
The Medway Towns' mean asking price of £339,902 sits in the middle of five South East locations compared here, and its top yield of 6.3% trails only the coastal cities of Southampton and Portsmouth. The comparison below places Medway alongside four nearby Kent and South East locations, each with a different investor profile. The mean asking price and mean monthly rent are simple averages across all postcodes with data. Top gross yield is the single highest postcode yield in each location.
| Location | Mean Asking Price | Mean Monthly Rent | Mean Gross Yield | Top Yield (postcode) |
|---|---|---|---|---|
| Southampton | £260,743 | £1,270 | 5.8% | 7.7% (SO17) |
| Portsmouth | £288,764 | £1,330 | 5.5% | 6.7% (PO4) |
| Medway | £339,902 | £1,333 | 4.7% | 6.3% (ME4) |
| Canterbury | £412,829 | £1,360 | 4.0% | 5.2% (CT1) |
| Maidstone | £491,082 | £1,520 | 3.7% | 4.8% (ME20) |
Medway sits third of the five by asking price, below the Kent county town of Maidstone at £491,082 and the cathedral city of Canterbury at £412,829, and above the two south-coast cities. Its top yield of 6.3% is competitive for the region, beaten only by Southampton at 7.7% and Portsmouth at 6.7%, both cheaper coastal markets with deeper flat and student stock.
For investors prioritising income, Southampton at 7.7% and Portsmouth at 6.7% deliver the higher top-line yields on the lowest asking prices in the table. Canterbury and Maidstone sit at the pricier, lower-yielding end, closer to Medway on tenant demographic but further from it on entry cost. Medway lands between the two groups: yields near the coastal cities' level on prices below the Kent county towns'. For a data-driven comparison across all UK locations, see our highest-yielding areas guide.
Frequently Asked Questions
Is the Medway Towns a good place to live for buy-to-let tenants?
It rents on the strength of its job market. Medway's employment rate is 81.7%, above the national 75.6%, and unemployment is low at 3.7%, so tenants generally have a steady footing. The typical wage is £762 a week, which tracks the Great Britain average rather than the higher South East figure, and that is part of why rents take a larger share of income here than the 30% affordability mark.
It is also an easy place to rent in. Five towns grown together give tenants a full range of shops, schools and services, and fast trains to London St Pancras in around 40 minutes suit the commuters who have driven much of Medway's demand over the past decade.
What are the best areas in the Medway Towns for property investment?
The ten postcodes split fairly cleanly between income and growth. The urban western core leans towards income: ME4 in Chatham is the cheapest way in at £245,959 and carries the highest yield at 6.3%, with ME7 in Gillingham close behind at 5.5%. The outlying postcodes tell a different story on growth, where ME20 near Aylesford rose 15.1% over five years and DA12 around Gravesend 13.9%, the strongest in the conurbation.
At the top of the price table, ME3 around Hoo is the priciest at £413,566 and the lowest-yielding at 3.9%, while the urban core of ME1 around Rochester grew slowest over five years at 3.1%. So if income is the priority, ME4 and ME7 in Chatham and Gillingham lead on yield and price; the outlying postcodes have shown the stronger five-year capital record.
How do the Medway Towns compare to Maidstone for buy-to-let?
They are close neighbours with different balances. Maidstone is the county town just to the south, with its own mix of prices and yields, while Medway is the larger north Kent conurbation on the river. Medway's top yield of 6.3% in ME4 is among the higher readings in this part of Kent, and its cheapest entry at £245,959 is more accessible than much of the surrounding county.
Both draw on the same London commuter demand and the same road network, so the choice tends to come down to which specific postcode and stock type fits the budget rather than a wide gap between the two towns.
Is there demand for student accommodation in the Medway Towns?
There is a modest student market, concentrated around Chatham. The Universities at Medway campus, shared between the University of Kent, the University of Greenwich and Canterbury Christ Church University, sits at Chatham Maritime, and students tend to prefer rentals within walking distance of the site in ME4 and ME7. It is a smaller market than a dedicated university city, so student lets here come with the usual summer voids and more hands-on management. For the purpose-built end of the market, see our guide to student property investment.
For the shared-house route, an HMO across Chatham or Gillingham can lift the yield above the single-let figures shown above, though it needs the right licensing and management. For how the numbers work on a shared house, see our HMO investment guide.
Can I find buy-to-let property under £250,000 in the Medway Towns?
Yes, but only in ME4 around Chatham on average, at £245,959, which is the single postcode that sits below the £250,000 mark. Elsewhere the way in below that figure is by property type rather than postcode: the terraced stock in Chatham, Gillingham and Rochester runs cheaper than the postcode averages, and flats across Medway sell for £168,288 on the Land Registry index. If sub-£250,000 is the target, Chatham terraces and Medway flats are where to look, or explore below market value properties.
What type of property is most common in the Medway Towns?
Houses far outnumber flats across Medway. On the Land Registry index, detached homes average £534,634, semi-detached £352,779 and terraced £274,861, all trading above their England averages, while flats sit at £168,288, the only type below the national figure at 21.6% under it. The bigger detached and family stock is weighted towards the outlying areas around Hoo in ME3 and Aylesford in ME20.
The smaller stock that usually suits buy-to-let, terraces and flats, is concentrated in the urban core of Chatham, Gillingham and Rochester, which is also where the cheapest asking prices and the highest yields sit. That is why ME4 in Chatham combines the lowest asking price with the top yield in the conurbation.
What are average house prices in the Medway Towns?
On the Land Registry index, the average sold price across Medway is £297,435, about 2.6% above the England average of £289,946 as of March 2026. Asking prices by postcode run from £245,959 in ME4 around Chatham up to £413,566 in ME3 near Hoo, with a mean across the ten postcodes of £339,902. By type, detached homes average £534,634, semi-detached £352,779, terraced £274,861 and flats £168,288.
Through a buy-to-let lens, ME4 in Chatham is the cheapest entry and the highest-yielding at 6.3%, while ME3 around Hoo is the dearest and lowest-yielding at 3.9%.
How do I buy an investment property in the Medway Towns?
Start with the numbers that fit your budget, because they point you at a different postcode. ME4 in Chatham is the cheapest entry at £245,959 and the highest-yielding at 6.3%. ME7 in Gillingham pairs a 5.5% yield with a similar urban terraced market. Budget for a 30% deposit, which runs from £73,788 in ME4 to £124,070 in ME3.
Beyond what is listed openly, plenty of experienced investors buy below asking through off market properties and BMV property. To see what is available now, browse investment properties or buy-to-let homes for sale.
Ready to buy property?
Browse investment properties with prices and gross yields shown for each opportunity.
Get property alerts