Where to Buy Property Investments in Oxford: Yields of 5.4%
Oxford's top gross rental yield is 5.4% in OX4 (Cowley, Blackbird Leys, Iffley). The average sold price across Oxford is £480,531, which is 64.6% above the England average of £291,865. The city's population grew 6.67% from 151,906 to 162,040 between the 2011 and 2021 censuses.
Monthly rents in Oxford range from £1,495 in OX5 (Kidlington) to £1,912 in OX2 (Summertown, Jericho), with five of the city's seven postcodes reporting rental data. Oxford is one of the most expensive property markets outside London, and that price premium shapes the investment calculation. A 30% deposit on the cheapest postcode (OX4 at £415,679) starts at £124,704. This guide covers all seven Oxford postcodes, with data on yields, growth, rents, and affordability.
Oxford is a city in the South East of England, in the county of Oxfordshire. The ONS code for Oxford is E07000178. The data in this guide covers the Oxford local authority area and its seven outcode postcodes. For investors looking at buy-to-let properties in the wider region, we also publish guides on nearby locations including Reading, Cambridge, Milton Keynes, and Swindon.
Article updated: March 2026
Oxford Buy-to-Let Market Overview 2026
Oxford is a premium property market where average sold prices sit 64.6% above the England average, with yields concentrated in the city's eastern postcodes.
- Average sold price: £480,531 (64.6% above England's £291,865)
- Asking price range: £415,679 (OX4, Cowley, Blackbird Leys, Iffley) to £664,427 (OX2, Summertown, Jericho)
- Rental yields: 3.5% (OX2) to 5.4% (OX4) across 5 postcodes with rental data
- Rental income: Monthly rents from £1,495 (OX5, Kidlington) to £1,912 (OX2, Summertown, Jericho)
- Price per sq ft: House prices from £426/sq ft (OX44) to £571/sq ft (OX2)
- Market activity: Sales ranging from 5 per month (OX33) to 34 per month (OX2)
- Deposit requirements: 30% deposits range from £124,704 (OX4) to £199,328 (OX2)
- Affordability ratios: Property prices from 9.6 to 15.3 times Oxford's median annual salary of £43,289
Contents

-
by Robert Jones, Founder of Property Investments UK
With two decades in UK property, Rob has been investing in buy-to-let since 2005, and uses property data to develop tools for property market analysis.

Property Data Sources
Our location guide relies on diverse, authoritative datasets including:
- HM Land Registry UK House Price Index
- Ministry of Housing, Communities and Local Government
- Ordnance Survey Data Hub
- Propertydata.co.uk
We update our property data quarterly to ensure accuracy. Last update: March 2026. All data is presented as provided by our sources without adjustments or amendments.
Why Invest in Oxford?
Oxford is home to 162,040 people and a median annual salary of £43,289, which is 10.6% above the Great Britain median of £39,125. The city's economic base is built on education, health, biosciences, technology, and publishing. The University of Oxford and Oxford Brookes University between them draw tens of thousands of students and academic staff into the city, creating consistent demand for rental accommodation across multiple postcodes.
The population grew 6.67% between the 2011 and 2021 censuses, from 151,906 to 162,040. Oxford's employment rate of 76.8% sits below the South East regional average of 78.8% but above the Great Britain average of 75.4%. The unemployment rate for Oxford is suppressed in the latest ASHE data due to small sample sizes.
Oxford Economic Summary
- Population: 162,040 (2021 Census). Growth of 6.67% from 2011.
- Median annual salary: £43,289 (Oxford), £41,616 (South East), £39,125 (Great Britain)
- Employment rate: 76.8% (Oxford), 78.8% (South East), 75.4% (Great Britain)
- Unemployment rate: Data suppressed (Oxford), figures available at regional/national level
- Key employment sectors: Education, health, biosciences, technology, publishing, tourism
Source: ONS Census 2021, Nomis Labour Market Profile (ASHE 2025)
Regeneration and Investment in Oxford
More than £1.5 billion in infrastructure and development spending is either committed or underway across Oxford. Rail, road, and employment-generating projects are reshaping the city's southern and northern edges.
- Cowley Branch Line Reopening (Underway, £155 million): The government confirmed £120 million in October 2025 to reopen the Cowley Branch Line to passenger services, with new stations at Oxford Littlemore and Oxford Cowley connecting south-east Oxford to the main rail network. Network Rail estimates up to one million journeys per year within three years of opening. Updates at Oxford City Council.
- Oxford Station Area Upgrade (Underway, £161 million): Network Rail is building a new fifth platform, a fully accessible western entrance off Botley Road, and replacement of the Botley Road bridge to increase train capacity across the network. Construction began in April 2023, with the new platform and entrance due to open in 2026. Updates at GOV.UK.
- Oxford North Innovation District (In progress, £1.2 billion): A 64-acre innovation district on the northern edge of Oxford delivering one million square feet of lab and workspace alongside 480 new homes. Phase 1 is operational with 317 homes under construction in the Canalside Quarter. Updates at Oxford North.

Oxford Property Market Analysis
When was the last house price crash in Oxford?
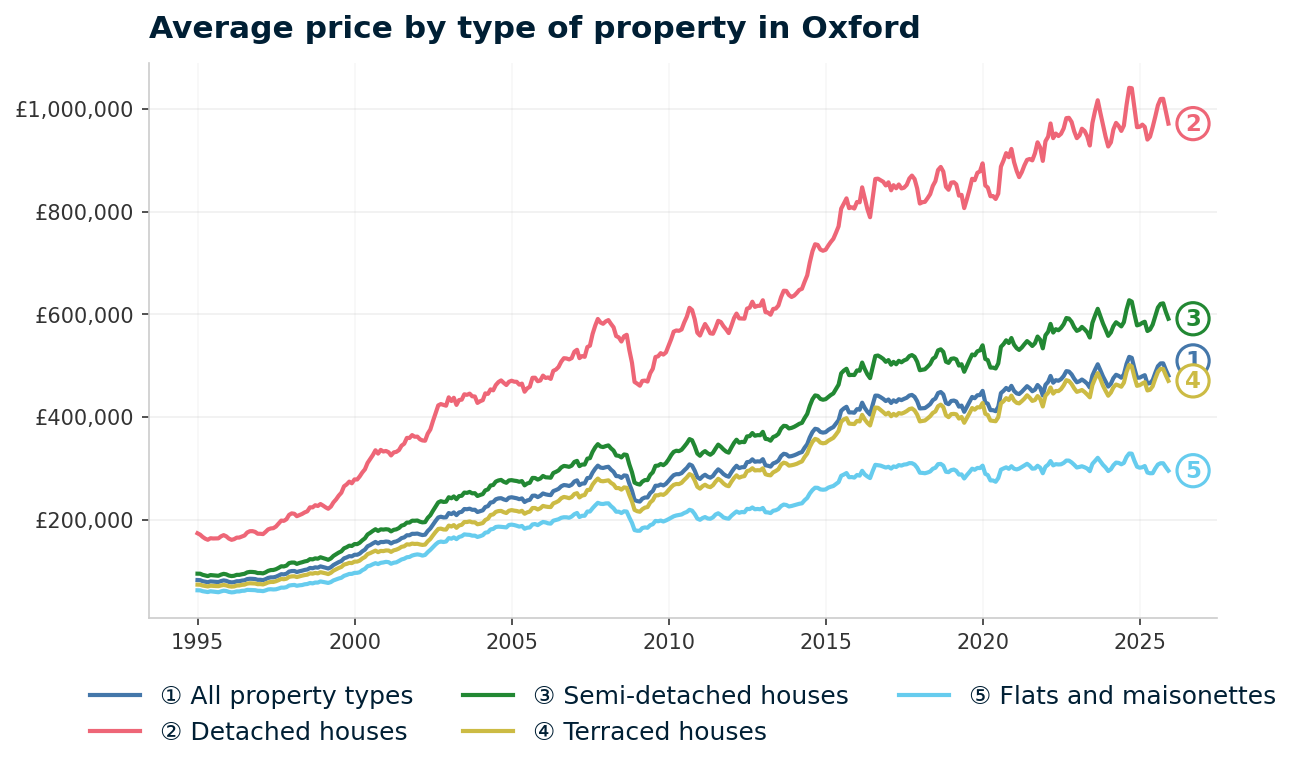
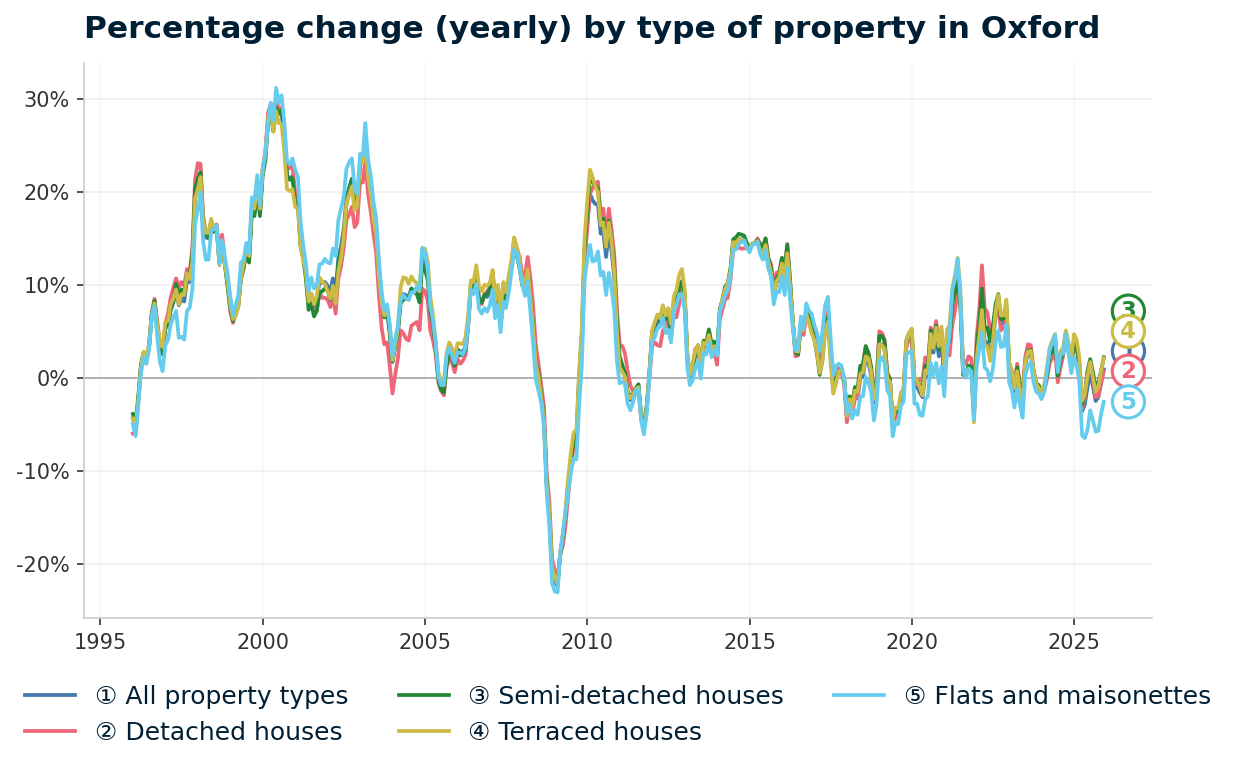
Oxford's average property price peaked at £305,073 in October 2007 before falling 23.0% to a trough of £235,043 in February 2009. Oxford falls within the Oxford local authority area, so all sold property prices from HM Land Registry are available at this level. The data below covers January 1995 to December 2025.
The worst annual change reading was -22.4% in February 2009. Oxford's decline was steeper than both the South East region (-20.0%) and England as a whole (-18.2%). Prices recovered to their pre-crash level by September 2010, reaching £307,486.
Cycle-by-cycle breakdown:
- 1995-2007 (The Boom): Oxford prices started at £82,121 in January 1995 and rose to £305,073 by October 2007, a gain of 271.5%. Sustained demand from the university sector, constrained housing supply within the city's green belt, and easy credit access all drove prices upward through this period.
- 2008-2009 (The Financial Crisis): Prices peaked at £305,073 (October 2007) and bottomed at £235,043 (February 2009), a decline of 23.0%. The worst annual change reading was -22.4% in February 2009. England fell 18.2% (from £183,883 to £150,438). The South East fell 20.0% (from £240,647 to £192,598). Oxford's steeper fall reflected its higher price point and greater exposure to discretionary purchases.
- 2010-2013 (Recovery): Prices climbed from £275,383 in January 2010 to £317,696 by January 2013. Oxford exceeded its pre-crash peak of £305,073 by September 2010, well ahead of the national recovery timeline.
- 2014-2016 (Acceleration): Strong growth took prices from £325,310 in January 2014 to £404,615 by June 2016 (Brexit vote month). Oxford's status as a global university city and Oxfordshire's high-wage economy underpinned buyer confidence during this period.
- 2017-2019 (Plateau): Prices levelled off between £431,146 and £433,968. Brexit uncertainty and stamp duty changes weighed on transactions, and Oxford's elevated price-to-earnings ratios limited further upward pressure.
- 2020-2022 (Pandemic surge): Prices dipped briefly to £411,246 in June 2020 during the first lockdown, then climbed to a pandemic-era peak of £489,286 in September 2022. The stamp duty holiday and a shift in buyer preferences toward university cities with green space supported demand. This is consistent with broader patterns in the 18-year property cycle.
- 2023 (Rate shock): Prices softened to £457,230 by June 2023, a fall of 6.6% from the September 2022 peak, as mortgage rates rose sharply.
- 2024-2025 (Current): Prices recovered from £459,141 in January 2024 to £480,531 by December 2025. The year-on-year annual change in December 2025 stood at +0.9%.
Long-term growth summary:
- 5 years (2020-2025): 4.3% growth (£460,586 to £480,531)
- 10 years (2015-2025): 17.7% growth (£408,136 to £480,531)
- 15 years (2010-2025): 70.0% growth (£282,721 to £480,531)
- 20 years (2005-2025): 95.0% growth (£246,401 to £480,531)
- 25 years (2000-2025): 207.8% growth (£156,114 to £480,531)
- 30 years (1995-2025): 496.6% growth (£80,551 to £480,531)
Oxford's 5-year growth of 4.3% lags behind the long-term trend. The 30-year total of 496.6% reflects decades of constrained supply meeting sustained university-driven demand. For context, Oxford prices fell 23.0% during the 2008-2009 crash. Buyers at the October 2007 peak waited less than three years to recover their purchase price. Buyers at the 2009 trough have seen prices more than double.
Source: HM Land Registry House Price Index for Oxford, January 1995 to December 2025.
Thinking of Buying?
We have off-market investment properties averaging 8%+ annual yield.
View Property DealsSold House Prices in Oxford
The average sold price across all property types in Oxford is £480,531, which is £188,666 (64.6%) above the England average of £291,865. The premium is most pronounced on detached houses, where Oxford's £971,640 average is more than double England's £471,667.
| Property Type | Oxford Average | England Average | Difference |
|---|---|---|---|
| Detached houses | £971,640 | £471,667 | +£499,973 (+106.0%) |
| Semi-detached houses | £591,338 | £289,135 | +£302,203 (+104.5%) |
| Terraced houses | £470,254 | £244,830 | +£225,424 (+92.1%) |
| Flats and maisonettes | £295,228 | £219,340 | +£75,888 (+34.6%) |
| All property types | £480,531 | £291,865 | +£188,666 (+64.6%) |
Detached houses in Oxford cost £971,640 on average, a 106.0% premium over England's £471,667. Oxford's detached stock includes period properties in North Oxford and large family homes in the surrounding villages, pulling the average well above national levels.
Semi-detached houses carry a similar premium at 104.5% above England (£591,338 vs £289,135). These are concentrated in Headington (OX3), Summertown (OX2), and Cowley (OX4). The semi-detached market is where institutional rental demand from the universities intersects with family buyer competition.
Terraced houses at £470,254 sit 92.1% above England's £244,830. Oxford's terraced housing stock includes Victorian and Edwardian terraces in Jericho (OX2), East Oxford (OX4), and parts of the city centre (OX1). This is the property type most commonly converted to HMOs for the student and professional market.
Flats and maisonettes at £295,228 carry the smallest premium at 34.6% above England's £219,340. The gap narrows here because Oxford's flat stock competes with newer purpose-built developments elsewhere in the South East. At £295,228, flats offer the lowest absolute entry point into the Oxford sold-price market.
Property Data Sources
Our location guide relies on diverse, authoritative datasets including:
- HM Land Registry UK House Price Index
- Ministry of Housing, Communities and Local Government
- Ordnance Survey Data Hub
- Propertydata.co.uk
We update our property data quarterly to ensure accuracy. Last update: March 2026. All data is presented as provided by our sources without adjustments or amendments.
Price Per Square Foot in Oxford
Sold prices per square foot in Oxford range from £426 in OX44 (Stadhampton, Chalgrove) to £571 in OX2 (Summertown, Jericho). The spread of £145 per square foot between cheapest and most expensive is unusually tight for a city with a £249,000 gap in asking prices between its cheapest and most expensive postcodes. The rural postcodes (OX44 and OX5) deliver more space per pound, while the central and northern postcodes reflect the premium attached to proximity to the University of Oxford.
| Rank | Area | Price per sq ft |
|---|---|---|
| 1 | OX44 (Stadhampton, Chalgrove) | £426 |
| 2 | OX5 (Kidlington) | £427 |
| 3 | OX33 (Wheatley) | £458 |
| 4 | OX4 (Cowley, Blackbird Leys, Iffley) | £485 |
| 5 | OX3 (Headington, Marston) | £499 |
| 6 | OX1 (City Centre) | £533 |
| 7 | OX2 (Summertown, Jericho) | £571 |
OX44 (£426/sq ft) and OX5 (£427/sq ft) are virtually identical on this measure, despite a £106,000 gap in asking prices. OX44's larger rural properties bring down the per-square-foot cost. OX4 sits mid-table at £485/sq ft, which is notable given it also leads on yield and five-year growth. The data shows investors in OX4 pay a moderate price-per-square-foot premium over the rural postcodes but get significantly more rental income in return.
For Sale Asking Prices in Oxford
The gap between Oxford's cheapest and most expensive postcodes is £248,748. Asking prices range from £415,679 in OX4 (Cowley, Blackbird Leys, Iffley) to £664,427 in OX2 (Summertown, Jericho), with a mean of £518,350 across all seven postcodes. Five of the seven postcodes have asking prices above £440,000. Only OX4 and OX5 sit below this threshold, making them the two entry-level options in a market where the average house for sale costs more than half a million pounds.
| Rank | Area | Asking Price |
|---|---|---|
| 1 | OX4 (Cowley, Blackbird Leys, Iffley) | £415,679 |
| 2 | OX5 (Kidlington) | £440,705 |
| 3 | OX3 (Headington, Marston) | £468,545 |
| 4 | OX1 (City Centre) | £531,288 |
| 5 | OX44 (Stadhampton, Chalgrove) | £546,523 |
| 6 | OX33 (Wheatley) | £561,287 |
| 7 | OX2 (Summertown, Jericho) | £664,427 |
OX4 at £415,679 is the closest Oxford postcode to the South East regional average sold price of £378,800, sitting £36,879 above it. It is also the postcode that leads on yield (5.4%) and five-year growth (12.4%). The three rural and semi-rural postcodes (OX33, OX44, OX5) have asking prices between £440,705 and £561,287 but two of them (OX33 and OX44) lack rental data, making yield calculations impossible. For investors looking at below market value properties, Oxford's pricing structure means even discounted stock sits above most regional averages.

House Price Growth in Oxford
Which Oxford postcodes have grown, and which have lost value? OX4 (Cowley, Blackbird Leys, Iffley) leads with 12.4% growth over five years, while OX2 (Summertown, Jericho) has declined 4.1% over the same period. The pattern is consistent: the most affordable postcodes have grown, while the most expensive have stalled or fallen.
| Area | 1 Year | 3 Years | 5 Years |
|---|---|---|---|
| OX4 (Cowley, Blackbird Leys, Iffley) | +2.6% | +4.5% | +12.4% |
| OX3 (Headington, Marston) | +1.8% | -1.6% | +8.9% |
| OX1 (City Centre) | -8.9% | -8.8% | +7.5% |
| OX5 (Kidlington) | +0.3% | -3.2% | +6.0% |
| OX44 (Stadhampton, Chalgrove) | +8.8% | -4.0% | +1.5% |
| OX33 (Wheatley) | -7.1% | -8.7% | -0.7% |
| OX2 (Summertown, Jericho) | -7.6% | -4.2% | -4.1% |
Four postcodes show positive one-year growth, led by OX44 (+8.8%), OX4 (+2.6%), OX3 (+1.8%), and OX5 (+0.3%). OX44's +8.8% is based on just 7 sales per month and the small sample size can produce volatile readings. OX4 and OX3 are the two highest-volume postcodes with positive one-year growth. OX1 (City Centre) has fallen 8.9% in one year and 8.8% over three years, but its five-year figure remains positive at +7.5%, suggesting the recent decline follows a period of stronger performance.
OX2's negative five-year growth (-4.1%) is worth reading alongside its asking price of £664,427. The most expensive postcode in Oxford has seen prices contract across all three time periods. OX33 (-0.7% over five years) shows a similar pattern of stagnation. In both cases, low sales volumes (34 and 5 per month respectively) and high price points may limit the pool of active buyers.
Monthly Property Sales in Oxford
Oxford records around 130 property sales per month across its seven postcodes. OX2 (Summertown, Jericho) leads with 34 transactions per month, closely followed by OX4 (Cowley, Blackbird Leys, Iffley) at 33. Together these two postcodes account for more than half of all sales. OX2 also has the highest turnover rate at 19%, meaning nearly one in five properties changes hands within a year.
| Area | Sales per month | Turnover | Asking Price |
|---|---|---|---|
| OX2 (Summertown, Jericho) | 34 | 19% | £664,427 |
| OX4 (Cowley, Blackbird Leys, Iffley) | 33 | 12% | £415,679 |
| OX3 (Headington, Marston) | 20 | 9% | £468,545 |
| OX5 (Kidlington) | 17 | 12% | £440,705 |
| OX1 (City Centre) | 14 | 17% | £531,288 |
| OX44 (Stadhampton, Chalgrove) | 7 | 11% | £546,523 |
| OX33 (Wheatley) | 5 | 10% | £561,287 |
OX3 (Headington, Marston) has the lowest turnover at 9%, despite recording 20 sales per month. Low turnover in a high-volume area can indicate that owners hold properties for longer, which is typical in established residential neighbourhoods with a mix of owner-occupiers and long-term landlords. OX33 and OX44 at 5 and 7 sales per month respectively are low-volume markets where individual transactions can shift average prices significantly.
Property Data Sources
Our location guide relies on diverse, authoritative datasets including:
- HM Land Registry UK House Price Index
- Ministry of Housing, Communities and Local Government
- Ordnance Survey Data Hub
- Propertydata.co.uk
We update our property data quarterly to ensure accuracy. Last update: March 2026. All data is presented as provided by our sources without adjustments or amendments.

Oxford Rental Market Analysis
For investors weighing up whether rental property is a worthwhile investment in Oxford, the data below breaks down average monthly rents and gross rental yields across the city's postcodes.
Five of Oxford's seven postcodes have rental data. Monthly rents range from £1,495 in OX5 (Kidlington) to £1,912 in OX2 (Summertown, Jericho), and gross yields range from 3.5% to 5.4%. OX33 (Wheatley) and OX44 (Stadhampton, Chalgrove) do not have sufficient rental transaction data for reliable calculations. If you are looking to build a property portfolio in the South East, Oxford's combination of university-driven rental demand and constrained supply shapes the rental market data that follows.
Average Rent & Gross Rental Yields in Oxford
The highest rent in Oxford does not produce the highest yield. OX4 (Cowley, Blackbird Leys, Iffley) delivers the top gross yield at 5.4%, with an average monthly rent of £1,874 on an asking price of £415,679. OX2 commands the highest rent at £1,912 per month but its asking price of £664,427 compresses the yield down to 3.5%. OX4 is the only postcode where yield exceeds 5%.
| Area | Average Rent (pcm) | Asking Price | Gross Yield |
|---|---|---|---|
| OX4 (Cowley, Blackbird Leys, Iffley) | £1,874 | £415,679 | 5.4% |
| OX3 (Headington, Marston) | £1,757 | £468,545 | 4.5% |
| OX1 (City Centre) | £1,844 | £531,288 | 4.2% |
| OX5 (Kidlington) | £1,495 | £440,705 | 4.1% |
| OX2 (Summertown, Jericho) | £1,912 | £664,427 | 3.5% |
| OX33 (Wheatley) | Not enough data | £561,287 | Not enough data |
| OX44 (Stadhampton, Chalgrove) | Not enough data | £546,523 | Not enough data |
The £417 per month rent gap between OX5 (£1,495) and OX2 (£1,912) is significant, but the yield story inverts it. OX5's lower rent still produces a 4.1% yield because its asking price is £223,722 less than OX2. OX4 occupies a distinct position: it has the second-highest rent (£1,874) paired with the lowest asking price (£415,679), which is why it leads on yield by a clear margin. OX3 at 4.5% sits in second place with a balanced combination of moderate rent (£1,757) and mid-range pricing (£468,545).
Is Oxford Rent High?
The median gross weekly salary in Oxford is £832.50, which equates to £3,608 per month or £43,289 per year. This is above the South East regional median of £800.30 per week and the Great Britain median of £752.40 per week. Data from the Nomis Labour Market Profile (ASHE 2025).
Rents in Oxford consume between 41.4% and 53.0% of the local median gross monthly income across the five postcodes with rental data. Every postcode with data is above the 40% threshold. OX2 (Summertown, Jericho) at 53.0% has the highest ratio, reflecting its premium average rent of £1,912 per month.
| Rank | Area | Rent as % of Income |
|---|---|---|
| 1 | OX2 (Summertown, Jericho) | 53.0% |
| 2 | OX4 (Cowley, Blackbird Leys, Iffley) | 51.9% |
| 3 | OX1 (City Centre) | 51.1% |
| 4 | OX3 (Headington, Marston) | 48.7% |
| 5 | OX5 (Kidlington) | 41.4% |
| — | OX33 (Wheatley) | Not enough data |
| — | OX44 (Stadhampton, Chalgrove) | Not enough data |
OX4's rent-to-income ratio of 51.9% is high, but it reflects the composition of the tenant pool. Cowley, Blackbird Leys, and Iffley attract a mix of university staff, graduate students, and young professionals. Many tenants in this area earn above the local median, particularly those employed at the university hospitals and research facilities in nearby Headington. The median salary figure does not capture this subset. OX2 at 53.0% has the highest ratio, with premium rents of £1,912 per month absorbing more than half of the median gross monthly income.
Thinking of Buying?
We have off-market investment properties averaging 8%+ annual yield.
View Property DealsBuy-to-Let Considerations
Are House Prices High? Price-to-Earnings Ratios
Purchasing a property in Oxford requires between 9.6 and 15.3 times the median annual salary. This is based on the Nomis Labour Market Profile for Oxford showing the median gross annual income for Oxford residents is £43,289. Even Oxford's lowest ratio (OX4 at 9.6x) sits above the national benchmark of 7.5x (England average price of £291,865 divided by the Great Britain median salary of £39,125).
| Rank | Area | Price-to-Earnings Ratio |
|---|---|---|
| 1 | OX4 (Cowley, Blackbird Leys, Iffley) | 9.6x |
| 2 | OX5 (Kidlington) | 10.2x |
| 3 | OX3 (Headington, Marston) | 10.8x |
| 4 | OX1 (City Centre) | 12.3x |
| 5 | OX44 (Stadhampton, Chalgrove) | 12.6x |
| 6 | OX33 (Wheatley) | 13.0x |
| 7 | OX2 (Summertown, Jericho) | 15.3x |
OX4 at 9.6x is the only Oxford postcode below 10x earnings. OX2 at 15.3x is more than double the national benchmark of 7.5x and is among the highest price-to-earnings ratios of any postcode covered in our location guides. The three urban postcodes (OX3, OX4, OX5) all sit between 9.6x and 10.8x, forming a distinct affordability tier within Oxford. The gap between this tier and OX2 (15.3x) reflects the premium attached to North Oxford's period housing stock and proximity to the University of Oxford's core colleges.
Deposit Requirements in Oxford
A 30% deposit on the cheapest Oxford postcode (OX4) is £124,704, rising to £199,328 for OX2 (Summertown, Jericho). The £74,624 gap between the lowest and highest deposit captures the scale of the pricing spread across Oxford's postcodes. Deposit amounts below are calculated at 30% of the current average asking price. Additional purchase costs including stamp duty and other buy-to-let costs apply on top of these figures. For strategies on reducing upfront capital, see our guide to investment property with no deposit.
| Rank | Area | 30% Deposit Required |
|---|---|---|
| 1 | OX4 (Cowley, Blackbird Leys, Iffley) | £124,704 |
| 2 | OX5 (Kidlington) | £132,211 |
| 3 | OX3 (Headington, Marston) | £140,563 |
| 4 | OX1 (City Centre) | £159,386 |
| 5 | OX44 (Stadhampton, Chalgrove) | £163,957 |
| 6 | OX33 (Wheatley) | £168,386 |
| 7 | OX2 (Summertown, Jericho) | £199,328 |
The deposit difference between OX4 (£124,704) and OX3 (£140,563) is £15,859. For that additional outlay, investors move from a 5.4% yield to a 4.5% yield and from a 12.4% five-year growth rate to 8.9%. The numbers show OX4 delivers stronger returns on both metrics at a lower entry cost. OX5 at £132,211 sits between the two in terms of deposit but returns a lower yield (4.1%) and lower growth (6.0%).

What the Oxford Data Tells Buy-to-Let Investors
OX4 (Cowley, Blackbird Leys, Iffley) leads Oxford on yield (5.4%), five-year growth (12.4%), and affordability (£415,679 asking price, £124,704 deposit at 30%). It records 33 sales per month with a 12% turnover rate. The tenant base in Cowley and surrounding areas is drawn from Oxford University Hospitals, Oxford Brookes University, and the BMW Mini plant at Cowley. These are employers with stable workforces and consistent hiring cycles.
OX3 (Headington, Marston) is the second-strongest postcode on yield (4.5%) and five-year growth (8.9%), with a higher entry price of £468,545. Headington is home to the John Radcliffe Hospital and Oxford Brookes' main campus, anchoring demand from healthcare workers and students. OX1 (City Centre) at 4.2% yield and OX5 (Kidlington) at 4.1% both sit in a narrow band with moderate growth of 7.5% and 6.0% respectively.
OX2 (Summertown, Jericho) has negative five-year growth (-4.1%), the lowest yield (3.5%), and the highest asking price (£664,427). It also has the highest sales volume at 34 per month and a 19% turnover rate. OX33 and OX44 lack rental data entirely, and both record fewer than 7 sales per month. Without yield or rent data, these postcodes cannot be assessed on income metrics.
Oxford does not currently have a citywide selective licensing scheme for private landlords. Investors considering investment property in Oxford or looking for off-market properties in the South East can contact us for current stock near the city.
How Oxford Compares
Oxford's mean asking price of £518,350 is the highest of the five locations compared here, and £25,641 above Cambridge (£492,709). The comparison below shows how Oxford sits within its South East and East of England peer group across three key metrics.
| Location | Mean Asking Price | Mean Monthly Rent | Top Gross Yield |
|---|---|---|---|
| Swindon | £332,719 | £1,145 | 5.3% |
| Milton Keynes | £388,510 | £1,384 | 6.7% |
| Reading | £415,265 | £1,603 | 6.1% |
| Cambridge | £492,709 | £1,742 | 5.0% |
| Oxford | £518,350 | £1,776 | 5.4% |
Oxford commands the highest rents (£1,776 per month on average) but its top yield of 5.4% sits third in this group, behind Milton Keynes (6.7%) and Reading (6.1%). The gap between Oxford and Cambridge is instructive: both are world-class university cities with constrained housing supply. Oxford's asking prices are £25,641 higher, its rents are £34 higher per month, and its top yield is 0.4 percentage points higher. On a yield-per-pound basis, the two cities produce similar numbers despite Oxford's higher entry price.
Swindon at £332,719 is the most affordable option in this comparison. Milton Keynes leads on yield at 6.7% with a mean asking price of £388,510. Reading at £415,265 and 6.1% yield offers strong transport links into London. Cambridge at £492,709 is the closest comparable to Oxford's market profile. For the full list of locations we cover, see our guide to the best buy to let areas across the UK.
Frequently Asked Questions
What are the best areas of Oxford for buy-to-let investment?
OX4 (Cowley, Blackbird Leys, Iffley) leads Oxford on yield (5.4%), five-year growth (12.4%), and lowest asking price (£415,679). OX3 (Headington, Marston) sits second on yield at 4.5% with 8.9% five-year growth.
OX2 (Summertown, Jericho) has the highest rents at £1,912 per month but the lowest yield at 3.5% and negative five-year growth of -4.1%. OX33 (Wheatley) and OX44 (Stadhampton, Chalgrove) lack rental data, so yields cannot be calculated for those postcodes.
What are Oxford house prices in 2026?
The average sold price in Oxford is £480,531 as of December 2025, which is 64.6% above the England average of £291,865. Detached houses average £971,640, semi-detached houses £591,338, terraced houses £470,254, and flats £295,228.
Asking prices across the city's seven postcodes range from £415,679 (OX4) to £664,427 (OX2). Price-to-earnings ratios run from 9.6x to 15.3x, compared to the national benchmark of 7.5x.
How many houses are for sale in Oxford and what do they cost?
Oxford records around 130 property sales per month across its seven postcodes, with OX2 (34 sales/month) and OX4 (33 sales/month) the most active. Average asking prices range from £415,679 in OX4 to £664,427 in OX2, with a citywide mean of £518,350.
The lowest 30% deposit is £124,704 in OX4. For investors searching for renovation property for sale, Oxford's constrained supply and high land values mean renovation stock is limited and competitively priced.
Can I buy a flat to let in Oxford?
The average flat price in Oxford is £295,228, which is 34.6% above the England average of £219,340. A 30% deposit on a flat at this price is £88,568, making flats the lowest-cost entry point into the Oxford market by property type.
OX4 (Cowley, Blackbird Leys, Iffley) and OX1 (City Centre) have the highest concentrations of flatted stock. Flats attract demand from university staff, graduate students, and young professionals. For investors considering repossessed houses for sale, these occasionally appear in Oxford at prices below the area average.
How does Oxford compare to Cambridge for property investment?
Oxford's mean asking price is £518,350 compared to Cambridge's £492,709, a difference of £25,641. Oxford's mean monthly rent (£1,776) is slightly higher than Cambridge's (£1,742), and Oxford's top gross yield of 5.4% is 0.4 percentage points above Cambridge's 5.0%.
Both cities share similar characteristics: high entry prices, university-driven rental demand, limited land for new development, and price-to-earnings ratios well above the national average.
Is student accommodation a factor in the Oxford rental market?
Oxford has two universities with a combined student population of approximately 41,000. The University of Oxford provides college accommodation for a proportion of its undergraduates, but graduate students, postdoctoral researchers, and Oxford Brookes students create consistent demand for private rental accommodation.
OX3 (Headington, Marston), OX4 (Cowley, Blackbird Leys, Iffley), and OX1 (City Centre) are the postcodes closest to the main university buildings and teaching hospitals. Term-time void periods are a factor with student lets. Our guide to purpose-built student accommodation covers the wider student property market.