
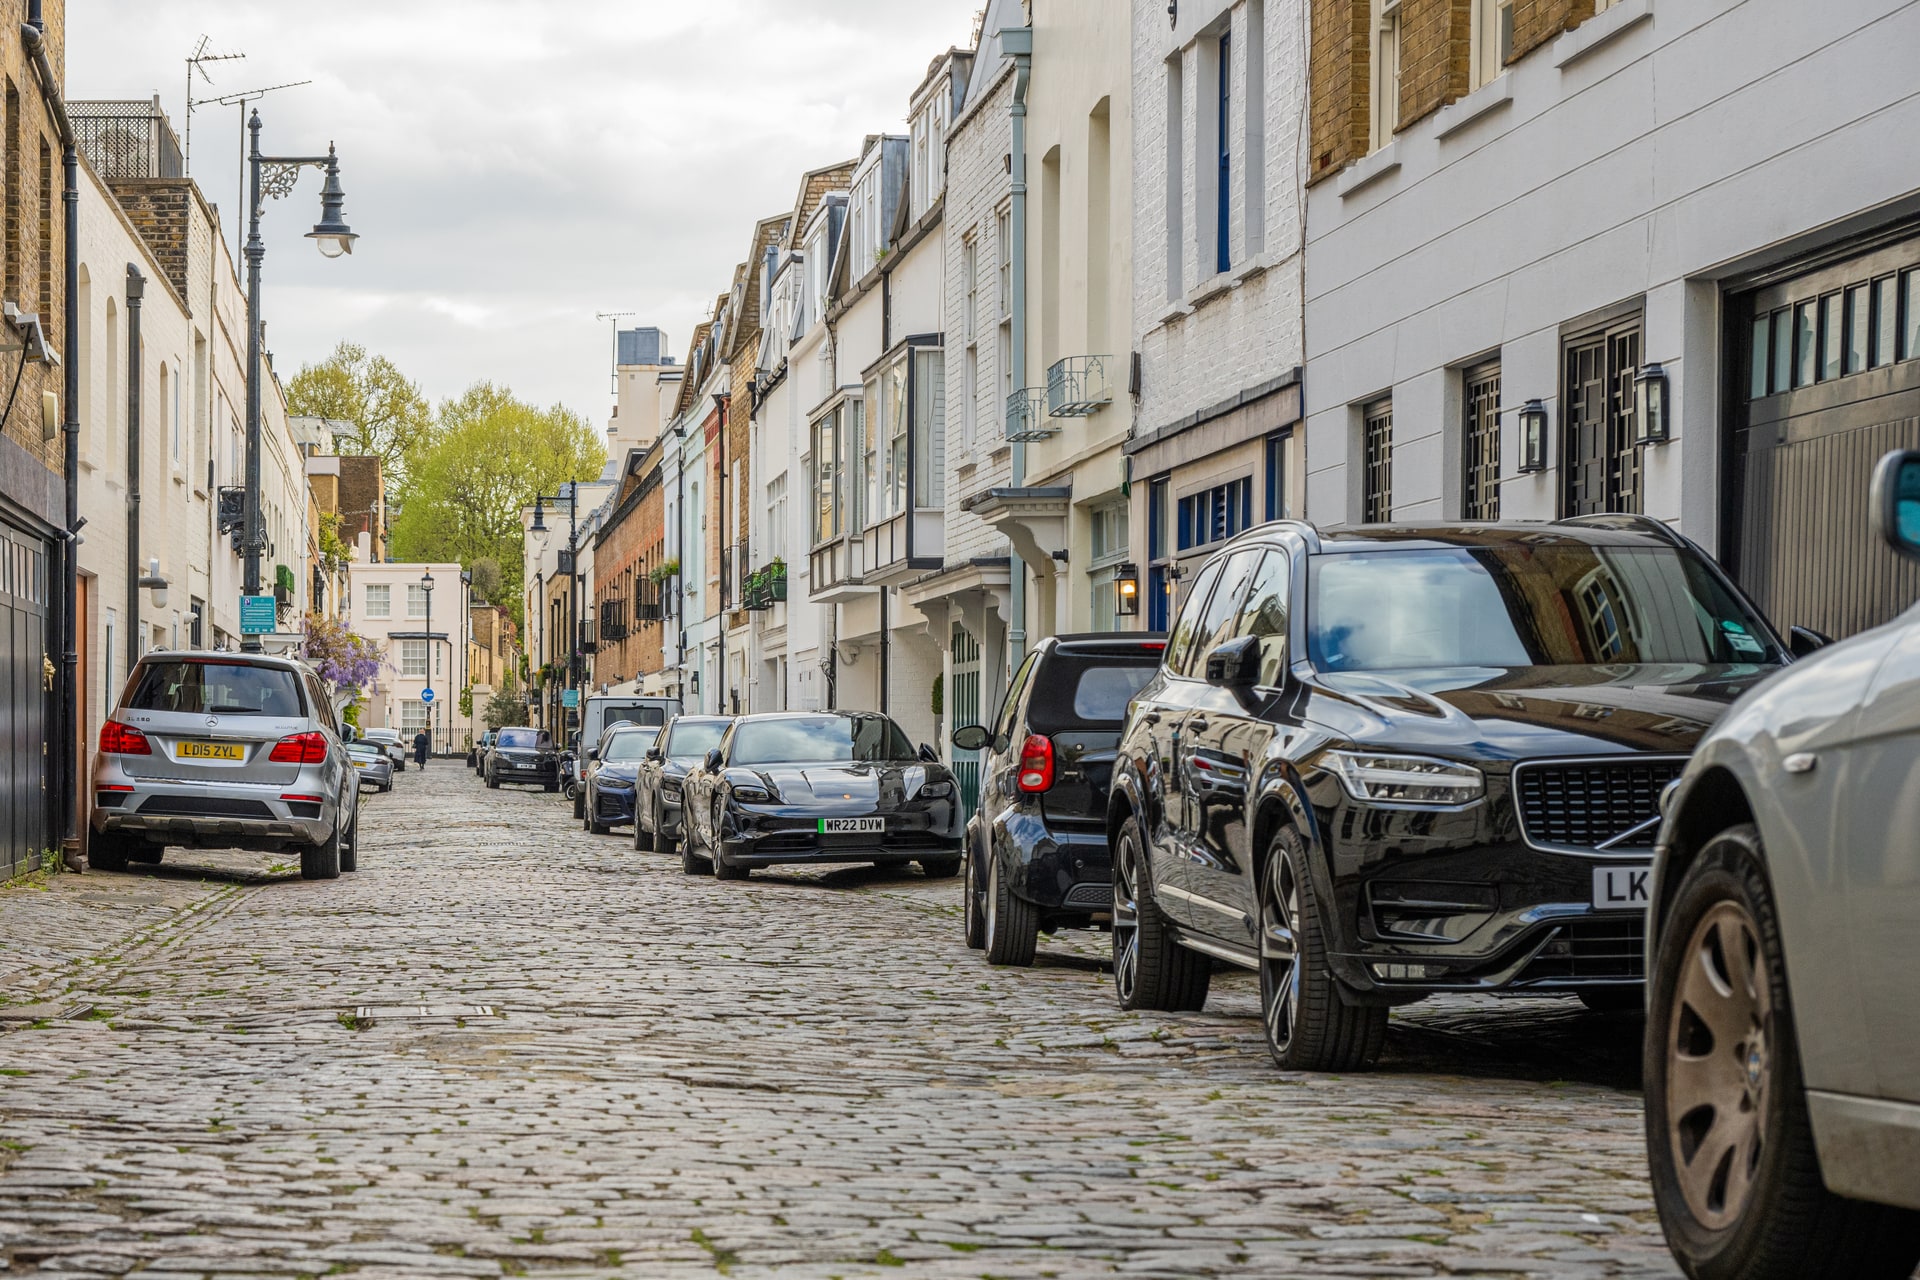
Most Expensive Streets in the UK: Sold-Price Top 100
The most expensive street on the sold-price record since 2020 is Grosvenor Place in Belgravia (SW1X), where twelve standard residential sales average £28,553,596 on HM Land Registry's England and Wales register of completed purchases. The record for a single home sits on the same street: £74,933,000, paid for a leasehold flat, the highest price among the 5,138,186 street-recorded sales analysed.
Every street in the top ten is a London street, and London holds 90 places in the full top 100 ranked below. Belgravia takes three of the top ten, Kensington and Holland Park three more, and the rest sit in Mayfair and in pockets of north and south London. The first street outside the capital appears at number 13, in Virginia Water in Surrey.
Article published: August 2026
The ranking below comes from HM Land Registry price paid data for England and Wales: 5,216,073 standard residential sales completed between January 2020 and June 2026. The 5,138,186 of those that carry a street name in the register were grouped street by street, with 559,128 streets recording the two or more qualifying sales needed to be ranked on average sold price. Every average in this article carries its sale count beside it, because a two-sale figure and a fifty-sale figure deserve different levels of trust. Scotland and Northern Ireland keep separate land registers, so their streets are not in this data. And if what you want from the capital is rents, yields and entry prices rather than trophy sold prices, our London buy-to-let guide covers that end of the market postcode by postcode.
Top 10 Most Expensive Streets in the UK
Date range: 1st January 2020 to 30th June 2026. Based on the latest Land Registry price paid data at the time of research. Standard residential sales only (Category A): detached, semi-detached and terraced houses plus flats and maisonettes, freehold or leasehold, across England and Wales.
| Rank & Street | Postcode | Average Price | Sales |
|---|---|---|---|
| 1. Grosvenor Place | SW1X | 12 | |
| 2. Danewood Drive | N2 | 2 | |
| 3. Upper Phillimore Gardens | W8 | 2 | |
| 4. Ilchester Place | W14 | 5 | |
| 5. Grosvenor Square | W1K | 57 | |
| 6. Lygon Place | SW1W | 3 | |
| 7. Cottesmore Gardens | W8 | 5 | |
| 8. Grosvenor Crescent | SW1X | 6 | |
| 9. Oak Lane | SW8 | 3 | |
| 10. Merton Lane | N6 | 2 |
Note: Streets needed at least two standard residential sales in the window to be ranked. 113,253 single-sale streets fell short of that threshold.
Grosvenor Place (SW1X)
Grosvenor Place tops the country on twelve sales, which is a lot of sales for a street at this level. The qualifying sales completed in just over a year, between October 2023 and November 2024, at prices from £8,100,000 to £74,933,000, six of them above £27 million. HM Land Registry classifies the qualifying transactions as leasehold flats or maisonettes; the street-level record does not establish that they are all in one building. What the numbers do establish is the gap to everything else: no other street with five or more qualifying sales averaged more than £18.4 million.
Danewood Drive (N2)
Second place is a two-sale street, and the average needs reading for what it is. Danewood Drive in north London recorded £23,500,000 in January 2020 and £29,250,000 in March 2022, and nothing since. Two sales at those levels are enough to rank the street here, but the £26.4 million average rests on exactly two transactions, so treat it as two data points rather than a going rate.
Upper Phillimore Gardens (W8)
The first of Kensington's two entries also qualifies on two sales, and they were very different transactions: £28,000,000 in October 2020, then £13,400,000 three months later. The £20.7 million average sits in the middle of a wide spread.
Ilchester Place (W14)
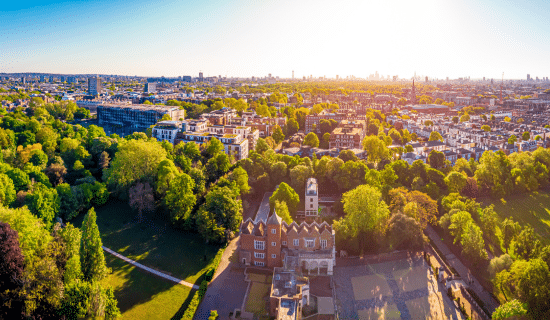
Ilchester Place recorded five sales between £14,021,000 and £25,000,000, giving its £18.4 million average more weight than the two-sale streets above it. Position accounts for a lot of that money: the street runs hard against Holland Park itself, and the Royal Borough of Kensington and Chelsea gives Ilchester Place as the 54-acre park's own address.
Grosvenor Square (W1K)
Mayfair's entry is the most heavily traded street in the table by a distance: 57 sales over the window. The spread is enormous, from £664,730 at the bottom to £53,360,000 at the top. Averaging £17.5 million across that much volume says more about a street's level than a two-sale average ever can, however much higher the two-sale figure sits.
The Most Expensive Home Sold in the UK: Highest Individual Sales
The highest individual price in the dataset is £74,933,000, paid in January 2024 on Grosvenor Place. It was not a mansion: the register records the sale as a leasehold flat or maisonette. That is the single most expensive standard residential purchase registered anywhere in England and Wales across the six and a half years analysed, more than £21 million clear of anything else in the table below. The table ranks the single highest sale on each of the ten ranked streets; a few single-sale streets elsewhere recorded higher prices than its lower rows, and they appear in the near-miss discussion further down.
Date range: 1st January 2020 to 30th June 2026. Based on the latest Land Registry price paid data at the time of research.
| Street | Postcode | Highest Sale | Month |
|---|---|---|---|
| 1. Grosvenor Place | SW1X | January 2024 | |
| 2. Grosvenor Square | W1K | August 2020 | |
| 3. Cottesmore Gardens | W8 | March 2024 | |
| 4. Danewood Drive | N2 | March 2022 | |
| 5. Upper Phillimore Gardens | W8 | October 2020 | |
| 6. Grosvenor Crescent | SW1X | October 2022 | |
| 7. Merton Lane | N6 | August 2025 | |
| 8. Ilchester Place | W14 | June 2021 | |
| 9. Lygon Place | SW1W | October 2024 | |
| 10. Oak Lane | SW8 | September 2023 |
Note: This table shows the single highest standard residential (Category A) sale on each of the ten ranked streets, ordered by price.
Grosvenor Square's £53,360,000 sale in August 2020 is the second highest in the table. Cottesmore Gardens follows at £30,000,000 in March 2024, the top of five register entries on the street that run all the way down to £3,618,888, a spread wide enough to show that even the grandest addresses trade across a huge range.
Merton Lane holds the most recent sale in the table. Its £25,900,000 transaction in August 2025 sits alongside a £6,150,000 sale from December 2021 as the street's only other qualifying trade. Oak Lane in SW8 qualified on three sales that completed within a month of each other in late summer 2023, two of them at an identical £15,525,000, recorded 22 days apart against two different apartments in the same building.
Some famous single sales sit outside the ranking entirely because their streets recorded only one qualifying transaction. Old Park Lane logged a single £23,800,000 sale in October 2024, the highest-priced street in our near-miss list. One sale is a data point, not an average, so it and streets like it sit outside the top ten.
The UK's Record Streets: Total Value of Property Sales
Average price is one lens. A record sale is another. The third is total money through the street: every qualifying sale added together. It rewards volume as well as price, and it surfaces a completely different kind of street.
| Street | Postcode | Total Value | Sales |
|---|---|---|---|
| 1. Grosvenor Square | W1K | 57 | |
| 2. Grosvenor Place | SW1X | 12 | |
| 3. Grosvenor Crescent | SW1X | 6 | |
| 4. Ilchester Place | W14 | 5 | |
| 5. Cottesmore Gardens | W8 | 5 | |
| 6. Danewood Drive | N2 | 2 | |
| 7. Lygon Place | SW1W | 3 | |
| 8. Oak Lane | SW8 | 3 | |
| 9. Upper Phillimore Gardens | W8 | 2 | |
| 10. Merton Lane | N6 | 2 |
Note: Totals are computed across the ten ranked streets in this article, not across every street in England and Wales. Together the ten recorded 97 sales worth £1,838,040,083 over the window.
Grosvenor Square passed a billion pounds of registered sales on 57 transactions, which on this table puts it a long way clear of every other street in the ranking. Fifty-seven sales averaging £17.5 million is a scale of money that no street with a handful of sales can match.
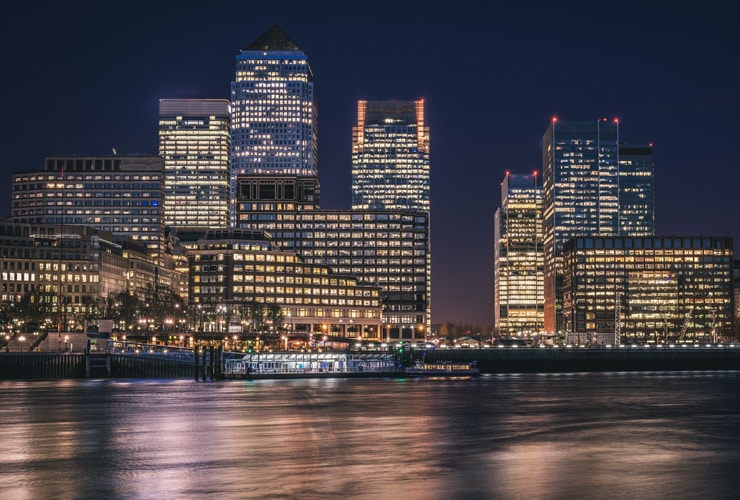
The street with the highest total transacted value anywhere in England and Wales is not in the top ten at all. Marsh Wall (E14), in the Canary Wharf area, recorded £1,311,555,188 across 1,620 sales. Sixteen hundred ordinary sales on one street add up to more money than any square in Belgravia or Mayfair.
Most people researching an investment property are working a long way below any figure in this section, in markets where the sums are measured in rental income rather than register records.
The Full Top 100: Most Expensive Streets in the UK
Ten streets make a headline; one hundred show the shape of the market. The ranking below extends the same method to the hundred most expensive streets in the England and Wales record: at least two standard residential sales, averaged, with the sale count beside every figure. Even at rank 100 the average is £7,542,864.
London holds 90 of the 100 places. The first street outside the capital appears at number 13: Waverley Drive in Virginia Water, averaging £13,937,500 over two sales. Nine of the ten non-London entries sit in Surrey: five in Virginia Water, three around Godalming and one near Farnham. The pattern is hard to miss: outside London, the record's most expensive streets are almost all in one county.
| Rank & Street | Town | Postcode | Average Price | Sales |
|---|---|---|---|---|
| 1. Grosvenor Place | London | SW1X | £28,553,596 | 12 |
| 2. Danewood Drive | London | N2 | £26,375,000 | 2 |
| 3. Upper Phillimore Gardens | London | W8 | £20,700,000 | 2 |
| 4. Ilchester Place | London | W14 | £18,384,200 | 5 |
| 5. Grosvenor Square | London | W1K | £17,548,775 | 57 |
| 6. Lygon Place | London | SW1W | £16,768,958 | 3 |
| 7. Cottesmore Gardens | London | W8 | £16,213,778 | 5 |
| 8. Grosvenor Crescent | London | SW1X | £16,185,000 | 6 |
| 9. Oak Lane | London | SW8 | £16,170,000 | 3 |
| 10. Merton Lane | London | N6 | £16,025,000 | 2 |
| 11. Ashburton Place | London | W1J | £15,435,150 | 5 |
| 12. Phillimore Gardens | London | W8 | £15,414,750 | 13 |
| 13. Waverley Drive | Virginia Water | GU25 | £13,937,500 | 2 |
| 14. Whistler Square | London | SW1W | £13,824,546 | 24 |
| 15. The Little Boltons | London | SW10 | £13,816,733 | 15 |
| 16. Glebe Place | London | SW3 | £13,739,333 | 15 |
| 17. Brook Street | London | W1K | £13,625,000 | 3 |
| 18. Chelsea Square | London | SW3 | £13,539,500 | 10 |
| 19. Cherry Tree Lane | Godalming | GU7 | £13,413,833 | 3 |
| 20. Peek Crescent | London | SW19 | £13,400,000 | 2 |
| 21. St Johns Wood Park | London | NW8 | £13,205,000 | 2 |
| 22. Albert Place | London | W8 | £13,083,333 | 3 |
| 23. Westbrook Hill, Elstead | Godalming | GU8 | £12,925,000 | 2 |
| 24. Holland Villas Road | London | W14 | £12,470,000 | 10 |
| 25. Kensington Road | London | W8 | £12,212,000 | 5 |
| 26. Yeomans Row | London | SW3 | £12,179,050 | 2 |
| 27. Mulberry Square | London | SW1W | £11,953,701 | 31 |
| 28. Wilton Crescent | London | SW1X | £11,765,000 | 6 |
| 29. Cannon Lane | London | NW3 | £11,712,500 | 2 |
| 30. South Street | London | W1K | £11,515,714 | 7 |
| 31. Campden Hill | London | W8 | £11,311,616 | 13 |
| 32. Gilston Road | London | SW10 | £11,247,778 | 9 |
| 33. Eyre Road | London | NW8 | £11,243,800 | 6 |
| 34. Addison Crescent | London | W14 | £11,173,961 | 6 |
| 35. Egerton Crescent | London | SW3 | £11,059,231 | 8 |
| 36. Carlyle Square | London | SW3 | £10,928,182 | 11 |
| 37. Mulberry Walk | London | SW3 | £10,737,500 | 6 |
| 38. Grosvenor Gardens Mews North | London | SW1W | £10,611,043 | 3 |
| 39. Gainsborough Gardens | London | NW3 | £10,512,500 | 4 |
| 40. Tregunter Road | London | SW10 | £10,491,250 | 12 |
| 41. Courtenay Avenue | London | N6 | £10,416,667 | 3 |
| 42. Pembridge Place | London | W2 | £10,292,000 | 5 |
| 43. The Vale, Chelsea | London | SW3 | £10,259,375 | 8 |
| 44. Culross Street | London | W1K | £10,225,833 | 3 |
| 45. Horse Guards Avenue | London | SW1A | £10,206,283 | 30 |
| 46. Manresa Road | London | SW3 | £9,897,000 | 5 |
| 47. Compton Avenue | London | N6 | £9,750,000 | 2 |
| 48. Ingram Avenue | London | NW11 | £9,649,000 | 5 |
| 49. West Drive | Virginia Water | GU25 | £9,637,901 | 5 |
| 50. Chesham Place | London | SW1X | £9,528,750 | 4 |
| 51. Victoria Road | London | W8 | £9,520,882 | 17 |
| 52. Spaniards Close | London | NW11 | £9,500,000 | 2 |
| 53. Harley Gardens | London | SW10 | £9,490,000 | 5 |
| 54. Lansdowne Crescent | London | W11 | £9,460,364 | 11 |
| 55. Winnington Close | London | N2 | £9,456,667 | 3 |
| 56. Park Square East | London | NW1 | £9,432,554 | 2 |
| 57. Chester Terrace | London | NW1 | £9,428,571 | 7 |
| 58. Meadow Road | Virginia Water | GU25 | £9,318,333 | 3 |
| 59. Bryanston Street | London | W1H | £9,281,846 | 13 |
| 60. North Drive | Virginia Water | GU25 | £9,275,000 | 2 |
| 61. Winnington Road | London | N2 | £9,179,118 | 17 |
| 62. Chelsea Park Gardens | London | SW3 | £9,085,722 | 15 |
| 63. Montpelier Street | London | SW7 | £9,075,000 | 2 |
| 64. Melina Place | London | NW8 | £9,066,667 | 3 |
| 65. Wadham Gardens | London | NW3 | £9,037,500 | 2 |
| 66. Acacia Road | London | NW8 | £9,030,303 | 13 |
| 67. Curzon Street | London | W1J | £9,015,994 | 24 |
| 68. Holland Park Road | London | W14 | £9,015,000 | 5 |
| 69. Walton Place | London | SW3 | £8,983,333 | 3 |
| 70. Stanhope Gate | London | W1K | £8,914,688 | 16 |
| 71. East Drive | Virginia Water | GU25 | £8,862,500 | 2 |
| 72. Pelham Crescent | London | SW7 | £8,820,000 | 5 |
| 73. Cavendish Avenue | London | NW8 | £8,817,857 | 7 |
| 74. Norfolk Road | London | NW8 | £8,747,222 | 9 |
| 75. Vicarage Gardens | London | W8 | £8,737,500 | 4 |
| 76. Essex Villas | London | W8 | £8,544,500 | 4 |
| 77. Rutland Gardens | London | SW7 | £8,450,000 | 3 |
| 78. Aubrey Road | London | W8 | £8,369,000 | 2 |
| 79. Pelham Place | London | SW7 | £8,339,167 | 6 |
| 80. Eldon Road | London | W8 | £8,263,889 | 9 |
| 81. Knightsbridge | London | SW1X | £8,245,902 | 36 |
| 82. Eccleston Mews | London | SW1X | £8,244,167 | 6 |
| 83. Portsmouth Road, Thursley | Godalming | GU8 | £8,000,000 | 2 |
| 84. Clement Road | London | SW19 | £7,979,000 | 3 |
| 85. Campden Hill Square | London | W8 | £7,934,792 | 15 |
| 86. Douro Place | London | W8 | £7,918,750 | 4 |
| 87. Dawson Place | London | W2 | £7,850,409 | 15 |
| 88. Chester Street | London | SW1X | £7,840,000 | 8 |
| 89. Park Place Villas | London | W2 | £7,833,333 | 3 |
| 90. Grosvenor Crescent Mews | London | SW1X | £7,806,063 | 5 |
| 91. Coleridge Square | London | SW10 | £7,775,000 | 2 |
| 92. Pembroke Villas | London | W8 | £7,766,702 | 3 |
| 93. Cowley Street | London | SW1P | £7,750,000 | 2 |
| 94. Frensham Lane, Churt | Farnham | GU10 | £7,735,000 | 3 |
| 95. Cork Street | London | W1S | £7,671,125 | 8 |
| 96. Circus Road North | London | SW11 | £7,618,018 | 5 |
| 97. Alexander Square | London | SW3 | £7,598,889 | 9 |
| 98. Dorothy Avenue, Thorne | Doncaster | DN8 | £7,591,750 | 4 |
| 99. Chesterfield Street | London | W1J | £7,558,333 | 3 |
| 100. Queens Grove | London | NW8 | £7,542,864 | 10 |
Note: Only streets with two or more standard residential sales in the window are ranked. The sale count beside each average matters more as the list deepens.
One entry shows exactly why. Dorothy Avenue in Thorne, Doncaster sits at number 98 on four sales: three between £265,000 and £330,000, and one register entry of £29,500,000 from May 2025. Nothing else on the street supports reading that figure as a going rate. It is what the register records, and the sale count beside the average is the warning to weigh it accordingly. Frensham Lane near Churt carries a similar shape at number 94, where a £20,000,000 entry sits between two sales at around £1.6 million. An average built on a handful of sales can be moved a long way by a single entry; the count shows when that risk applies.
The Top 100 Mapped
The interactive map will load as it approaches the viewport.
The geography is easier to see than to describe. The map below pins all 100 ranked streets; the gold markers are the top ten. Each pin sits at a full postcode where its street's qualifying sales were recorded, using the official coordinates for that postcode, so every marker is anchored to the transactions behind the ranking rather than to a guessed address. Central London carries almost all of them, the Surrey cluster sits to the south west, and one pin stands alone in Doncaster for the register entry discussed above.
Millionaires' Row: Britain's Richest Streets by Sold Price
Ask for the richest street in Britain and it depends on the measure. By average sold price it is Grosvenor Place. By single transaction it is Grosvenor Place again. By total money through the street it is Marsh Wall. What sold prices cannot tell you is who lives anywhere: a register shows where buyers paid most, not who lives there, and a famous address that rarely sells leaves almost no trace in it.
That last point matters for every millionaires' row of press legend. A street can be famous for its gates and driveways and still record one qualifying sale in six and a half years, which keeps it out of any average-based ranking. The near-miss list shows it plainly: The Boltons in SW10 and Campden Hill Place in W11 each recorded a single sale above £21 million in the window, one transaction short of qualifying.
Outside London, the money thins but does not disappear. No street or road beyond the capital averaged enough to reach the top ten, and where non-London streets do qualify they cluster hard in Surrey, as the full top 100 above shows. Some of the highest single prices outside the capital sit on streets that recorded nothing else: Ledwell Road in Great Tew logged one sale at £16,500,000, a data point rather than an average, so it cannot be ranked at all.
Inside the capital the geography is tight. Belgravia holds three of the ten streets, with the SW1X postcode carrying both Grosvenor Place and Grosvenor Crescent, and Kensington and Holland Park hold three more between W8 and W14. For the street-level story inside each city, see our research on the most expensive streets in London, the most expensive streets in Birmingham and Manchester's most expensive streets, with the same treatment for Leeds, Liverpool, Newcastle, Sheffield, Bristol, Northampton, Nottingham, Leicester, Coventry and Derby. Each is built on its own dated snapshot of the same register, so a city page's figures can differ from this national table.
Sold-price records have a practical use well below these price points too. What homes actually traded at is the benchmark investors compare asking prices against, and it is the same logic used when weighing below market value properties: a discount only means something against real transactions, not against a hopeful listing.
How to Find the Most Expensive Streets in the UK
Everything in this article comes from public data, and you can rebuild the whole exercise yourself. For a country-wide sweep the practical route is HM Land Registry's published yearly files rather than the search form:
- Go to the official Price Paid Data downloads page on GOV.UK and download the yearly files for the period you want to cover.
- Keep the standard property types: detached, semi-detached and terraced houses plus flats and maisonettes. Leave out the 'other' category, which covers property types outside the standard residential ones and can include commercial premises.
- Keep Category A (standard price paid) entries so bulk portfolio deals and other non-standard transactions do not distort street averages.
- Group the sales by street and postcode district, average the prices, and decide a minimum sale count. We used two, and showed the count beside every average.
- Rank the averages, then read the underlying sales for each street at the top before quoting any of them.
Note: Check for duplicate rows before averaging. The dataset can occasionally contain duplicate entries, and on a street with two or three sales a single duplicate is enough to move the average badly.
For a single town or postcode the Land Registry search form is the easier route: pick your postcodes, property types and dates, and download the results. A sold-price sweep tells you what buyers genuinely paid on a street rather than what sellers hoped for. And if the numbers you care about are rents against purchase price rather than register records, our buy to let property for sale listings work at the end of the market where the tenants are.
Frequently Asked Questions
What is the most expensive street in the UK?
Grosvenor Place in Belgravia (SW1X), on this data. Twelve standard residential sales between January 2020 and June 2026 average £28,553,596, the highest street average in England and Wales among streets with at least two qualifying sales. The same street also holds the highest individual sale in the dataset.
What is the most expensive house sold in the UK?
The highest registered price in this analysis is £74,933,000, paid in January 2024 for a property on Grosvenor Place (SW1X). The register records it as a leasehold flat or maisonette rather than a house, so the biggest registered purchase of the period was an apartment, not a mansion.
Where is Millionaires' Row in the UK?
The press applies the label to several streets, but on registered sold prices the strongest claim belongs to Belgravia: SW1X alone carries Grosvenor Place and Grosvenor Crescent in the top ten, with Lygon Place (SW1W) nearby. Streets famous for private gates often trade too rarely to appear in a sold-price ranking at all, so a millionaires' row by reputation and one by registered sales are not always the same street.
What is the most expensive area in the UK for property?
Measured by this street ranking, the concentration is clearest in two postcode districts: SW1X in Belgravia, with two of the top ten streets plus the record sale, and W8 in Kensington, also with two. Different measures give different answers, so any "most expensive area" claim is only as good as the measure named beside it.
Is the most expensive street in England different from the UK's?
On the sold-price record, no. Grosvenor Place leads England, and no Welsh street appears in the top ten or the fifty closest runners-up. Whether a street in Scotland or Northern Ireland would out-average it cannot be tested from this data, because their sales sit in separate registers and no single UK-wide sold-price record exists. Within the record that does exist, nothing comes close.
Does this data cover Scotland and Northern Ireland?
It cannot. HM Land Registry's price paid data covers England and Wales; property in Scotland and Northern Ireland is registered separately, with Scotland's record held by Registers of Scotland. This ranking is built from England and Wales sold-price records.
Why do asking-price lists name different streets?
Because they measure a different thing. An asking-price ranking reflects what sellers are currently hoping for on homes listed at that moment. A sold-price record reflects completed, registered purchases. Rankings also vary with the window of years covered, the minimum number of sales required, and which transaction categories count, so two careful pieces of research can name different streets without either being wrong. Registered data also fills in with a lag, meaning recent months gain sales for some time after the event.
Why isn't a street I expected in the top 10?
Usually one of three reasons. The street recorded fewer than two standard residential sales in the window, like Old Park Lane, whose single £23,800,000 sale in October 2024 cannot form an average. Its sales were recorded in a non-standard category, which we exclude to keep bulk and commercial deals out of home-price averages. Or its qualifying sales simply averaged below £16,025,000, the level set by the tenth street on the list.
Are these prices for residential properties only?
Yes. The analysis keeps detached, semi-detached and terraced houses plus flats and maisonettes, on freehold or leasehold estates, and only Category A standard price paid entries. The 'other' property type is excluded because it covers everything outside those standard residential types and can include commercial premises.
Does this property data include ALL sales?
It includes qualifying registered transactions rather than literally every sale: most residential sales in England and Wales are lodged for registration and recorded by HM Land Registry, and this analysis uses the standard residential subset. Contains HM Land Registry data © Crown copyright and database right 2021. This data is licensed under the Open Government Licence v3.0.
What period does this article cover?
Sales completed between 1 January 2020 and 30 June 2026, as published in HM Land Registry's price paid data at the time of research. The registry publishes monthly and holds records back to 1995, so the tables and analysis here should be read together as one dated snapshot of that record.
Can I access the full list of sold transactions for every street?
Yes. The HM Land Registry search form described in the method section above lets you pull every registered transaction for any street, postcode or town in England and Wales, and the yearly files on GOV.UK carry the complete national record if you want to run a country-wide analysis of your own.
Ready to buy property?
Browse investment properties with prices and gross yields shown for each opportunity.
Get property alerts