Where to Buy Property Investments in Eastbourne: Yields of 5.4%
Eastbourne's top postcode yields reach 5.4%, with average sold prices 13.7% below the England average at £251,894. The population grew 2.3% between the 2011 and 2021 Census to 101,686, and asking prices across the borough's five postcodes range from £269,308 in BN21 to £427,962 in BN20.
Monthly rents in Eastbourne range from £1,066 in BN21 (Town Centre) to £1,681 in BN24 (Pevensey, Stone Cross), with gross yields between 3.6% and 5.4%. That 1.8 percentage point spread across just five postcodes reflects a market split between the premium coastal properties of BN20 (Meads, Old Town) and the more affordable inland and suburban areas. For investors looking at buy-to-let property in the South East, Eastbourne's asking prices sit well below the regional average of £378,800.
Eastbourne is a seaside town in East Sussex, South East England. This guide covers the Eastbourne local authority area (ONS code E07000061) across five postcodes: BN20, BN21, BN22, BN23, and BN24. Neighbouring Hastings sits 17 miles east along the coast, while Brighton is 25 miles west. Both are covered in separate guides. Eastbourne falls within our South East property investment guides.
Article updated: March 2026
Eastbourne Buy-to-Let Market Overview 2026
Eastbourne is a South East coastal town where average sold prices sit 13.7% below the England average, with gross rental yields reaching 5.4% in two postcodes.
- Average sold price: £251,894 (13.7% below England's £291,865)
- Asking price range: £269,308 (BN21) to £427,962 (BN20)
- Rental yields: 3.6% (BN20) to 5.4% (BN23/BN24) across all 5 postcodes
- Rental income: Monthly rents from £1,066 (BN21) to £1,681 (BN24)
- Price per sq ft: House prices from £300/sq ft (BN21) to £375/sq ft (BN24)
- Market activity: Sales ranging from 15 per month (BN24) to 36 per month (BN23)
- Deposit requirements: 30% deposits range from £80,792 (BN21) to £128,388 (BN20)
- Affordability ratios: Property prices from 7.2 to 11.5 times Eastbourne's median annual salary of £37,236
Contents

-
by Robert Jones, Founder of Property Investments UK
With two decades in UK property, Rob has been investing in buy-to-let since 2005, and uses property data to develop tools for property market analysis.

Property Data Sources
Our location guide relies on diverse, authoritative datasets including:
- HM Land Registry UK House Price Index
- Ministry of Housing, Communities and Local Government
- Ordnance Survey Data Hub
- Propertydata.co.uk
We update our property data quarterly to ensure accuracy. Last update: March 2026. All data is presented as provided by our sources without adjustments or amendments.
Why Invest in Eastbourne?
Eastbourne's population reached 101,686 at the 2021 Census, a 2.3% increase from 99,412 in 2011. As a seaside town on the East Sussex coast, Eastbourne draws a mix of retirees, young professionals, and families. The town sits within commuting distance of Brighton and London (90 minutes by rail to London Victoria), which supports a broad tenant base beyond seasonal tourism.
The median gross weekly salary in Eastbourne is £716.10, which equates to £3,103 per month or £37,236 per year. This is below the South East regional median of £800.30 per week and the Great Britain median of £752.40 per week. The employment rate stands at 71.2%. Unemployment data for Eastbourne is suppressed by the ONS due to the small sample size for the local authority area.
Eastbourne's economy centres on healthcare, education, retail, and tourism. The Eastbourne District General Hospital is one of the largest employers, alongside local schools and the University of Brighton's Eastbourne campus. The town's position as a visitor destination generates demand for short-term and holiday lets alongside the traditional buy-to-let market.
Eastbourne Economic Summary
- Population: 101,686 (2021 Census). Growth of 2.3% from 2011.
- Median annual salary: £37,236 (local), £41,616 (South East), £39,125 (Great Britain)
- Employment rate: 71.2% (local), 80.3% (South East), 75.4% (Great Britain)
- Unemployment rate: Data suppressed (local), 3.0% (South East), 3.8% (Great Britain)
- Key employment sectors: Healthcare, education, retail, tourism and hospitality
Source: ONS Census 2021, Nomis Labour Market Profile (ASHE 2025, Employment Oct 2023-Sep 2024)
Regeneration and Investment in Eastbourne
Eastbourne has secured up to £20 million in government regeneration funding alongside private seafront development and town centre infrastructure works.
- Plan for Neighbourhoods (Confirmed, up to £20 million): Eastbourne is one of 75 areas selected by the UK Government to receive up to £20 million over 10 years through the Plan for Neighbourhoods programme. Funding covers community infrastructure, public space improvements, and capacity building across all nine wards. Details at GOV.UK Plan for Neighbourhoods prospectus.
- Claremont Hotel Seafront Redevelopment (Planning): The former Claremont Hotel site on Grand Parade is being redeveloped into luxury residential apartments, with first occupants expected in early 2028. The project replaces a fire-damaged seafront building that has been vacant since 2019. Updates at Bournefree.
- Town Centre Movement and Access Package (In progress): Phase 2 of the Eastbourne Town Centre improvement scheme is pedestrianising sections of Terminus Road, converting Bolton Road and Langney Road to two-way traffic, and adding trees, seating, and cycle parking. Work started September 2025 with completion expected spring 2026. Updates at East Sussex Highways.

Eastbourne Property Market Analysis
When was the last house price crash in Eastbourne?
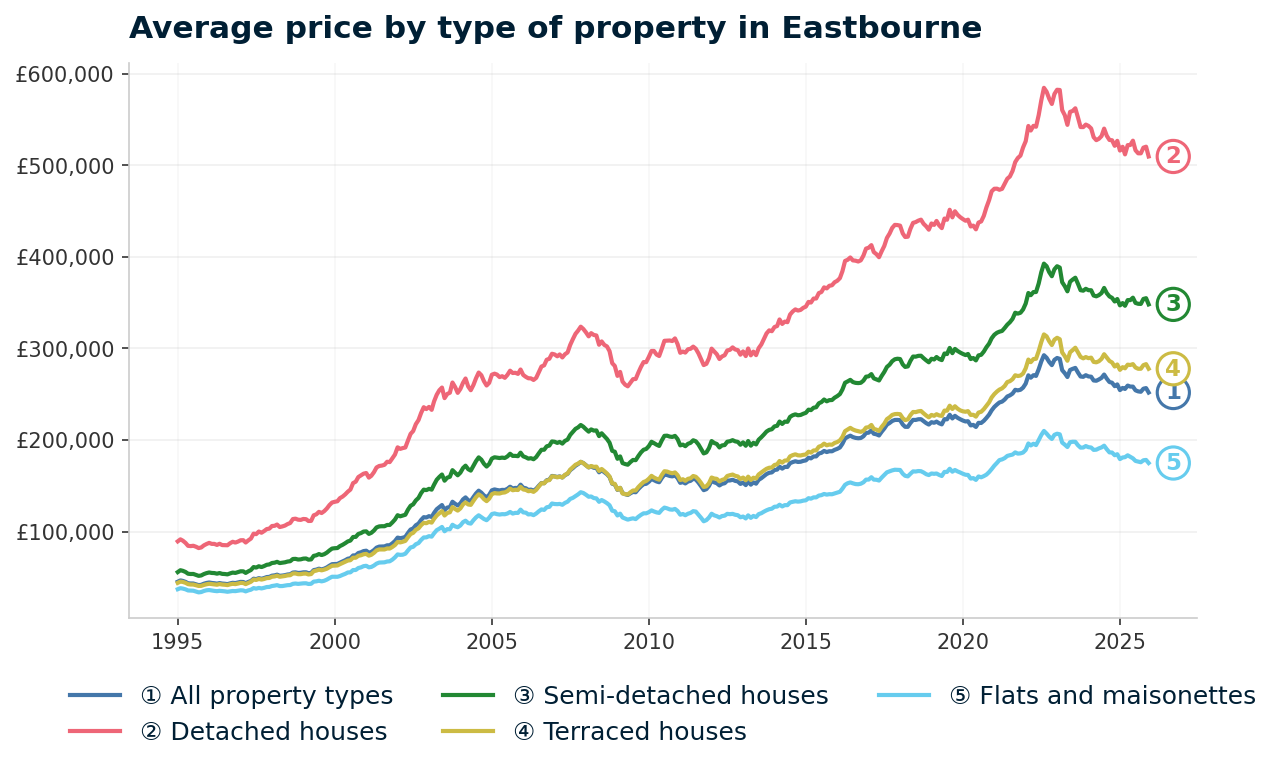
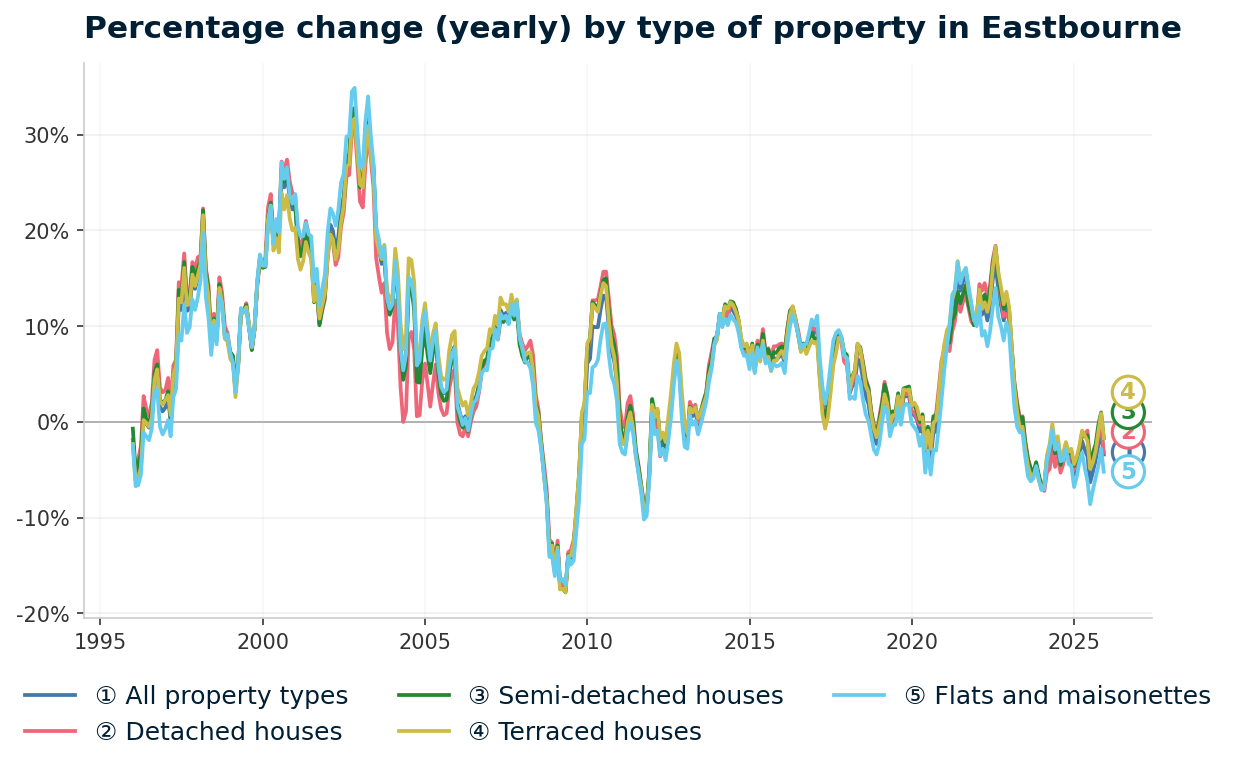
Eastbourne's average sold price stood at £251,894 in December 2025, which is 13.9% below the town's all-time peak of £292,660 reached in August 2022. The Land Registry UK House Price Index tracks Eastbourne at the local authority level, providing monthly sold price data from January 1995 to the present.
1995 to 2007 (The Boom): Eastbourne's average property price started at £45,231 in January 1995 and rose steadily over 12 years. By November 2007, prices had reached £176,134, a gain of 289.4% from the 1995 starting point. Seaside town demand, low interest rates, and the broader national boom drove growth across all property types.
2008 to 2009 (The Financial Crisis): Prices fell from the November 2007 peak of £176,134 to a trough of £139,999 in May 2009. That represents a 20.5% peak-to-trough decline. The worst annual change reading was -17.4% in May 2009, with semi-detached houses and terraced houses both recording -17.8% annual falls. Flats held slightly firmer at -17.0%. By comparison, England's peak-to-trough decline was 18.2% (from £183,883 in September 2007 to £150,438 in March 2009) and the South East fell 20.0% (from £240,647 in October 2007 to £192,598 in March 2009). Eastbourne's decline was slightly deeper than both benchmarks.
2010 to 2013 (Stagnation): Prices stabilised in a narrow range, trading between approximately £140,000 and £160,000. The post-crash floor was slow to lift in Eastbourne, with the town lagging behind faster-recovering parts of the South East closer to London.
2014 to 2016 (Recovery): By September 2014, Eastbourne's average price reached £176,794, exceeding the pre-crash peak for the first time. That recovery took 5 years and 4 months from the May 2009 trough. Prices continued climbing to £207,725 by December 2016.
2017 to 2019 (Pre-pandemic growth): Growth was steady but unspectacular. Prices rose from £207,725 to £222,734 over three years, reflecting the broader slowdown across the South East as London and the commuter belt plateaued ahead of Brexit uncertainty.
2020 to 2022 (Pandemic surge): The stamp duty holiday and the shift to remote working pushed coastal towns sharply higher. Eastbourne's average price jumped from £222,734 in December 2019 to a record £292,660 in August 2022. That £69,926 gain in under three years (31.4% growth) significantly outpaced the preceding decade.
2023 to present (Correction): Higher mortgage rates cooled the market. Prices have fallen steadily from the August 2022 peak, reaching £251,894 by December 2025. The annual change reading in December 2025 was -3.4%, with flats falling fastest at -5.2% and semi-detached and terraced houses holding firmest at -1.7%.
Eastbourne long-term price growth:
- 5 years (2020-2025): 8.4% growth (£232,443 to £251,894)
- 10 years (2015-2025): 33.1% growth (£189,249 to £251,894)
- 15 years (2010-2025): 59.0% growth (£158,453 to £251,894)
- 20 years (2005-2025): 66.6% growth (£151,242 to £251,894)
- 30 years (1995-2025): 474.4% growth (£43,852 to £251,894)
The current correction is notable. Eastbourne saw a larger percentage gain during the pandemic surge than many inland South East towns, and a correspondingly sharper pullback. For context, the 18-year property cycle places the current period in a correction phase following the mid-cycle peak of 2022. The December 2025 price of £251,894 sits 33.1% above where it was a decade ago but 13.9% below the pandemic high.
Source: HM Land Registry House Price Index for Eastbourne, January 1995 to December 2025.
Thinking of Buying?
We have off-market investment properties averaging 8%+ annual yield.
View Property DealsSold House Prices in Eastbourne
Eastbourne's average sold price of £251,894 is 13.7% below the England average of £291,865. That headline number masks a significant split by property type. Detached houses, semi-detached houses, and terraced houses in Eastbourne all sell above the England average. It is only flats and maisonettes that pull the overall figure down.
| Property Type | Eastbourne Average | England Average | Difference |
|---|---|---|---|
| Detached houses | £509,759 | £471,667 | +8.1% |
| Semi-detached houses | £348,177 | £289,135 | +20.4% |
| Terraced houses | £277,854 | £244,830 | +13.5% |
| Flats and maisonettes | £174,886 | £219,340 | -20.3% |
| All property types | £251,894 | £291,865 | -13.7% |
Semi-detached houses show the largest premium at +20.4% above the England average (£348,177 vs £289,135). Eastbourne has relatively limited semi-detached stock concentrated in the established residential areas of Hampden Park and Old Town. Scarcity of this housing type drives the premium.
Detached houses in Eastbourne average £509,759, sitting 8.1% above England's £471,667. The Meads and Old Town areas (BN20) contain the majority of detached homes, many with sea views commanding premium prices.
Terraced houses at £277,854 are 13.5% above England's £244,830. Victorian and Edwardian terraces across BN21 and BN22 reflect the South East's broader pricing dynamics, where terraced stock sits above the national level.
Flats and maisonettes tell the opposite story at £174,886, which is 20.3% below England's £219,340. Eastbourne has a large supply of converted flats, particularly along the seafront and in the town centre (BN21). Many are ex-hotel and ex-guesthouse conversions, and the volume of this stock depresses the average. For buy-to-let investors, flats represent the lowest entry point and the largest discount to the national benchmark.
Property Data Sources
Our location guide relies on diverse, authoritative datasets including:
- HM Land Registry UK House Price Index
- Ministry of Housing, Communities and Local Government
- Ordnance Survey Data Hub
- Propertydata.co.uk
We update our property data quarterly to ensure accuracy. Last update: March 2026. All data is presented as provided by our sources without adjustments or amendments.
Price Per Square Foot in Eastbourne
Which postcodes give you the most property for your money? Sold prices per square foot in Eastbourne range from £300 in BN21 (Town Centre) to £375 in BN24 (Pevensey, Stone Cross). That £75/sq ft gap reflects the difference between the town centre's older, converted flat stock and BN24's newer-build family housing.
| Rank | Area | Price per sq ft |
|---|---|---|
| 1 | BN21 (Town Centre) | £300 |
| 2 | BN22 (Hampden Park) | £325 |
| 3 | BN23 (Langney, Sovereign Harbour) | £339 |
| 4 | BN20 (Meads, Old Town) | £365 |
| 5 | BN24 (Pevensey, Stone Cross) | £375 |
BN24 tops the price per square foot ranking at £375 despite not being the most expensive postcode by asking price. This reflects BN24's housing mix. Pevensey and Stone Cross contain a higher proportion of newer-build houses, which command a premium per square foot compared to the older, larger properties found in BN20 (Meads). BN20 has a higher average asking price (£427,962) but its larger period properties spread that cost across more floor space, producing a lower price per square foot at £365.
BN21 at £300/sq ft is the cheapest area per square foot. The town centre's concentration of smaller, converted flats means buyers get more space for their money at the entry level. Read this alongside the rental yield data: BN21's low price per square foot feeds into its 4.8% yield.
For Sale Asking Prices in Eastbourne
Asking prices across Eastbourne's five postcodes range from £269,308 in BN21 (Town Centre) to £427,962 in BN20 (Meads, Old Town), with a mean asking price of £333,016. The £158,654 gap between the cheapest and most expensive postcode is substantial for a town of Eastbourne's size.
| Rank | Area | Asking Price |
|---|---|---|
| 1 | BN20 (Meads, Old Town) | £427,962 |
| 2 | BN24 (Pevensey, Stone Cross) | £371,759 |
| 3 | BN22 (Hampden Park) | £305,183 |
| 4 | BN23 (Langney, Sovereign Harbour) | £290,867 |
| 5 | BN21 (Town Centre) | £269,308 |
BN20 (Meads, Old Town) is the clear premium postcode at £427,962. Meads sits at the foot of Beachy Head and contains period homes with sea views. This is the lifestyle end of the Eastbourne market, where owner-occupier demand drives prices well above the rest of the borough.
The three middle postcodes cluster between £290,867 and £371,759. BN24 (Pevensey, Stone Cross) at £371,759 includes newer estates on Eastbourne's northern edge. BN22 (Hampden Park) at £305,183 and BN23 (Langney, Sovereign Harbour) at £290,867 offer the mid-market entry points. Sovereign Harbour, a marina development in BN23, adds a mix of modern apartments and townhouses that keeps that postcode's average below BN22 despite including premium waterside properties.
BN21 at £269,308 is the lowest asking price in Eastbourne. The town centre's older flat stock drives this figure down. For investors seeking below market value properties, BN21's combination of the lowest asking price, lowest price per square foot (£300), and 4.8% gross yield provides the cheapest entry into the Eastbourne market.

House Price Growth in Eastbourne
The short-term and long-term growth data tell different stories in Eastbourne. Four of five postcodes recorded negative 1-year price growth, with only BN24 (Pevensey, Stone Cross) showing a positive reading at +2.3%. Over five years, however, BN24 leads at +16.1%, followed by BN22 (Hampden Park) at +14.8%, while BN21 (Town Centre) shows the weakest growth at just +1.6%.
| Area | 1 Year | 3 Years | 5 Years |
|---|---|---|---|
| BN24 (Pevensey, Stone Cross) | +2.3% | -0.5% | +16.1% |
| BN22 (Hampden Park) | -0.6% | -7.6% | +14.8% |
| BN23 (Langney, Sovereign Harbour) | -4.5% | -9.1% | +6.0% |
| BN20 (Meads, Old Town) | -3.7% | -7.0% | +3.0% |
| BN21 (Town Centre) | -6.1% | -1.6% | +1.6% |
BN24 is the only postcode with positive growth across both the 1-year (+2.3%) and 5-year (+16.1%) timeframes. Pevensey and Stone Cross sit on Eastbourne's northern boundary, where new-build family housing has attracted buyers priced out of the coastal postcodes. That demand has kept prices rising even as the rest of the borough has corrected.
BN22 (Hampden Park) recorded the second-strongest 5-year growth at +14.8% despite a marginal 1-year decline of -0.6%. Hampden Park is a residential suburb with good schools access and a mainline rail station. The 5-year figure suggests the pandemic-era gains have largely held in this postcode.
BN21 shows the weakest profile: -6.1% over one year and just +1.6% over five years. The town centre's flat-heavy stock has been hit hardest by the post-pandemic correction, where older converted flats face the greatest headwinds from higher interest rates.
Monthly Property Sales in Eastbourne
How liquid is the Eastbourne market? A combined 130 property sales per month across five postcodes, with turnover rates ranging from 6% in BN20 to 16% in BN22. BN23 (Langney, Sovereign Harbour) is the busiest postcode at 36 sales per month.
| Area | Sales per Month | Turnover | Asking Price |
|---|---|---|---|
| BN23 (Langney, Sovereign Harbour) | 36 | 12% | £290,867 |
| BN22 (Hampden Park) | 32 | 16% | £305,183 |
| BN21 (Town Centre) | 29 | 7% | £269,308 |
| BN20 (Meads, Old Town) | 18 | 6% | £427,962 |
| BN24 (Pevensey, Stone Cross) | 15 | 8% | £371,759 |
BN22 (Hampden Park) has the highest turnover rate at 16%, meaning a significantly larger share of stock changes hands each year. High turnover typically signals an active market where properties move quickly. Combined with BN22's mid-range asking price of £305,183, this makes it one of the more liquid postcodes for investors who may need to exit a position.
BN20 (Meads, Old Town) and BN24 (Pevensey, Stone Cross) have the lowest sales volumes at 18 and 15 per month respectively. BN20's low turnover (6%) reflects the owner-occupier dominance in a premium postcode where residents tend to stay. BN24's lower volume (15 sales/month) is partly a function of it being a smaller postcode area with fewer total properties.
Property Data Sources
Our location guide relies on diverse, authoritative datasets including:
- HM Land Registry UK House Price Index
- Ministry of Housing, Communities and Local Government
- Ordnance Survey Data Hub
- Propertydata.co.uk
We update our property data quarterly to ensure accuracy. Last update: March 2026. All data is presented as provided by our sources without adjustments or amendments.

Eastbourne Rental Market Analysis
For investors weighing up whether rental property is a worthwhile investment in Eastbourne, the data below breaks down average monthly rents and gross rental yields across the town's postcodes.
All five Eastbourne postcodes have rental data, with monthly rents ranging from £1,066 to £1,681 and gross yields from 3.6% to 5.4%. If you are looking to build a property portfolio in the South East, Eastbourne's combination of sub-£300,000 entry prices and yields above 5% in two postcodes provides a different profile to the higher-priced markets further west.
Average Rent & Gross Rental Yields in Eastbourne
Gross rental yields in Eastbourne range from 3.6% in BN20 (Meads, Old Town) to 5.4% in both BN23 (Langney, Sovereign Harbour) and BN24 (Pevensey, Stone Cross). The two highest-yielding postcodes achieve the same percentage through different rent and price combinations.
| Area | Average Monthly Rent | Average Asking Price | Gross Yield |
|---|---|---|---|
| BN23 (Langney, Sovereign Harbour) | £1,320 | £290,867 | 5.4% |
| BN24 (Pevensey, Stone Cross) | £1,681 | £371,759 | 5.4% |
| BN21 (Town Centre) | £1,066 | £269,308 | 4.8% |
| BN22 (Hampden Park) | £1,079 | £305,183 | 4.2% |
| BN20 (Meads, Old Town) | £1,290 | £427,962 | 3.6% |
BN23 and BN24 both yield 5.4%, but the investment profiles differ. BN23 (Langney, Sovereign Harbour) achieves it with a lower asking price of £290,867 and rent of £1,320. BN24 (Pevensey, Stone Cross) commands a significantly higher rent of £1,681 on a higher price of £371,759. An investor in BN23 needs £87,260 at 30% deposit; an investor in BN24 needs £111,528. Same yield, £24,268 difference in capital required.
BN20 (Meads, Old Town) at 3.6% is the lowest-yielding postcode. Rents of £1,290 per month are competitive, but the high asking price of £427,962 compresses the yield. This is a postcode where capital growth has historically been the primary return, not rental income.
Is Eastbourne Rent High?
Average monthly rents in Eastbourne range from 34.4% to 54.2% of the local median gross monthly salary. The median gross weekly salary in Eastbourne is £716.10, which equates to £3,103 per month or £37,236 per year. This is below the South East regional median of £800.30 per week and the Great Britain median of £752.40 per week. Data from the Nomis Labour Market Profile (ASHE 2025).
| Rank | Area | Rent as % of Income |
|---|---|---|
| 1 | BN24 (Pevensey, Stone Cross) | 54.2% |
| 2 | BN23 (Langney, Sovereign Harbour) | 42.5% |
| 3 | BN20 (Meads, Old Town) | 41.6% |
| 4 | BN22 (Hampden Park) | 34.8% |
| 5 | BN21 (Town Centre) | 34.4% |
BN24 (Pevensey, Stone Cross) stands out at 54.2% of monthly income. This reflects BN24's higher average rents (£1,681/month) rather than lower incomes. The Pevensey and Stone Cross area includes larger family homes that command premium rents, pushing the affordability ratio well above the rest of Eastbourne. Tenants in this postcode are more likely to be dual-income households or commuters with higher-than-local earnings.
BN21 and BN22 at 34.4% and 34.8% respectively are the most affordable postcodes for tenants. Average rents of £1,066 (BN21) and £1,079 (BN22) against the local median salary produce ratios that sit below the commonly cited 35% affordability threshold. From a landlord perspective, affordable rent levels relative to income can support more consistent tenant demand and lower void periods.
Thinking of Buying?
We have off-market investment properties averaging 8%+ annual yield.
View Property DealsBuy-to-Let Considerations
Are House Prices High? Price-to-Earnings Ratios
Purchasing a property in Eastbourne requires between 7.2 and 11.5 times the median annual salary. This is based on the Nomis Labour Market Profile for Eastbourne showing the median gross annual income for Eastbourne residents is £37,236.
| Rank | Area | Price-to-Earnings Ratio |
|---|---|---|
| 1 | BN21 (Town Centre) | 7.2 |
| 2 | BN23 (Langney, Sovereign Harbour) | 7.8 |
| 3 | BN22 (Hampden Park) | 8.2 |
| 4 | BN24 (Pevensey, Stone Cross) | 10.0 |
| 5 | BN20 (Meads, Old Town) | 11.5 |
BN21 (Town Centre) at 7.2 times earnings is the most affordable postcode on this measure and sits below the England benchmark of 7.5. The national benchmark is calculated as England's average sold price of £291,865 divided by the Great Britain median annual salary of £39,125. Three Eastbourne postcodes (BN21, BN23, BN22) cluster between 7.2 and 8.2, while BN24 and BN20 sit well above at 10.0 and 11.5 respectively.
BN20's ratio of 11.5 is the highest in Eastbourne and reflects the premium pricing in Meads and Old Town. At this level, properties are priced for wealth rather than income. The buy-to-let calculation in BN20 depends on capital growth and lifestyle tenants rather than yield.
Deposit Requirements in Eastbourne
A 30% deposit on an Eastbourne property ranges from £80,792 in BN21 (Town Centre) to £128,388 in BN20 (Meads, Old Town). The £47,596 difference between the cheapest and most expensive deposit buys access to very different markets. Investors comparing stamp duty costs and buy-to-let costs across postcodes should note that three of the five areas require deposits under £100,000.
| Rank | Area | 30% Deposit Required |
|---|---|---|
| 1 | BN21 (Town Centre) | £80,792 |
| 2 | BN23 (Langney, Sovereign Harbour) | £87,260 |
| 3 | BN22 (Hampden Park) | £91,555 |
| 4 | BN24 (Pevensey, Stone Cross) | £111,528 |
| 5 | BN20 (Meads, Old Town) | £128,388 |
BN21's entry point of £80,792 is the lowest 30% deposit in Eastbourne. Combined with BN21's 4.8% gross yield, this is the most accessible starting point in the borough for a buy-to-let investment. The town centre location provides year-round tenant demand from workers and students at the University of Brighton's Eastbourne campus. Investors exploring lower capital routes can also check repossessed houses for sale or read about buy-to-let with no deposit strategies.
The gap between BN23 (£87,260) and BN24 (£111,528) is £24,268. Both postcodes yield 5.4%, so the question for investors is whether BN24's stronger growth profile (+2.3% over one year, +16.1% over five years) and higher monthly rent (£1,681 vs £1,320) justify the additional capital outlay.
What the Eastbourne Data Tells Buy-to-Let Investors
BN23 (Langney, Sovereign Harbour) and BN24 (Pevensey, Stone Cross) share the top gross yield at 5.4%. BN23 requires a 30% deposit of £87,260 on an asking price of £290,867, with monthly rent of £1,320 and the highest sales volume in Eastbourne at 36 per month. BN24 requires £111,528 on an asking price of £371,759, with £1,681 monthly rent and lower volume at 15 sales per month. Eastbourne's seaside location also creates potential for holiday let income alongside traditional tenancies.
BN24 is the only postcode in Eastbourne with positive 1-year price growth (+2.3%) and leads the 5-year growth table at +16.1%. The combination of top yield and growth makes BN24's data distinctive within the Eastbourne market. BN22 (Hampden Park) also shows strong 5-year growth at +14.8% alongside the highest turnover rate of 16%, though its yield of 4.2% sits below the two leaders.
BN21 (Town Centre) and BN20 (Meads, Old Town) show the weakest recent price performance. BN21 recorded -6.1% over one year and just +1.6% over five years. BN20 fell -3.7% over one year with +3.0% over five years. BN20's 3.6% yield is the lowest in Eastbourne. BN21 is a 29-sales-per-month market with a 4.8% yield and the lowest entry deposit at £80,792. The data profiles of these two postcodes differ significantly from BN23 and BN24.
Eastbourne is covered by the selective licensing scheme database. Investors considering investment property in Eastbourne should check the current licensing requirements with Eastbourne Borough Council, as schemes can apply to specific wards. Investors searching for off-market property in the South East may find opportunities in Eastbourne's correcting market.
How Eastbourne Compares
Eastbourne has the lowest mean asking price of these five South East locations at £333,016, and the second-highest top yield at 5.4%. The table below compares Eastbourne with four neighbouring markets across the South East and Kent.
| Location | Mean Asking Price | Mean Monthly Rent | Top Gross Yield |
|---|---|---|---|
| Eastbourne | £333,016 | £1,287 | 5.4% |
| Hastings | £366,342 | £1,142 | 4.9% |
| Crawley | £412,102 | £1,369 | 4.8% |
| Brighton | £420,745 | £1,825 | 6.6% |
| Maidstone | £477,473 | £1,539 | 5.3% |
Eastbourne's mean asking price of £333,016 is £33,326 below the next cheapest location, Hastings (£366,342). That 9.1% price gap comes with a higher top yield (5.4% vs 4.9%) and higher mean rent (£1,287 vs £1,142). The data shows Eastbourne delivering more rental income on a lower capital base than its closest coastal neighbour.
Brighton leads on both rent (£1,825/month) and top yield (6.6%), but the entry price of £420,745 is 26.3% higher than Eastbourne's. Brighton's university city demand and nightlife economy drive rental premiums that Eastbourne's market does not replicate. Crawley (£412,102) is similarly priced but geared towards Gatwick Airport workers, producing a different tenant profile entirely.
Maidstone at £477,473 has the highest asking price of the five and a top yield of 5.3%. Despite being 43.4% more expensive than Eastbourne, Maidstone's top yield is 0.1 percentage points below Eastbourne's. Investors comparing the best buy-to-let areas in the South East will find Eastbourne offering a lower entry price with a comparable top yield to Maidstone.
Full guides are available for Hastings, Crawley, Brighton, and Maidstone. Eastbourne also sits within the wider Sussex buy-to-let region.
Frequently Asked Questions
What are the main areas of Eastbourne for buy-to-let investors?
Eastbourne's five postcodes split into distinct investment profiles. BN20 (Meads, Old Town) is the premium coastal area with the highest asking prices at £427,962 and the lowest yield at 3.6%. BN21 (Town Centre) has the cheapest entry point at £269,308 with a 4.8% yield. BN22 (Hampden Park) is a residential suburb with the highest turnover at 16% and strong 5-year growth of +14.8%.
BN23 (Langney, Sovereign Harbour) includes the Sovereign Harbour marina development and shares the top yield at 5.4% with the highest sales volume (36/month). BN24 (Pevensey, Stone Cross) combines the joint-highest yield of 5.4% with the only positive 1-year growth reading (+2.3%).
How does Eastbourne compare to Hastings for property investment?
Eastbourne is cheaper and higher-yielding. Eastbourne's mean asking price (£333,016) is 9.1% below Hastings (£366,342), while Eastbourne's top yield (5.4%) is higher than Hastings (4.9%). Eastbourne's mean monthly rent (£1,287) also exceeds Hastings (£1,142). The two towns sit 17 miles apart on the East Sussex coast. Eastbourne's population (101,686) is larger than Hastings. Both are covered in separate guides.
What is the population of Eastbourne?
101,686 at the 2021 Census, up 2.3% from 99,412 in 2011. The town sits within East Sussex and has a median age that skews older than the national average, reflecting its popularity as a retirement destination. Population data from the ONS Census area changes for Eastbourne.
Is Eastbourne a good place for holiday let investment?
Eastbourne sits on the South Downs coast with Beachy Head, the seafront promenade, and the South Downs National Park drawing visitors year-round. The BN20 (Meads) and BN21 (Town Centre) postcodes are closest to the seafront and tourist amenities. BN20's asking price of £427,962 reflects owner-occupier and holiday demand. BN21's lower entry at £269,308 may suit investors targeting the holiday let market on a smaller budget. Holiday lets in seaside towns face seasonal demand variation, with peak months typically running from May to September.
Can I find buy-to-let property under £300,000 in Eastbourne?
Two postcodes average below £300,000. BN21 (Town Centre) at £269,308 and BN23 (Langney, Sovereign Harbour) at £290,867. BN21 is the lowest entry point with a 30% deposit of £80,792, while BN23 requires £87,260. Both postcodes have active markets with 29 and 36 monthly sales respectively. The Land Registry average sold price for Eastbourne overall is £251,894, and flats and maisonettes average £174,886, which is 20.3% below the England average for flats. Individual properties below the postcode average exist across all five postcodes.
What types of flats are available to rent in Eastbourne?
Eastbourne has a high concentration of flats and maisonettes, particularly in BN21 (Town Centre) and along the seafront. The Land Registry average price for flats in Eastbourne is £174,886, which is 20.3% below the England average of £219,340 for the same property type. BN21's average asking price of £269,308 reflects a market dominated by converted flats from former hotels and guesthouses, while BN23 (Sovereign Harbour) includes modern-build apartments in the marina development. For investors, flats represent the lowest entry point into the Eastbourne buy-to-let market.
Is there a property investment company in Eastbourne?
Several property investment companies operate across the South East with stock in the Eastbourne area. When dealing with any property investment company, check their track record, read reviews from past clients, and confirm that projected yields match the data in this guide. Eastbourne's top gross yield is 5.4% in BN23 and BN24. If a company quotes significantly higher yields, ask how they are calculated and whether they account for void periods, management fees, and maintenance. Our renovation property finder can help locate stock in the area.