Where to Buy Property Investments in High Wycombe: Yields of 5.2%
Gross rental yields in High Wycombe range from 3.1% to 5.2% across postcodes with rental data, with HP11 delivering the highest returns at an asking price of £311,281. High Wycombe is a large town in Buckinghamshire, 30 miles northwest of London with direct Chiltern Railways services to Marylebone in 25 to 35 minutes. Average sold prices in Buckinghamshire sit 67.1% above the England average, and the local authority's population grew 9.5% to 553,100 between the 2011 and 2021 censuses.
High Wycombe's mean asking price of £541,303 makes it one of the most expensive locations we cover, sitting well above Reading, Slough, and Milton Keynes. That positions it as a premium commuter market where yields are lower but capital values are backed by strong local earnings and London proximity. Rental data is available for 6 of the 8 postcodes, with HP15 and SL8 lacking sufficient current listings.
This guide covers all 8 postcodes across the High Wycombe area under the Buckinghamshire unitary authority. The postcodes span from HP10 (Wooburn Green) to SL8 (Bourne End), including the Chilterns market towns of Marlow and surrounding villages. Investors comparing options in the region may also consider Luton, Watford, or Hemel Hempstead.
Article updated: March 2026
High Wycombe Buy-to-Let Market Overview 2026
High Wycombe is a premium commuter town where strong earnings and London connectivity support property values well above the national and regional averages.
- Average sold price: £487,653 (67.1% above England's £291,865)
- Asking price range: £311,281 (HP11) to £803,643 (SL7)
- Rental yields: 3.1% (SL7) to 5.2% (HP11) across postcodes with rental data
- Rental income: Monthly rents from £1,232 (HP12) to £2,083 (SL7)
- Price per sq ft: Sold prices from £405/sq ft (HP12) to £595/sq ft (SL7)
- Market activity: Sales ranging from 10 per month (SL8) to 38 per month (HP13)
- Deposit requirements: 30% deposits range from £93,384 (HP11) to £241,093 (SL7)
- Affordability ratios: Property prices from 7.2 to 18.6 times Buckinghamshire's median annual salary of £43,290
Contents

-
by Robert Jones, Founder of Property Investments UK
With two decades in UK property, Rob has been investing in buy-to-let since 2005, and uses property data to develop tools for property market analysis.

Property Data Sources
Our location guide relies on diverse, authoritative datasets including:
- HM Land Registry UK House Price Index
- Ministry of Housing, Communities and Local Government
- Ordnance Survey Data Hub
- Propertydata.co.uk
We update our property data quarterly to ensure accuracy. Last update: March 2026. All data is presented as provided by our sources without adjustments or amendments.
Why Invest in High Wycombe?
High Wycombe sits 30 miles northwest of London in the Chiltern Hills, connected to Marylebone station by a 25 to 35 minute Chiltern Railways service. That commute time puts it in direct competition with Reading, Slough, and Watford for London workers who want more space for their money. The difference is what they get when they arrive. High Wycombe is surrounded by an Area of Outstanding Natural Beauty, with Chilterns villages like Marlow (SL7) and Bourne End (SL8) attracting buyers who could afford London but choose not to.
The local economy is broader than a typical commuter town. Buckinghamshire has a long history of furniture manufacturing, and while that industry has contracted, the commercial parks along the M40 corridor now house major employers including Johnson & Johnson, Intuitive Surgical, and Jacobs Engineering. RAF High Wycombe, headquarters of RAF Air Command, employs thousands directly and indirectly. Pinewood Studios sits 15 miles south.
Between the 2011 and 2021 censuses, Buckinghamshire's population grew from 505,300 to 553,100, a rise of 9.5%. That is above both the South East average of 7.5% and England's 6.6%. Population growth drives housing demand, and in a supply-constrained area like the Chilterns, where greenbelt and AONB restrictions limit new building, that demand translates into sustained price support.
Earnings in Buckinghamshire sit above both the regional and national averages. The median annual salary is £43,290, compared to £41,616 across the South East and £39,125 for Great Britain. Higher local wages mean tenants can support higher rents, and the price-to-earnings ratios in the affordable core postcodes remain manageable despite the premium price tag.
Buckinghamshire New University is based in High Wycombe with around 10,000 students, providing a secondary source of rental demand in the town centre postcodes.
High Wycombe Economic Summary
- Population: 553,100 (2021 Census). Growth of 9.5% from 2011.
- Median annual salary: £43,290 (Buckinghamshire), £41,616 (South East), £39,125 (Great Britain)
- Employment rate: 82.2% (Buckinghamshire), 79.3% (South East), 75.6% (Great Britain)
- Unemployment rate: 2.3% (Buckinghamshire), 3.3% (South East), 4.3% (Great Britain)
- Key employment sectors: Professional services, technology, aerospace and defence, healthcare, film and media, higher education
Source: ONS Census 2021, Nomis Labour Market Profile (ASHE 2025, Employment Oct 2024-Sep 2025)
Buckinghamshire's employment rate of 82.2% sits well above both the South East average of 79.3% and the national 75.6%. The unemployment rate of 2.3% is nearly half the national 4.3%. For buy-to-let investors, that combination of high employment and very low unemployment translates into a tenant pool with stable incomes and low arrears risk.
Regeneration and Investment in High Wycombe
High Wycombe's regeneration activity is concentrated in the town centre, where public funding and private development are reshaping the commercial core alongside a major greenfield housing scheme on the eastern fringe.
- High Wycombe Town Centre Regeneration (underway, £15m+): Buckinghamshire Council is investing over £15 million through the Future High Streets Fund and its own Estates Strategy to transform the town centre, including the White Hart Street area and new council offices due in spring 2027. Regeneration of this scale supports long-term rental demand in HP11 and HP13 by improving the town centre's appeal as a place to live and work. Updates at Buckinghamshire Council.
- Gomm Valley Development (approved, 544 homes): Taylor Wimpey secured planning permission in December 2025 for 544 homes on a 26-hectare greenfield site on High Wycombe's eastern edge, with construction expected to start in spring 2026. New housing supply on this scale adds to the buyer pool in HP13 and surrounding postcodes while employment during construction supports the local economy. Updates at UK Property Forums.
- Chilterns Shopping Centre Redevelopment (approved, 300+ apartments): Dandara Living received planning permission to demolish the existing shopping centre and build two 10-storey buildings containing over 300 build-to-rent apartments, designed by Aros Architects. Build-to-rent development at this scale in the town centre creates competition for private landlords in HP11, but also signals institutional confidence in High Wycombe's rental demand. Updates at Construction Enquirer.

High Wycombe Property Market Analysis
When Was the Last House Price Crash in High Wycombe?
Buckinghamshire property prices fell 19.6% during the 2008 financial crisis, dropping from £304,777 to £245,118 in 15 months, then took 5 years and 9 months to recover. All sold property prices from the HM Land Registry House Price Index are available at the Buckinghamshire level. The data runs from January 1995 to December 2025 and tracks one major crash, a prolonged recovery, and prices that have since reached record levels.
- 1995-2000 (Strong start): Buckinghamshire began 1995 at £86,586. Prices rose steadily through the late 1990s, reaching £142,295 by January 2000. Annual growth of 16.5% that year reflected the wider South East boom. Buckinghamshire's proximity to London and the Chilterns premium meant prices here started higher and grew faster than most of England.
- 2000-2007 (The boom): Prices more than doubled from £142,295 in January 2000 to a peak of £304,777 in December 2007. The sharpest growth came in 2002-2003, when annual changes exceeded 17%. Cheap credit and London salary inflation pushed Buckinghamshire values well beyond what local incomes alone could support.
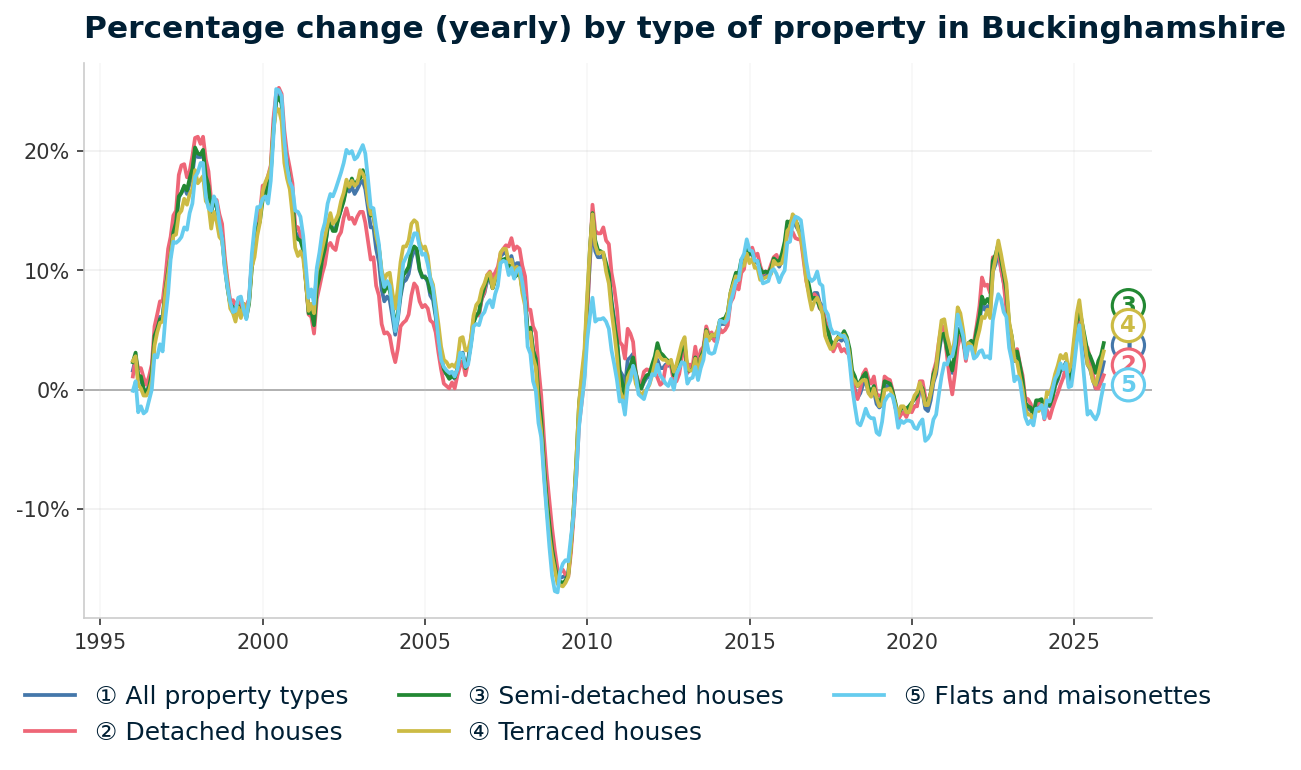
- 2007-2009 (The financial crisis): From the peak of £304,777 in December 2007 to the trough of £245,118 in March 2009, Buckinghamshire lost 19.6% of its value in 15 months. The worst annual change reading was -16.0% in February 2009. All property types fell hard: detached -15.7%, semi-detached -16.2%, terraced -16.5%, flats -17.0%. Buckinghamshire's decline of 19.6% was slightly worse than England's -18.2% but marginally better than the South East's -20.0%.
- 2009-2013 (Recovery): Buckinghamshire bounced back faster than most. By December 2009, prices had recovered to £269,568, a 10% rebound from the trough within nine months. But the recovery then slowed. Prices crossed £280,000 in 2010 and traded between £280,000 and £300,000 for the next three years. Prices finally passed the pre-crash peak in September 2013 at £306,101. That recovery took 5 years and 9 months from the December 2007 peak.
- 2014-2016 (Rapid growth): Growth accelerated sharply. Prices jumped from £306,101 in September 2013 to £405,891 by December 2016, a rise of 33% in just over three years. Annual growth hit 12.0% in 2014. Buckinghamshire benefited from the London price spillover as commuters priced out of the capital sought value along the Chiltern and Metropolitan lines.
- 2017-2019 (Plateau): Growth stalled and briefly turned negative. Prices drifted sideways between £400,000 and £415,000. By December 2019, the average was £410,384 with an annual change of -1.8%. Stamp duty changes and Brexit uncertainty dampened the market, particularly at the premium end where Buckinghamshire sits.
- 2020-2022 (Pandemic surge): The stamp duty holiday and the shift to remote working reignited the market. Prices jumped from £413,729 in March 2020 to £477,011 by December 2022. That is 15.3% growth in under three years. Buckinghamshire's combination of space, countryside, and commuter access made it a prime beneficiary of the lifestyle relocation trend.
- 2023 (Rate shock): Interest rate rises cooled the market. Prices dipped from £477,011 in December 2022 to £470,858 by December 2023. A decline of 1.3%. Brief and relatively mild, reflecting the underlying strength of demand in the area.
- 2024-2025 (Recovery): Prices stabilised and resumed growth. By December 2025, the average reached £487,653 with annual growth of 2.3%. Buckinghamshire now sits 60.0% above its pre-crash peak.
Long-Term Property Value Growth in Buckinghamshire
- 5 years (2020-2025): +13.7% (£428,809 to £487,653)
- 10 years (2015-2025): +29.3% (£377,117 to £487,653)
- 15 years (2010-2025): +73.6% (£280,982 to £487,653)
- 20 years (2005-2025): +93.0% (£252,605 to £487,653)
- 30 years (1995-2025): +452.3% (£88,300 to £487,653)
The 2008 crash is the reference point for Buckinghamshire investors assessing downside risk. A 19.6% decline took 5 years and 9 months to recover. Buckinghamshire's recovery was faster than England overall, where prices took until 2014 to surpass their pre-crash peak. The area's structural advantages are unchanged: London proximity, constrained supply from greenbelt and AONB designations, and above-average local earnings. Those fundamentals did not prevent a crash, but they shortened the recovery.
Source: HM Land Registry House Price Index for Buckinghamshire
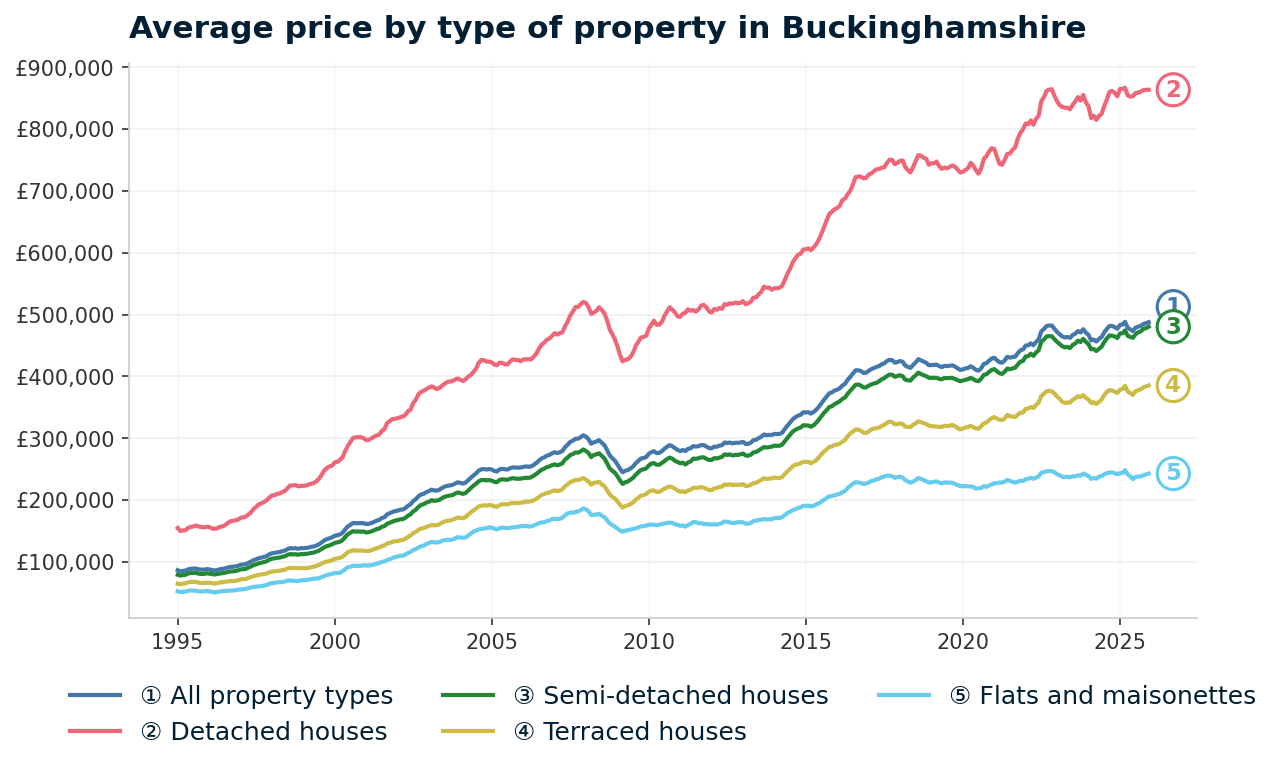
Source: HM Land Registry House Price Index for Buckinghamshire, January 1995 to December 2025.
Thinking of Buying?
We have off-market investment properties averaging 8%+ annual yield.
View Property DealsSold House Prices in High Wycombe
Buckinghamshire is a premium market. The headline sold price of £487,653 sits 67.1% above England's £291,865 and 28.7% above the South East's £378,800. Every property type trades above the national average, but the size of the premium varies dramatically depending on what you buy.
Detached houses in Buckinghamshire average £863,378, which is 83.0% above England's £471,667. That is the widest premium of any property type and reflects the concentration of large family homes in the Chilterns villages. SL7 (Marlow) and HP10 (Wooburn Green) are where these figures are driven from.
| Property Type | Buckinghamshire Average | England Average | Difference |
|---|---|---|---|
| Detached houses | £863,378 | £471,667 | +83.0% |
| Semi-detached houses | £480,283 | £289,135 | +66.1% |
| Terraced houses | £385,201 | £244,830 | +57.3% |
| Flats and maisonettes | £242,836 | £219,340 | +10.7% |
| All property types | £487,653 | £291,865 | +67.1% |
Semi-detached houses show a premium of 66.1% at £480,283. This is the core family housing stock in High Wycombe's HP11 and HP12 postcodes. Owner-occupier demand from commuters competes directly with buy-to-let investors, keeping prices firmly above the national average.
Terraced houses at £385,201 sit 57.3% above England. Victorian and Edwardian terraces in HP11, HP12, and HP13 form the backbone of the town's rental stock. Even at this premium to the national market, they remain the most accessible property type for investors targeting the High Wycombe area.
Flats show the narrowest premium at just 10.7% above England's £219,340. At £242,836, Buckinghamshire flats are the only property type that comes close to the national average. Flat stock in High Wycombe is concentrated in the town centre (HP11, HP13), and the limited premium reflects lower demand for apartment living in a market dominated by family houses and Chilterns village properties.
Property Data Sources
Our location guide relies on diverse, authoritative datasets including:
- HM Land Registry UK House Price Index
- Ministry of Housing, Communities and Local Government
- Ordnance Survey Data Hub
- Propertydata.co.uk
We update our property data quarterly to ensure accuracy. Last update: March 2026. All data is presented as provided by our sources without adjustments or amendments.
Price Per Square Foot in High Wycombe
Sold prices per square foot in High Wycombe range from £405 in HP12 to £595 in SL7, a spread of 47% across eight postcodes. Average asking prices alone can mislead because a postcode might look expensive simply because it has larger properties. Price per square foot strips out that size bias and shows what you are actually paying for space.
The two Buckinghamshire postcodes outside the HP prefix (SL7 Marlow and SL8 Bourne End) trade at a clear premium, reflecting their status as established Chilterns market towns with Thames Valley appeal.
| Rank | Area | Price Per Sq Ft |
|---|---|---|
| 1 | HP12 (High Wycombe, Sands) | £405 |
| 2 | HP13 (High Wycombe, Downley) | £422 |
| 3 | HP11 (High Wycombe) | £432 |
| 4 | HP14 (Stokenchurch, Lane End) | £469 |
| 5 | HP15 (Hazlemere, Holmer Green) | £481 |
| 6 | HP10 (Wooburn Green, Flackwell Heath) | £511 |
| 7 | SL8 (Bourne End) | £552 |
| 8 | SL7 (Marlow) | £595 |
Three postcodes cluster between £405 and £432 per square foot: HP12, HP13, and HP11. These are the core High Wycombe postcodes where town centre flats, terraced housing, and ex-council stock keep per-foot costs below £450. This is where buy-to-let activity is concentrated. HP11, the cheapest by asking price and the highest-yielding postcode, sits in the middle of this cluster at £432 per square foot.
SL7 Marlow at £595 per square foot is the most expensive space in the area. Marlow commands a premium driven by its Thames-side location, independent shopping, and established reputation. SL8 Bourne End at £552 per square foot follows a similar pattern. Both postcodes sit in a different price bracket from the HP core and attract a different buyer profile.
Figures reflect averages across all property types and ages. Individual values depend on condition, location within the postcode, and building age.
For Sale Asking Prices in High Wycombe
High Wycombe's asking prices range from £311,281 in HP11 to £803,643 in SL7, a 2.6x spread from cheapest to most expensive. Asking prices reflect what sellers and agents think the market will pay, not what buyers actually paid. In a premium market like High Wycombe, the gap between asking and sold prices can be significant, particularly at the upper end where Chilterns properties sit on the market longer.
Strip out the two SL postcodes and the HP range narrows to £311,281 to £623,355. Still wide, but the affordable core of HP11 to HP13 clusters between £311,000 and £375,000.
| Rank | Area | Average Asking Price |
|---|---|---|
| 1 | HP11 (High Wycombe) | £311,281 |
| 2 | HP12 (High Wycombe, Sands) | £332,934 |
| 3 | HP13 (High Wycombe, Downley) | £374,864 |
| 4 | HP14 (Stokenchurch, Lane End) | £574,689 |
| 5 | HP15 (Hazlemere, Holmer Green) | £591,477 |
| 6 | HP10 (Wooburn Green, Flackwell Heath) | £623,355 |
| 7 | SL8 (Bourne End) | £718,180 |
| 8 | SL7 (Marlow) | £803,643 |
The two-tier market is visible in the table. HP11, HP12, and HP13 sit between £311,000 and £375,000. Then a £200,000 gap separates them from HP14 at £574,689. The five postcodes above that line (HP14, HP15, HP10, SL8, SL7) are predominantly village and rural stock in the Chilterns, priced for owner-occupiers and lifestyle buyers rather than yield-seeking investors.
HP11 at £311,281 is the entry point for the area. HP11 and HP12 are the only postcodes under £350,000 and the only two where 30% deposits stay under £100,000. For investors looking at below market value properties or renovation projects in the South East, HP11 and HP12 represent the most accessible price points within the High Wycombe area.
The mean asking price across all eight postcodes is £541,303. That figure appears in the comparison section later, where High Wycombe is measured against Milton Keynes, Reading, Slough, and Oxford.

House Price Growth in High Wycombe
Five-year price growth across High Wycombe's postcodes ranges from 0.3% in HP11 to 23.4% in HP14, one of the widest spreads of any location we cover. That range reveals which postcodes benefited most from the pandemic boom and which have given back some of those gains.
HP11, the highest-yielding postcode, managed just 0.3% over five years. An investor who bought in HP14 five years ago would be sitting on a property now valued at £574,689. The same period in HP11 delivered almost no capital growth at all.
| Area | 1 Year | 3 Years | 5 Years |
|---|---|---|---|
| HP14 (Stokenchurch, Lane End) | 1.0% | -5.3% | 23.4% |
| HP13 (High Wycombe, Downley) | 1.6% | 7.0% | 17.0% |
| HP11 (High Wycombe) | 2.8% | 15.4% | 0.3% |
| HP15 (Hazlemere, Holmer Green) | 6.0% | 2.4% | 12.2% |
| SL7 (Marlow) | 0.7% | -0.3% | 11.3% |
| HP12 (High Wycombe, Sands) | -0.3% | 8.0% | 9.3% |
| HP10 (Wooburn Green, Flackwell Heath) | -10.0% | -3.2% | 9.2% |
| SL8 (Bourne End) | -0.5% | -10.4% | 4.0% |
HP14 shows an interesting pattern: strong five-year growth at 23.4% but negative three-year growth at -5.3%. That suggests prices surged early in the five-year window (likely during the pandemic stamp duty holiday) and have since corrected. The rural Chilterns postcodes were among the biggest pandemic beneficiaries as buyers sought space, and some of that premium has unwound as commuting patterns normalised.
HP11 at just 0.3% five-year growth is the outlier at the bottom. Three-year growth of 15.4% tells you the story. HP11 was already near fair value in 2021, dipped, and has since recovered sharply. The recent momentum is positive (2.8% one-year growth), but five years of near-flat performance means investors here have been relying on rental income, not capital appreciation.
HP10 at -10.0% one-year growth stands out. Wooburn Green and Flackwell Heath are the premium postcodes closest to Marlow, and the correction reflects the post-pandemic unwind hitting affluent areas hardest. Five-year growth of 9.2% remains positive, but recent buyers are sitting on paper losses.
Monthly Property Sales in High Wycombe
144 properties change hands each month across High Wycombe's eight postcodes, ranging from 10 in SL8 to 38 in HP13. Transaction volumes reveal which areas have the deepest buyer pools. For buy-to-let investors, this is an exit strategy question. High volume and turnover mean a liquid market where you can sell when you need to. Low volume means you may wait.
SL8 Bourne End's turnover rate of 40% is the highest in the area despite having the lowest volume of just 10 sales per month.
| Area | Sales Per Month | Turnover | Asking Price |
|---|---|---|---|
| HP13 (High Wycombe, Downley) | 38 | 15% | £374,864 |
| HP12 (High Wycombe, Sands) | 21 | 21% | £332,934 |
| HP11 (High Wycombe) | 18 | 20% | £311,281 |
| SL7 (Marlow) | 17 | 15% | £803,643 |
| HP10 (Wooburn Green, Flackwell Heath) | 15 | 8% | £623,355 |
| HP14 (Stokenchurch, Lane End) | 14 | 22% | £574,689 |
| HP15 (Hazlemere, Holmer Green) | 11 | 7% | £591,477 |
| SL8 (Bourne End) | 10 | 40% | £718,180 |
HP13 dominates on volume at 38 sales per month. This is the largest postcode by housing stock, covering Downley and parts of central High Wycombe. But the turnover rate of just 15% tells you that while there are plenty of transactions, the overall housing pool is much larger. Properties change hands slowly relative to the total stock. For investors, that means a deep market but not a fast-moving one.
HP10 and HP15 have the lowest turnover rates at 8% and 7% respectively. These are the established village postcodes where homeowners stay for decades. If you buy here, selling quickly may be difficult. HP11 and HP12 at 20-21% turnover offer a better balance of liquidity and price for investors focused on the core High Wycombe market.
Property Data Sources
Our location guide relies on diverse, authoritative datasets including:
- HM Land Registry UK House Price Index
- Ministry of Housing, Communities and Local Government
- Ordnance Survey Data Hub
- Propertydata.co.uk
We update our property data quarterly to ensure accuracy. Last update: March 2026. All data is presented as provided by our sources without adjustments or amendments.
High Wycombe Rental Market Analysis
For investors weighing up whether rental property is a worthwhile investment in High Wycombe, the data below breaks down average monthly rents and gross rental yields across the area's postcodes.
Rental data is available for 6 of 8 postcodes. HP15 (Hazlemere, Holmer Green) and SL8 (Bourne End) have insufficient current listings for reliable figures. For the six with data, monthly rents range from £1,232 in HP12 to £2,083 in SL7 and gross yields range from 3.1% to 5.2%. If you are looking to build a property portfolio in the South East, High Wycombe's core postcodes offer the highest yields in the immediate Buckinghamshire area.
Average Rent & Gross Rental Yields in High Wycombe
HP11 delivers High Wycombe's highest gross yield at 5.2%, where monthly rents of £1,346 meet asking prices of £311,281. Gross rental yield is calculated from the average asking price and average monthly rent for each postcode. It does not account for void periods, maintenance, management fees, or mortgage costs. It is a starting point for comparison, not a profit forecast.
At the other end, SL7 Marlow at 3.1% reflects asking prices of £803,643 absorbing high absolute rents of £2,083. The yield spread across High Wycombe's postcodes with data is 2.1 percentage points. That gap represents a fundamental choice between yield-driven and growth-driven investment strategies.
| Area | Average Monthly Rent | Average Asking Price | Gross Yield |
|---|---|---|---|
| HP11 (High Wycombe) | £1,346 | £311,281 | 5.2% |
| HP13 (High Wycombe, Downley) | £1,406 | £374,864 | 4.5% |
| HP12 (High Wycombe, Sands) | £1,232 | £332,934 | 4.4% |
| HP14 (Stokenchurch, Lane End) | £1,703 | £574,689 | 3.6% |
| HP10 (Wooburn Green, Flackwell Heath) | £1,682 | £623,355 | 3.2% |
| SL7 (Marlow) | £2,083 | £803,643 | 3.1% |
| HP15 (Hazlemere, Holmer Green) | Not enough data | £591,477 | Not enough data |
| SL8 (Bourne End) | Not enough data | £718,180 | Not enough data |
Three postcodes sit above 4% gross yield: HP11, HP13, and HP12. These are the core High Wycombe postcodes where the town's more affordable housing stock meets commuter and working-professional rental demand. HP11 at 5.2% is the only postcode that approaches the levels typically seen in northern cities. HP13 and HP12 at 4.5% and 4.4% are respectable for a South East commuter town.
The three premium postcodes (HP14, HP10, SL7) all sit at 3.6% or below. At these yield levels, the investment case shifts from rental income to capital growth and tenant quality. SL7 Marlow commands the highest absolute rent in the area at £2,083 per month, but £803,643 asking prices compress the yield to 3.1%. Investors in these postcodes are typically buying for long-term appreciation and the security of a premium tenant base.
Is High Wycombe Rent High?
Rent in High Wycombe ranges from 34.2% to 57.7% of the local median gross monthly salary across the six postcodes with data. For tenants, rent affordability determines whether they can sustain payments long-term. For landlords, areas where rent consumes a lower share of income tend to produce more reliable tenants and fewer arrears.
The median gross weekly salary in Buckinghamshire is £832.50, which equates to £3,608 per month or £43,290 per year. This is above the South East regional median of £800.30 per week and the Great Britain median of £752.40 per week. Data from the Nomis Labour Market Profile (ASHE 2025).
The general benchmark is that rent becomes stretched above 30% of gross income. All six postcodes sit above that level, which reflects the premium nature of the area rather than unusually high rents relative to property values.
| Rank | Area | Rent as % of Income |
|---|---|---|
| 1 | SL7 (Marlow) | 57.7% |
| 2 | HP14 (Stokenchurch, Lane End) | 47.2% |
| 3 | HP10 (Wooburn Green, Flackwell Heath) | 46.6% |
| 4 | HP13 (High Wycombe, Downley) | 39.0% |
| 5 | HP11 (High Wycombe) | 37.3% |
| 6 | HP12 (High Wycombe, Sands) | 34.2% |
| — | HP15 (Hazlemere, Holmer Green) | Not enough data |
| — | SL8 (Bourne End) | Not enough data |
SL7 Marlow at 57.7% is significantly stretched on paper. But Marlow tenants typically earn well above the Buckinghamshire median. London commuters, financial services professionals, and dual-income households are the tenant profile here. The median salary is a county-wide figure that understates what tenants in these postcodes actually earn.
HP12 at 34.2% is the most affordable postcode for tenants. Rents of £1,232 per month against the local median income make HP12 the least stretched area in the dataset. Lower affordability pressure means lower arrears risk, even though the headline yield (4.4%) is not the highest. HP11 at 37.3% sits just above, and the combination of the highest yield (5.2%) and manageable rent-to-income ratios makes it the area where rental income and tenant sustainability align most closely.
Thinking of Buying?
We have off-market investment properties averaging 8%+ annual yield.
View Property DealsBuy-to-Let Considerations
Are High Wycombe House Prices High? Price-to-Earnings Ratios
Only one of High Wycombe's eight postcodes sits below the national price-to-earnings benchmark of 7.5x. The price-to-earnings ratio compares a postcode's average asking price to the local median annual salary (£43,290 in Buckinghamshire). The national benchmark of 7.5x is calculated from England's average sold price of £291,865 against Great Britain's median annual salary of £39,125.
Purchasing a property in High Wycombe requires between 7.2 and 18.6 times the median annual salary. This is based on the Nomis Labour Market Profile for Buckinghamshire showing the median gross annual income for Buckinghamshire residents is £43,290.
Only HP11 at 7.2x sits below the national benchmark of 7.5x. HP12 at 7.7x is marginally above. Every other postcode exceeds 8x, with the Chilterns postcodes stretching to 16.6x (SL8) and 18.6x (SL7). This is a market where even the most affordable postcode is barely below the national benchmark.
| Rank | Area | Price-to-Earnings Ratio |
|---|---|---|
| 1 | HP11 (High Wycombe) | 7.2x |
| 2 | HP12 (High Wycombe, Sands) | 7.7x |
| 3 | HP13 (High Wycombe, Downley) | 8.7x |
| 4 | HP14 (Stokenchurch, Lane End) | 13.3x |
| 5 | HP15 (Hazlemere, Holmer Green) | 13.7x |
| 6 | HP10 (Wooburn Green, Flackwell Heath) | 14.4x |
| 7 | SL8 (Bourne End) | 16.6x |
| 8 | SL7 (Marlow) | 18.6x |
HP11 at 7.2x is the only postcode approaching affordability by national standards. It also delivers the highest yield at 5.2% and the lowest asking price at £311,281. For investors focused on the numbers, HP11 is where affordability and yield converge in a market that is otherwise stretched.
The Chilterns postcodes at 13x to 19x are completely detached from local incomes. SL7 Marlow at 18.6x and SL8 Bourne End at 16.6x are driven by London wealth, not Buckinghamshire earnings. Prices in these areas reflect lifestyle demand from buyers outside the local economy. The price-to-earnings ratio is largely irrelevant for understanding these markets, which run on commuter budgets and capital from London property sales.
Deposit Requirements in High Wycombe
A 30% deposit on the cheapest High Wycombe postcode (HP11) is £93,384, rising to £241,093 in SL7 Marlow. Most buy-to-let mortgage lenders require a minimum 25% deposit. The table below uses a more conservative 30% to reflect the rates and products available at higher loan-to-value ratios. A 30% deposit typically unlocks better interest rates, which matters for cash flow in a lower-yield market like High Wycombe.
Even the cheapest entry point is close to six figures at 30%, putting High Wycombe firmly in premium territory compared to northern and midlands markets.
| Rank | Area | 30% Deposit Required |
|---|---|---|
| 1 | HP11 (High Wycombe) | £93,384 |
| 2 | HP12 (High Wycombe, Sands) | £99,880 |
| 3 | HP13 (High Wycombe, Downley) | £112,459 |
| 4 | HP14 (Stokenchurch, Lane End) | £172,407 |
| 5 | HP15 (Hazlemere, Holmer Green) | £177,443 |
| 6 | HP10 (Wooburn Green, Flackwell Heath) | £187,006 |
| 7 | SL8 (Bourne End) | £215,454 |
| 8 | SL7 (Marlow) | £241,093 |
HP11 and HP12 are the only postcodes where 30% deposits stay under £100,000. At £93,384 and £99,880 respectively, they represent the realistic entry points for most individual investors. HP13 at £112,459 is the third option under £115,000. Beyond that, deposits jump sharply. HP14 at £172,407 requires nearly double the HP11 deposit for a postcode that yields 3.6% compared to HP11's 5.2%.
The gap between HP13 and HP14 is £59,948. That deposit gap marks the dividing line between the core High Wycombe market and the surrounding Chilterns villages. Investors with under £120,000 in capital are confined to three postcodes. Those with £170,000 or more gain access to the full range, but at yield levels that rarely exceed 3.6%.
Deposit is only part of the upfront cost. Budget for stamp duty (use our stamp duty calculator for an accurate figure), legal fees, and survey costs. For a full breakdown, see our guide to buy-to-let costs. Investors exploring lower-capital strategies may want to read about no-deposit investment property options.
What the High Wycombe Data Tells Buy-to-Let Investors
For yield, the data points to HP11 (5.2%), HP13 (4.5%), and HP12 (4.4%). All three sit between 7.2x and 8.7x price-to-earnings with 30% deposits between £93,384 and £112,459. HP11 delivers the highest yield, the lowest entry price, and the only price-to-earnings ratio below the national benchmark. HP13 combines the area's highest transaction volume (38 sales per month) with solid yield.
For growth, the data splits. HP14 leads five-year growth at 23.4% and HP13 follows at 17.0%. But HP14's three-year figure of -5.3% shows recent weakness. HP11's five-year growth of 0.3% is poor, though the three-year figure of 15.4% shows recent recovery. In this market, yield and growth do not converge in the same postcodes the way they do in some northern cities.
HP15, SL7, SL8, and HP10 have no rental data, yields below 3.6%, or negative recent price growth. HP10 recorded -10.0% one-year growth. SL8 shows -10.4% over three years. SL7 Marlow at 3.1% yield and £241,093 deposit operates in a different market segment. These postcodes sit in the Chilterns lifestyle bracket where property prices are driven by London wealth and owner-occupier demand, not rental economics.
High Wycombe falls within Buckinghamshire Council's jurisdiction. Investors considering investment property in the area, or exploring off-market property opportunities, can check licensing requirements directly with the council.
How High Wycombe Buy-to-Let Compares to Nearby Areas
High Wycombe's mean asking price of £541,303 is the highest in this group, £153,000 above Milton Keynes and £23,000 above Oxford. Investors looking at High Wycombe are typically also considering other commuter towns within an hour of London. The table below compares High Wycombe against four nearby locations using the same methodology: mean asking price across all postcodes, mean monthly rent across postcodes with data, and top single-postcode gross yield.
| Location | Mean Asking Price | Mean Monthly Rent | Top Gross Yield |
|---|---|---|---|
| Milton Keynes | £388,510 | £1,384 | 6.7% |
| Reading | £415,265 | £1,603 | 6.1% |
| Slough | £421,952 | £1,544 | 4.9% |
| Oxford | £518,350 | £1,776 | 5.4% |
| High Wycombe | £541,303 | £1,575 | 5.2% |
High Wycombe is the most expensive entry point in this group by mean asking price. At £541,303, it costs £23,000 more than Oxford and £153,000 more than Milton Keynes. That elevated mean is dragged up by the Chilterns postcodes (SL7 at £803,643, SL8 at £718,180). The core HP11-HP13 range of £311,000 to £375,000 is cheaper than every postcode mean in this table.
Reading and Milton Keynes offer higher top yields (6.1% and 6.7%) with lower mean asking prices. Milton Keynes in particular provides a 1.5 percentage point yield advantage with entry prices £153,000 lower. Slough at £421,952 mean asking price and 4.9% top yield is the closest match to High Wycombe's core postcodes on both price and returns.
High Wycombe's premium reflects the Chilterns location and the associated lifestyle value that does not show up in yield calculations. For investors comparing across the South East's best buy-to-let areas, the HP11-HP13 core competes on yield with any commuter town in this group. The wider postcode area does not.
Frequently Asked Questions
How does High Wycombe compare to Reading for buy-to-let?
Reading offers lower entry costs and higher top yields. Reading's mean asking price is £415,265 compared to High Wycombe's £541,303, and its top yield reaches 6.1% against High Wycombe's 5.2%. Reading also has more postcodes with rental data and higher mean monthly rents (£1,603 vs £1,575). High Wycombe's core postcodes (HP11 at £311,281 and HP12 at £332,934) are cheaper than Reading's mean, but the wider High Wycombe area includes Chilterns villages that push the overall average well above Reading. Both locations are covered in the comparison table above.
Are there property investment companies operating in High Wycombe?
Yes, several firms market buy-to-let property in the Buckinghamshire area. These tend to focus on new-build developments and off-plan stock. The data in this guide covers the open market. Any property sold through an investment company can be benchmarked against these figures, but it does not guarantee a market value as these are average values.
Which postcodes have the strongest rental data in High Wycombe?
HP11 leads on yield at 5.2%, HP13 leads on liquidity at 38 sales per month, and HP12 offers the lowest price per square foot at £405. HP11 (High Wycombe town centre) has monthly rents of £1,346 against an asking price of £311,281. HP13 (Downley) follows at 4.5% yield. HP12 (Sands) at 4.4% yield has the lowest rents (£1,232) but the highest space value in the area. HP15 and SL8 do not have sufficient rental listings for reliable figures.
Can I find buy-to-let property in High Wycombe under £350,000?
Three postcodes (HP11, HP12, HP13) have average asking prices below £375,000, and individual properties list well below those averages. Buckinghamshire's average flat price of £242,836 from the Land Registry confirms that sub-£250,000 stock exists. Repossessed properties occasionally appear below these averages. At a purchase price of £250,000, a 30% deposit is £75,000. Condition, lease length, service charges, and building age all need checking at the lower end of this market.
Is High Wycombe a good commuter town for London?
High Wycombe is 25 to 35 minutes from London Marylebone by Chiltern Railways, with trains roughly every 10 to 15 minutes during peak hours. The M40 motorway passes through the area, connecting to the M25 and central London. That connectivity is reflected in property prices. Buckinghamshire's average sold price of £487,653 is 67.1% above the England average and 28.7% above the South East average. The commuter premium is priced in, but it also supports long-term capital values and tenant demand from London workers.