Average sold prices across Kingston upon Thames sit at £571,088 on the HM Land Registry House Price Index, 97.0% above the England average of £289,946, the price of a riverside south-west London borough that has kept its ground. Where most of inner and central London corrected after 2020, Kingston reached an all-time high of £617,017 in September 2022 and has since eased only 7.4% to £571,088, leaving it a touch higher over five years rather than lower. The gap between its cheapest postcode and its dearest tells the local story: KT9 in Chessington at a £487,076 asking price sits a long way below KT2 in Norbiton at £746,221, two different markets inside one borough. The local population grew 5.0% between the 2011 and 2021 censuses, from 160,060 to 168,063 residents.
What separates Kingston from the boroughs nearer the centre is the steadiness of its recent price history. The five-year sold-price reading is positive at 7.4% growth, where most of inner London is flat or down, and the income return sits behind it rather than in front: top gross yields reach 4.2% in KT1 and KT6, while the dearer Norbiton and New Malden postcodes yield closer to 3.4%. For an investor that frames the borough as a hold-and-let market with a long capital-growth record rather than a high-yield one.
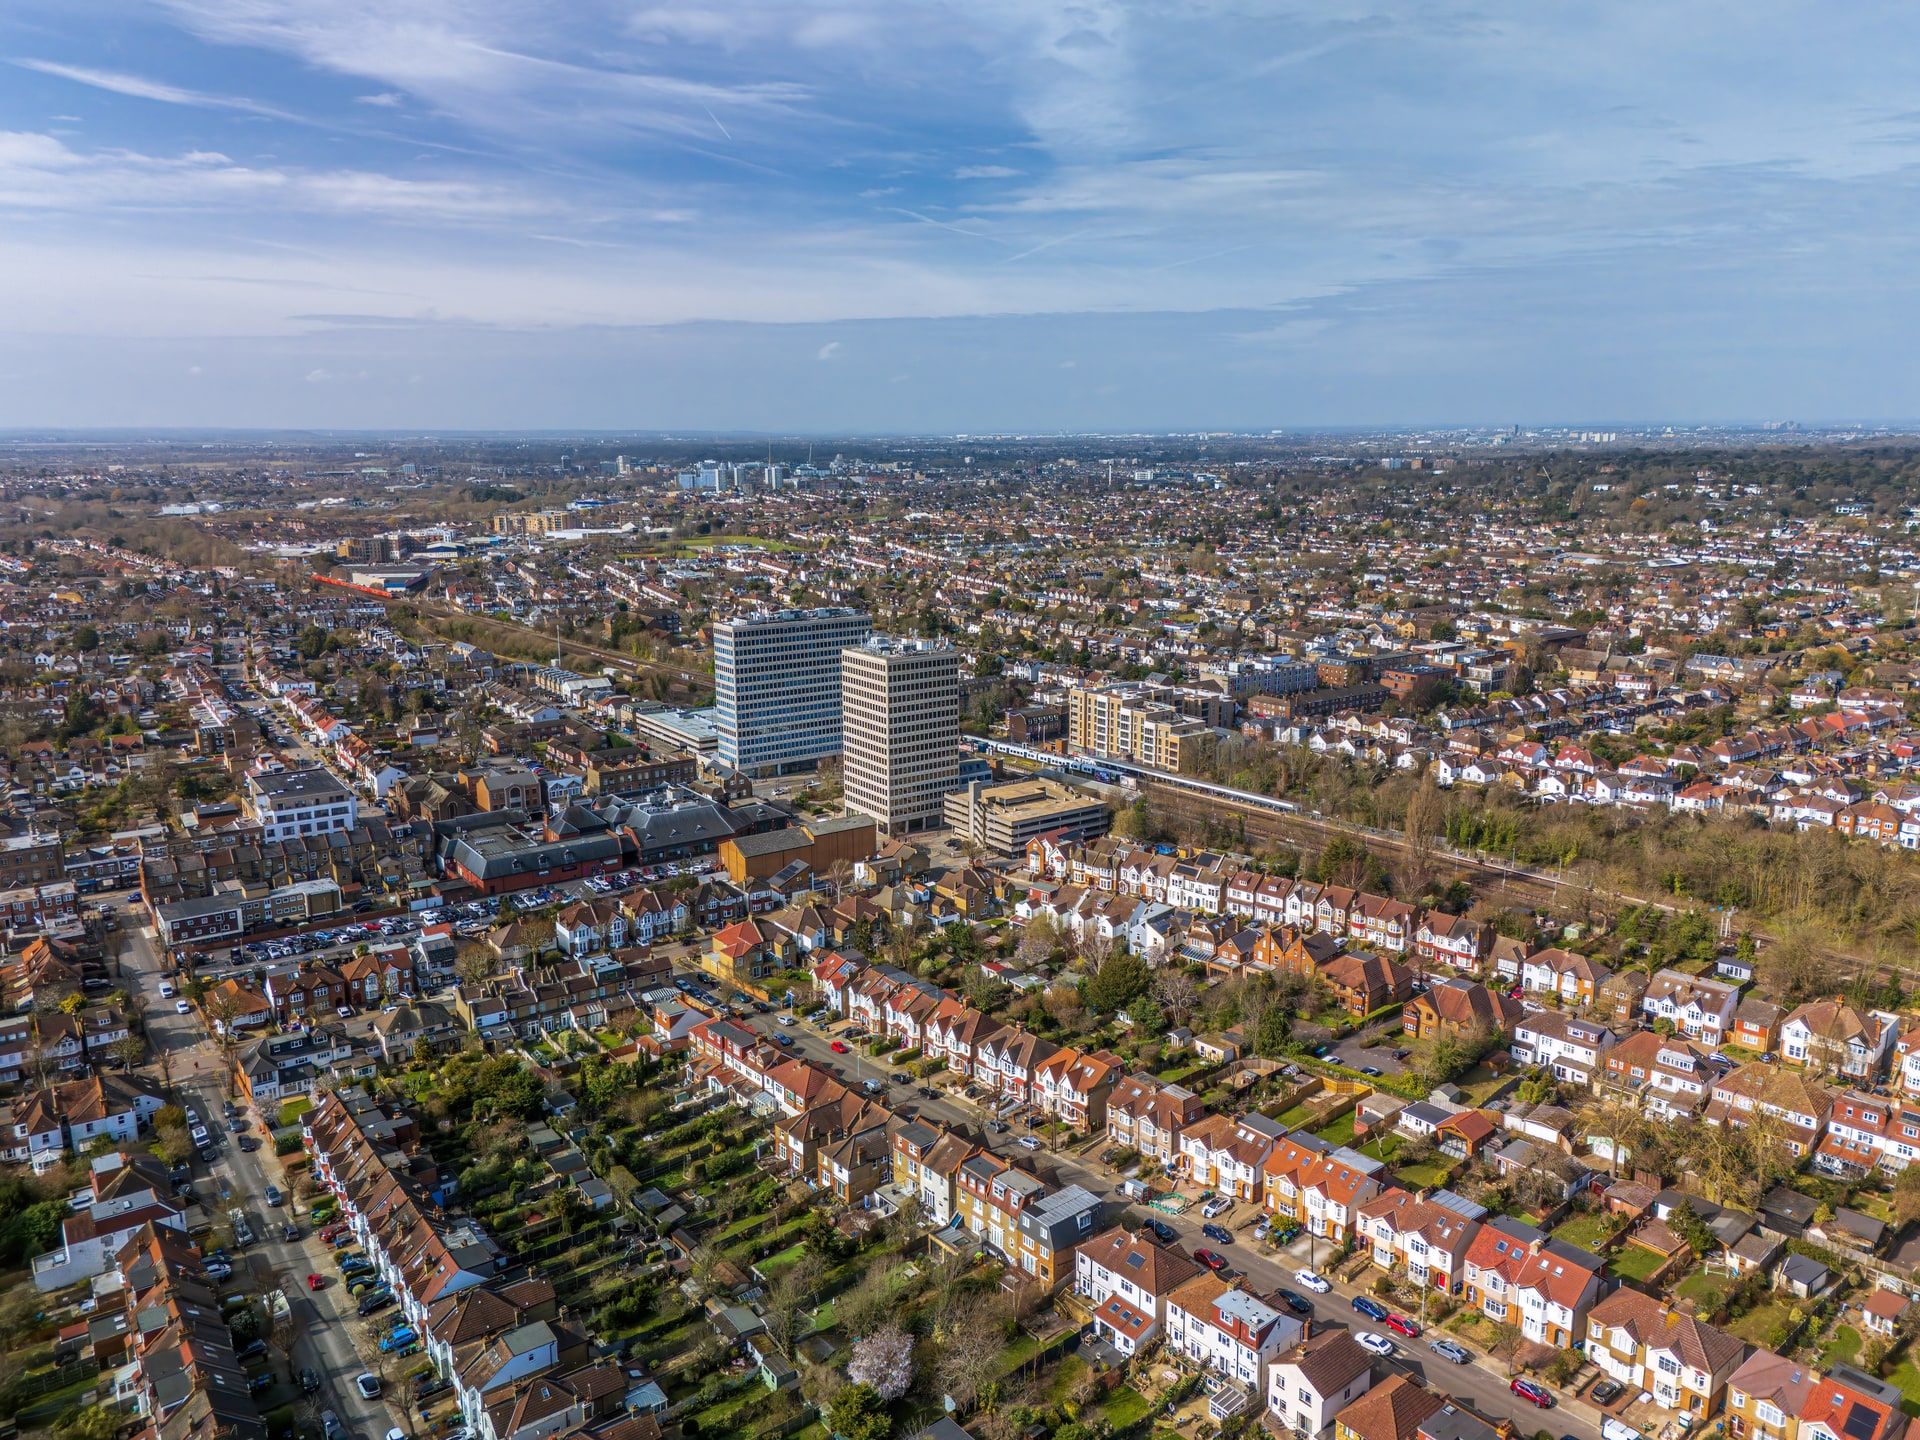
This guide covers the Royal Borough of Kingston upon Thames (ONS code E09000021) across postcodes KT1, KT2, KT3, KT5, KT6, and KT9. Kingston runs along the Thames at the south-west edge of London, from the town centre and Norbiton through Surbiton and New Malden out to Chessington, sharing borders with Richmond upon Thames to the north and Merton to the east.
Article updated: June 2026
Why Invest in Kingston upon Thames?
Kingston upon Thames added 8,003 residents between the 2011 and 2021 censuses, a 5.0% rise from 160,060 to 168,063, a little below the 6.3% England and Wales average. The borough is the smallest by population of the four south-west London boroughs in this guide, but its draw is a strong one: a riverside town centre with one of London's busiest shopping districts, the green expanse of Richmond Park along its northern edge, and the family suburbs of Surbiton, New Malden and Chessington spreading south. That mix of a working town centre and settled suburbs is what gives Kingston its steady, owner-occupier character.
The local employment rate of 82.2% sits well above both the London figure of 74.9% and the Great Britain figure of 75.6%, and unemployment runs at 4.8%, low for the capital. Those numbers reflect a population weighted towards professionals commuting into central London and Surrey, with Kingston town centre, Surbiton and Norbiton stations putting Waterloo within about half an hour. For a landlord the practical read is a tenant base built on stable, above-average earners rather than the broad social mix of the inner-London boroughs, which shows up in the borough's small social-rented sector.
Median gross weekly earnings for Kingston residents are £901.40, which works out at £46,871 a year. That sits just above the London median of £892.60 a week and well clear of the Great Britain figure of £752.40. Those above-average wages support rents that run from £1,645 a month in Surbiton's KT5 up to £2,175 in New Malden's KT3. Kingston University adds a student layer in the town-centre postcodes, while the major teaching and district hospitals at Kingston and Tolworth contribute a steady stream of NHS and key-worker tenants.
Kingston upon Thames Economic Summary
- Population: 168,063 (2021 Census). Growth of 5.0% from 2011.
- Median annual salary: £46,871 (local), £46,415 (London), £39,125 (Great Britain)
- Employment rate: 82.2% (local), 74.9% (London), 75.6% (Great Britain)
- Unemployment rate: 4.8% (local)
- Key employment sectors: Professional and technical services, retail, health and social work, education, public administration
Source: ONS Census 2021, Nomis Labour Market Profile (ASHE 2025, residence-based earnings)
Regeneration and Investment in Kingston upon Thames
Kingston's development is concentrated on the town-centre riverside in KT1, where the council's Kingston Town Centre planning framework guides new homes and workspace around the Thames frontage and the Cattle Market and Eden Quarter sites. Unlike the large opportunity-area schemes of inner London, Kingston's pipeline is smaller and town-centre led, which keeps new flat supply focused in the KT1 postcode rather than spread across the borough.
- Eden Quarter and Kingston town centre (Planning framework): The Royal Borough's town-centre planning framework directs residential and mixed-use development around the Eden Walk, Cattle Market and station areas of KT1, with new homes delivered above and alongside retail. The aim is to add town-centre housing on a constrained riverside site while protecting Kingston's retail role. Details at Kingston Council.
- Cambridge Road Estate regeneration (Under way, around 2,170 homes): The council-led rebuild of the Cambridge Road Estate in Norbiton, KT2, is the borough's single largest housing scheme, replacing the existing estate with around 2,170 new homes across phases over the coming years, a mix of social, affordable and market housing. For KT2 this is the main source of new residential supply in the borough.
- Tolworth and the A3 corridor (Long-term): The council has identified Tolworth in KT6, around its station and the A3, as a long-term growth area for housing and employment, building on its transport links into central London and out towards the M25. The work is at an early planning stage rather than under construction.

Kingston upon Thames Property Market Analysis
Average property prices in Kingston upon Thames have risen 570.4% since January 1995, from £85,184 to £571,088. The sections below trace that path through the borough's actual cycles, then break down current postcode-level data for sold prices, price per square foot, asking prices, growth trends, and monthly transaction volumes.
When was the last house price crash in Kingston upon Thames?
Kingston's sold prices are recorded by HM Land Registry at borough level under ONS code E09000021, and the House Price Index runs from January 1995 to the latest reading in April 2026, covering 31 years of market cycles. The borough's path has been a long, fairly even climb, with a single deep dip during the financial crisis and a far milder easing after the recent peak.
The 1995 to 2007 climb: Kingston started at £85,184 in January 1995. South-west London demand carried it past £180,744 by December 2000 and £264,507 by December 2005. The pre-crash market topped out at £342,470 in December 2007, four times its 1995 level.
2008 to 2009, the financial crisis: Prices fell from the December 2007 peak of £342,470 to a trough of £261,374 in April 2009, a drop of 23.7% over 16 months, with the worst year-on-year reading at -22.2% in April 2009. Kingston's fall was steeper than the England decline of around 18%, as the borough's higher-value, mortgage-dependent stock took the rate shock hard.
Recovery, 2009 to 2012: The bounce came steadily. Prices climbed back through 2010 and 2011 and passed the December 2007 pre-crash peak by July 2012, when the average reached £343,301. That recovery took about four and a half years, quicker than the eight-and-a-half years many regional markets needed, because south-west London demand returned ahead of the country.
2013 to 2016, the post-crisis surge: This was Kingston's strongest stretch. Prices ran from £354,202 in December 2012 to £452,086 by December 2014, with annual growth above 13%, and reached £517,027 by December 2016. The borough rose by nearly half across four years as buyers chased its schools, parks and commuter links.
2017 to 2019, the plateau: Growth stalled. The average barely moved from £517,027 in December 2016 to £515,102 by December 2019, as stamp duty changes and Brexit uncertainty cooled the outer-London market.
2020 to 2022, the pandemic high: The stamp duty holiday and a shift towards space and gardens suited Kingston well. Prices lifted from £506,074 in June 2020 to £590,114 by December 2022 and reached an all-time high of £617,017 in September 2022. That September 2022 peak remains the highest reading in the borough's 31-year record.
2023 to present, the easing: Since that high the market has drifted rather than corrected. Prices slipped to £562,347 by December 2023 as mortgage rates rose, recovered to £571,255 by December 2024, and have settled at £571,088 by April 2026. That leaves Kingston about 7.4% below its September 2022 peak but still up over five years, a far gentler move than the boroughs nearer the centre.
Long-term growth summary:
- 5 years (April 2021 to April 2026): 7.4% growth (£531,666 to £571,088)
- 10 years (April 2016 to April 2026): 13.4% growth (£503,495 to £571,088)
- 15 years (April 2011 to April 2026): 79.9% growth (£317,457 to £571,088)
- 20 years (April 2006 to April 2026): 112.8% growth (£268,419 to £571,088)
- 30 years (January 1995 to April 2026): 570.4% growth (£85,184 to £571,088)
The shape of those numbers is the key to Kingston today. The borough is up 7.4% over five years and 13.4% over ten, modest gains but positive ones, which sets it apart from the inner-London markets that fell over the same windows. An investor who bought at the September 2022 high is sitting about 7.4% down on the Land Registry average, while one who bought before 2016 holds a large gain. The long capital-growth record and the steadiness of the recent easing, rather than a high income return, carry the case here.
- All property types
- Detached
- Semi-detached
- Terraced
- Flats
- All property types
- Detached
- Semi-detached
- Terraced
- Flats
Sold House Prices in Kingston upon Thames
The average sold price across all property types in Kingston upon Thames is £571,088, which is 97.0% above the England average of £289,946 as of April 2026. The premium widens with the size of the home: detached houses cost 166.9% more than the England average, while flats, the type most investors here actually buy, cost 65.0% more. That spread matters because the flat figure sits much closer to the all-property average than the house types do, and flats are where the rental numbers below are made.
| Property Type | Kingston upon Thames Average | England Average | Difference |
|---|---|---|---|
| Detached houses | £1,255,722 | £470,492 | +166.9% |
| Semi-detached houses | £780,892 | £288,185 | +171.0% |
| Terraced houses | £570,210 | £243,788 | +133.9% |
| Flats and maisonettes | £353,961 | £214,563 | +65.0% |
| All property types | £571,088 | £289,946 | +97.0% |
Detached houses at £1,255,722 are 166.9% above the England average, but they are scarce in Kingston and concentrate in the Coombe streets of KT2 and the larger plots of New Malden and Chessington. The figure reflects a small, expensive slice of stock rather than anything most landlords will buy, and detached values eased 1.4% over the year.
Semi-detached houses at £780,892 carry the widest premium of the four types at 171.0% above England. These are the inter-war family houses that fill Surbiton, New Malden and Chessington, the owner-occupier core of the borough, and they also eased 1.4% over the year.
Terraced houses at £570,210 sit 133.9% above the England average. Kingston's terraces run through the town centre, Norbiton and Surbiton, the period family-house end of the market, and they came back 1.7% over the year.
Flats and maisonettes at £353,961 are 65.0% above England, the narrowest premium of the four and the part of the market that defines Kingston as an investment. Flats cluster in the KT1 town centre and along the Surbiton and Tolworth station corridors, so the all-property average of £571,088 leans towards the flat figure once the rarer houses are set aside. Flat values fell 5.4% over the year, the sharpest move of any type and the reason the headline all-types reading was negative while the houses held closer to flat.
Price Per Square Foot in Kingston upon Thames
£185 per square foot separates Kingston's cheapest postcode from its dearest, with KT9 at £528 and KT2 at £703. Measuring by the square foot controls for how large the homes are and shows what the location itself commands, which in Kingston tracks the pull of the town centre and the northern Coombe streets. KT2 in Norbiton and Coombe tops the table, its proximity to Richmond Park and the larger detached stock lifting the rate.
| Rank | Area | Price Per Sq Ft |
|---|---|---|
| 1 | KT9 (Chessington) | £528 |
| 2 | KT3 (New Malden) | £613 |
| 3 | KT5 (Surbiton, Berrylands) | £623 |
| 4 | KT6 (Surbiton, Tolworth) | £623 |
| 5 | KT1 (Kingston town centre) | £664 |
| 6 | KT2 (Norbiton, Coombe) | £703 |
KT9 at £528 per square foot buys the most space for the money in Kingston, out at Chessington on the borough's southern edge, furthest from both the river and the town-centre stations. Its rate runs about 25% under KT2's, the discount that comes with a more outlying address.
KT2 at £703 per square foot tops the table, with KT1 in the town centre next at £664. KT2 covers Norbiton and the Coombe estate on the borough's northern edge against Richmond Park, where larger detached houses on bigger plots command the highest rate per square foot in Kingston.
House Price Growth in Kingston upon Thames
KT5 in Surbiton leads Kingston's recent growth with a five-year return of 18.0%, while KT6 next door sits at the other extreme down 1.2% over the same period. The growth table shows a borough moving in different directions postcode by postcode, with the Surbiton, New Malden and Chessington suburbs ahead of the town-centre and Norbiton flats.
| Area | 1 Year | 3 Years | 5 Years |
|---|---|---|---|
| KT5 (Surbiton, Berrylands) | 4.3% | 7.6% | 18.0% |
| KT9 (Chessington) | -2.4% | -2.6% | 12.3% |
| KT3 (New Malden) | -0.1% | 17.2% | 11.7% |
| KT1 (Kingston town centre) | 3.8% | -11.3% | 7.6% |
| KT2 (Norbiton, Coombe) | 2.4% | -8.9% | 0.4% |
| KT6 (Surbiton, Tolworth) | 3.7% | -1.4% | -1.2% |
KT5 (Surbiton, Berrylands) posted the strongest five-year figure at 18.0%, alongside a 7.6% three-year gain and 4.3% over the past year, the only postcode rising consistently across all three windows. The Berrylands semi-detached market behaved steadily while the flat-heavier postcodes swung. KT3 (New Malden) shows the largest three-year reading at 17.2%, with its family-house stock holding value through the rate shock.
KT6 (Surbiton, Tolworth) sits at the bottom, down 1.2% over five years and 1.4% over three, while KT2 (Norbiton, Coombe) is barely positive over five years at 0.4% after a 8.9% three-year fall. KT1 in the town centre tells the flat story most clearly, up 3.8% over the past year but down 11.3% over three, the small-flat market that ran hot into 2022 and gave most of it back.
Monthly Property Sales in Kingston upon Thames
Kingston records around 125 sales a month across its six postcodes, with KT6 (Surbiton, Tolworth) the busiest at 30 and KT5 (Surbiton, Berrylands) the quietest at 13. Transaction volumes and turnover vary across the borough, which shapes how easily an investor can buy now or sell later.
| Area | Sales Per Month | Turnover | Asking Price |
|---|---|---|---|
| KT6 (Surbiton, Tolworth) | 30 | 10% | £506,295 |
| KT3 (New Malden) | 25 | 7% | £684,394 |
| KT2 (Norbiton, Coombe) | 22 | 7% | £746,221 |
| KT1 (Kingston town centre) | 18 | 8% | £560,850 |
| KT9 (Chessington) | 18 | 22% | £487,076 |
| KT5 (Surbiton, Berrylands) | 13 | 7% | £558,348 |
KT6 logs the most sales at 30 a month on 10% turnover, the busiest postcode in Kingston, running through Surbiton and Tolworth along the rail line. A buyer there has the widest pick of stock and the most recent sale prices to value against, and a landlord planning an eventual exit has the readiest market to sell back into. KT9 in Chessington is the turnover story: at 22% it churns its for-sale stock faster than anywhere else in the borough, so its 18 sales a month come off a much smaller pool than KT1's same figure.
KT5 in Berrylands records the fewest at 13 a month, a semi-detached market held tightly by owner-occupiers who move rarely. Thin supply leaves a buyer less to choose from, but it has gone hand in hand with the borough's strongest five-year growth, as the table above shows. How those volumes turn into actual selling times is the next section.
How Long Properties Take to Sell in Kingston upon Thames
KT9 (Chessington) sells fastest of any Kingston postcode at about 138 days and is the borough's only seller's market, while KT2 (Norbiton) holds roughly 17 months of unsold stock at the current pace of sale. Days on market counts how long a typical listing waits before it sells; months of unsold stock counts how deep the for-sale queue runs at that pace. How long it takes to get back out is a holding cost that never shows in the yield figure, and in Kingston it stretches from under five months at the Chessington end to nearly eighteen at the Norbiton end. The table runs fastest first.
| Area | Avg Days to Sell | Months of Unsold Stock | Market |
|---|---|---|---|
| KT9 (Chessington) | 138 | 4.5 | Seller's market |
| KT6 (Surbiton, Tolworth) | 304 | 10.0 | Balanced market |
| KT5 (Surbiton, Berrylands) | 338 | 11.1 | Balanced market |
| KT1 (Kingston town centre) | 435 | 14.3 | Buyer's market |
| KT3 (New Malden) | 507 | 16.7 | Buyer's market |
| KT2 (Norbiton, Coombe) | 507 | 16.7 | Buyer's market |
KT9 in Chessington clears fastest at about 138 days and 4.5 months of supply, the only postcode that registers as a seller's market, which fits its high turnover and small for-sale stock. The two Surbiton postcodes, KT6 and KT5, follow as balanced markets at roughly 300 to 340 days. At the other end, KT2 in Norbiton and KT3 in New Malden each carry around 16.7 months of unsold stock and take about 507 days to sell, more than three times KT9's exit time. For an investor the slower northern postcodes mean real room to negotiate on the way in, but a longer and costlier wait whenever the time comes to sell.
What Type of Property Can You Buy in Kingston upon Thames?
Flats and maisonettes lead the town-centre stock, at 54.5% of homes in KT1, but houses make up the majority across the rest of the borough, peaking with KT9 in Chessington where flats fall to 10.7%. The mix is the single most important fact about Kingston for a buy-to-let investor: this is a flat market in the KT1 town centre and a house market in the suburbs, with the balance shifting sharply from one postcode to the next. The figures below are drawn from 2021 Census records for each postcode.
| Area | Detached | Semi-detached | Terraced | Flats |
|---|---|---|---|---|
| KT1 (Kingston town centre) | 6.6% | 24.0% | 13.3% | 54.5% |
| KT2 (Norbiton, Coombe) | 32.3% | 17.4% | 10.3% | 40.0% |
| KT6 (Surbiton, Tolworth) | 21.5% | 26.3% | 13.3% | 38.7% |
| KT5 (Surbiton, Berrylands) | 12.1% | 49.6% | 9.6% | 28.8% |
| KT3 (New Malden) | 23.1% | 32.5% | 19.1% | 25.2% |
| KT9 (Chessington) | 24.8% | 41.3% | 22.8% | 10.7% |
KT1 in the town centre is the one flat-led postcode at 54.5%, the dense centre around the station and the Eden Walk shopping district where purpose-built blocks and converted period buildings make up most of the stock. This is the single-let and professional-sharer postcode, with semi-detached houses next at 24.0% but flats the clear majority.
KT9 in Chessington is the outlier the other way, the most house-dominated postcode where flats fall to 10.7% and detached, semi-detached and terraced houses together make up 88.9% of the stock. KT5 in Berrylands is the borough's most semi-detached postcode at 49.6%. A buyer wanting a flat in Kingston is effectively shopping in KT1, while a buyer wanting a family house has the whole of the southern and western borough to choose from.
The flats figure covers both purpose-built blocks and conversions, and a small share of non-standard dwellings is left out, so rows may not total 100%.
Kingston upon Thames Rental Market Analysis
Monthly rents in Kingston range from £1,645 in KT5 to £2,175 in KT3, with gross rental yields from 3.4% to 4.2% across the five postcodes that carry rental data. For investors weighing whether buy to let is worth it in a borough where prices have held but yields are modest, the rental section below breaks down rents, yields and tenant affordability postcode by postcode. Browse current buy-to-let homes for sale across the capital.
Average Rent & Gross Rental Yields in Kingston upon Thames
Gross rental yields in Kingston run from 3.4% in KT2 to 4.2% in KT1 and KT6. The cheaper town-centre and Tolworth postcodes deliver the higher yields and the dearer Norbiton and New Malden postcodes the lower, the inverse relationship between price and income that runs through most of south-west London. KT6 pairs the borough's lowest asking price with a steady rent to share the top of the table.
| Area | Average Monthly Rent | Asking Price | Gross Yield |
|---|---|---|---|
| KT6 (Surbiton, Tolworth) | £1,777 | £506,295 | 4.2% |
| KT1 (Kingston town centre) | £1,960 | £560,850 | 4.2% |
| KT3 (New Malden) | £2,175 | £684,394 | 3.8% |
| KT5 (Surbiton, Berrylands) | £1,645 | £558,348 | 3.5% |
| KT2 (Norbiton, Coombe) | £2,097 | £746,221 | 3.4% |
| KT9 (Chessington) | Not enough data | £487,076 | Not enough data |
KT6 and KT1 share the top of the yield table at 4.2%. KT6 in Surbiton and Tolworth pairs the borough's lowest asking price of £506,295 with a £1,777 monthly rent, where a 30% deposit is £151,888, while KT1 reaches the same yield from a £560,850 town-centre price on a higher £1,960 rent. These are the two practical income postcodes in the borough.
KT2 in Norbiton and Coombe sits at the bottom of the yield table at 3.4%, where a £746,221 asking price, the highest in Kingston, meets a £2,097 rent the price does not keep pace with. The Coombe estate holds its value as a prime family area, but the income return is the thinnest in the borough, the trade-off for buying into its dearest streets. KT9 in Chessington shows a £487,076 asking price but too few rental listings to produce a reliable rent or yield, so it reads as not enough data on those measures.
Gross Rental Yield by Postcode
Is Kingston upon Thames Rent High?
Kingston rents consume between 42.1% and 55.7% of the local median individual salary, above the 30% affordability benchmark and a clear marker of how the borough's rental market is priced. The common rule of thumb is that rent should take around 30% of gross income. No Kingston postcode comes close to that on a single median salary, which tells you who actually rents here.
The median gross weekly salary in Kingston is £901.40, which works out at £3,906 per month or £46,871 per year. That sits above the London median of £892.60 a week and well clear of the Great Britain median of £752.40. Data from the Nomis Labour Market Profile (ASHE 2025).
| Rank | Area | Rent as % of Income |
|---|---|---|
| 1 | KT3 (New Malden) | 55.7% |
| 2 | KT2 (Norbiton, Coombe) | 53.7% |
| 3 | KT1 (Kingston town centre) | 50.2% |
| 4 | KT6 (Surbiton, Tolworth) | 45.5% |
| 5 | KT5 (Surbiton, Berrylands) | 42.1% |
| - | KT9 (Chessington) | Not enough data |
These figures compare a one-bedroom-or-larger market rent against a single resident's median pay, so they read high by design. In practice Kingston's renters are mostly couples and sharers pooling two or more incomes, which is how a borough with rents above £1,600 a month sustains the demand it does. KT5 in Berrylands at 42.1% is the most affordable on this measure, where the borough's lowest rent meets the same median salary.
How Big Is Kingston upon Thames's Private Rented Sector?
The private rented sector is deepest in KT1, where it accounts for 35.7% of households, and shallowest in Chessington's KT9 at 15.2%. The share of homes already rented privately is a guide to how large and established the local tenant pool is, and across Kingston it sits alongside a small social-rented sector, well below the inner-London norm. The table below shows household tenure by postcode.
| Area | Owned Outright | Owned with Mortgage | Private Rented | Social Rented |
|---|---|---|---|---|
| KT1 (Kingston town centre) | 22.4% | 24.9% | 35.7% | 15.8% |
| KT6 (Surbiton, Tolworth) | 28.9% | 35.9% | 27.3% | 7.5% |
| KT5 (Surbiton, Berrylands) | 32.1% | 35.8% | 23.4% | 8.2% |
| KT2 (Norbiton, Coombe) | 38.1% | 31.4% | 22.9% | 6.9% |
| KT3 (New Malden) | 34.6% | 33.7% | 22.6% | 8.2% |
| KT9 (Chessington) | 35.7% | 38.8% | 15.2% | 9.9% |
KT1 holds the largest private rented sector at 35.7%, the town-centre postcode where renting is the default for the young professionals and students drawn to the station, the shops and Kingston University. A deep rented sector points to a tested, liquid lettings market rather than an untried one.
Owner-occupation dominates the suburbs, with outright and mortgaged ownership together above 70% in KT5, KT6, KT2, KT3 and KT9, and the private rented share dropping to 15.2% in Chessington's KT9. Social renting is light across the whole borough, from 6.9% in KT2 up to 15.8% in KT1, far below the inner-London level. That settled owner-occupier base is why Kingston's tenant demand is concentrated in the town centre and the station corridors rather than spread evenly across the borough.
Local Housing Allowance Rates in Kingston upon Thames
Kingston straddles two Broad Rental Market Areas: KT1, KT2, KT3, KT5 and KT6 fall in Outer South West London, while KT9 in Chessington sits in Outer South London, so the Local Housing Allowance rates differ across the borough. Local Housing Allowance is the most a tenant on housing support can claim towards rent, so for that part of the market it sets an effective floor. To check the figure for a specific address, use the government's official Local Housing Allowance calculator.
| Property Size | Outer South West London (weekly) | Outer South London (weekly) |
|---|---|---|
| Shared accommodation | £136.13 | £131.02 |
| 1 bedroom | £276.16 | £218.63 |
| 2 bedrooms | £344.05 | £276.16 |
| 3 bedrooms | £414.25 | £345.21 |
| 4 bedrooms | £586.85 | £448.77 |
The two-bedroom rate in the Outer South West London area covering most of Kingston is £344.05 a week, about £1,491 a month, while Chessington's Outer South London rate is lower at £276.16, about £1,197. Both sit well below the borough's open-market rents of £1,645 to £2,175, so a benefit-backed tenancy at the LHA rate falls a long way under what a Kingston let commands. Given the borough's small social-rented sector and above-average earnings, the LHA floor matters less here than in most London boroughs, but the Chessington gap is the wider of the two and worth noting for any lower-market let. These rates are the June 2026 figures and are reset each April.
Buy-to-Let Considerations
Are House Prices High in Kingston upon Thames? Price-to-Earnings Ratios
Buying in Kingston takes between 10.4 and 15.9 times the local median salary, with every postcode well above the national benchmark. This is based on the Nomis Labour Market Profile for Kingston upon Thames, which puts the median gross annual income for residents at £46,871.
The national benchmark for price-to-earnings is 7.4x (England's average sold price of £289,946 divided by the Great Britain median annual salary of £39,125). No Kingston postcode comes close to that, which puts the whole borough firmly in expensive territory relative to local incomes, even before the deposit and purchase costs are added.
| Rank | Area | Price-to-Earnings Ratio |
|---|---|---|
| 1 | KT9 (Chessington) | 10.4x |
| 2 | KT6 (Surbiton, Tolworth) | 10.8x |
| 3 | KT5 (Surbiton, Berrylands) | 11.9x |
| 4 | KT1 (Kingston town centre) | 12.0x |
| 5 | KT3 (New Malden) | 14.6x |
| 6 | KT2 (Norbiton, Coombe) | 15.9x |
KT9 and KT6 are the most affordable on this measure at 10.4x and 10.8x, still well above the national 7.4x. Even the cheapest way into Chessington or Tolworth takes more than ten years of the local median salary, a reminder that Kingston buyers rarely rely on a single local wage.
KT2 at 15.9x is the least affordable, with KT3 in New Malden behind at 14.6x. Both reach that point through the value of their house markets, Norbiton's Coombe streets and New Malden's family homes, and both sit at the bottom of the yield table for the same reason, a purchase price the rent struggles to keep up with.
Deposit Requirements in Kingston upon Thames
A 30% deposit on a buy-to-let in Kingston ranges from £146,123 in KT9 to £223,866 in KT2. The £77,743 gap between the cheapest and dearest deposit is itself larger than a full deposit in much of the country. For investors comparing Kingston with the rest of south-west London, these deposits sit below Richmond's but above outer-London neighbours like Sutton.
Beyond the deposit, the stamp duty calculation and other buy-to-let running costs add materially to the capital required, particularly at Kingston's price points where the surcharge on additional property runs into five figures on its own.
| Rank | Area | 30% Deposit Required |
|---|---|---|
| 1 | KT9 (Chessington) | £146,123 |
| 2 | KT6 (Surbiton, Tolworth) | £151,888 |
| 3 | KT5 (Surbiton, Berrylands) | £167,504 |
| 4 | KT1 (Kingston town centre) | £168,255 |
| 5 | KT3 (New Malden) | £205,318 |
| 6 | KT2 (Norbiton, Coombe) | £223,866 |
KT9 keeps the entry cost down at a £146,123 deposit, and KT6 is within about £5,800 of it. Chessington and Tolworth are the practical starting point for an investor working to a budget, pairing the two lowest deposits with KT6's joint-top yield of 4.2%.
At the top, KT2 needs a £223,866 deposit, around £77,700 more than KT9, for a postcode that earns less per pound through the rent and takes among the longest to sell. The extra deposit buys a prime Norbiton and Coombe address rather than a stronger investment return.

What the Kingston upon Thames Data Tells Buy-to-Let Investors
In Kingston the cheaper postcodes are also the higher-yielding, but the spread is narrow. KT6 (Surbiton, Tolworth) and KT1 (Kingston town centre) share the top yield at 4.2%, with KT6 the cheapest practical entry at a £506,295 asking price for an investment property in Kingston and the more affordable against local earnings at 10.8 times income. A 30% deposit in KT6 is £151,888, for a home renting at £1,777 a month, on a station corridor the council has earmarked for long-term growth.
Kingston earns its keep on growth, not income. The yield band is narrow, 4.2% at the top in KT6 and KT1 down to 3.4% in KT2, so the rent alone rarely makes the sums work. What does is the five-year sold-price gain of 7.4% and the 31-year record behind it. Within the borough the growth has clustered in the suburbs, KT5 up 18.0% over five years and New Malden's KT3 up 17.2% over three, while the flat-led KT1 and KT2 have swung harder either way.
Then there is the stock, which decides what an investor can actually buy. Only KT1 in the town centre is flat-led, at 54.5%, the postcode for single lets and sharers near the station and the university; every other postcode is house country, rising to 88.9% houses in Chessington. So a flat buyer is effectively confined to KT1, while a house buyer has the run of the southern and western borough. Because flats are the cheaper type, the £571,088 all-property sold average sits much nearer the £353,961 flat figure than any of the house prices once the scarce detached and semi-detached stock is set aside.
Compared with its south-west London neighbours, Kingston is the one that barely moved when rates bit: up 7.4% over five years and only 7.4% off its September 2022 high, an easing rather than a correction. Its prices have held more steadily than its south-west London neighbours through the rate cycle. The northern KT2 and KT3 postcodes are buyers' markets with around 17 months of stock waiting to clear, which leaves negotiating room on the way in, and the sharpest prices tend to come through below market value and off-market property routes before a home ever reaches the portals.
How Kingston upon Thames Compares
Kingston's mean asking price of £590,531 places it above its outer south-west London neighbours Sutton and Merton but well below Richmond, while its top yield of 4.2% is the lowest of the four. The comparison below sets Kingston alongside three nearby boroughs, each with a different balance of price and income return. Mean asking price and mean monthly rent are simple averages across all postcodes with data, and top gross yield is the single highest postcode yield in each borough.
| Location | Mean Asking Price | Mean Monthly Rent | Mean Gross Yield | Top Yield (postcode) |
|---|---|---|---|---|
| Sutton | £464,404 | £1,803 | 4.7% | 5.1% (SM1, SM5) |
| Merton | £596,108 | £2,223 | 4.5% | 5.2% (CR4) |
| Kingston upon Thames | £590,531 | £1,931 | 3.9% | 4.2% (KT1, KT6) |
| Richmond upon Thames | £880,115 | £2,622 | 3.6% | 4.9% (TW9) |
Kingston and Merton are close on price, at £590,531 and £596,108, but Merton runs a higher rent and a top yield of 5.2% against Kingston's 4.2%, a full percentage point more income for a near-identical asking price. Sutton is the cheapest of the group at £464,404 and yields 5.1%, the more affordable route to a stronger income return, though without Kingston's riverside town centre or schools.
Richmond upon Thames is the most expensive at £880,115, nearly £290,000 above Kingston, and yields 4.9% on its much higher rents, the prime south-west London trade-off of higher prices for a settled, high-demand market. For investors prioritising income from a smaller deposit, Sutton and Merton make the stronger case; for those wanting Kingston's specific blend of riverside town centre, parks and commuter links, the borough's lower yield is the price of entry. For a data-driven comparison across the whole country, see our best places to invest in buy-to-let guide.
Frequently Asked Questions
Is Kingston upon Thames a good place to invest in buy-to-let?
The numbers show stronger capital growth than yield. Kingston's sold prices are up 7.4% over five years where most of inner London is flat or down, and the borough sits only 7.4% below its September 2022 high, a gentle easing rather than a correction. What it does not offer is a strong yield: gross returns top out at 4.2% in KT6 and KT1 and bottom at 3.4% in KT2, a tight band well below the inner-south-London boroughs.
That makes the holding period the deciding factor. An investor buying for income alone will find higher yields in Sutton or Merton, but one buying for a steady, owner-occupier south-west London market with a long capital-growth record and deep professional tenant demand has a clear case in Kingston. The borough rewards a buyer reading it as a hold-and-let rather than a high-yield play.
What are the best areas in Kingston upon Thames for property investment?
The borough splits between the flat-led town centre and the house-led suburbs, and the goal points to the postcode. For yield, KT6 (Surbiton, Tolworth) leads at 4.2% with the lowest asking price at £506,295, alongside KT1 (Kingston town centre) at the same 4.2% from a higher rent. For capital growth, KT5 (Surbiton, Berrylands) leads the borough on five-year growth at 18.0%, though it yields 3.5%.
KT9 (Chessington) is the cheapest entry at a £487,076 asking price and the fastest to sell as the borough's only seller's market, but it carries too few rental listings to publish a reliable yield. So income runs to Surbiton and the town centre, growth runs to Berrylands and New Malden, and Chessington offers the lowest price and the easiest exit.
What are average house prices in Kingston upon Thames?
The average sold price across Kingston is £571,088 on the Land Registry index, about 97.0% above the England average of £289,946 as of April 2026. Asking prices by postcode run from £487,076 in KT9 (Chessington) up to £746,221 in KT2 (Norbiton, Coombe), with a borough-wide mean of £590,531. By type, the index puts flats at £353,961, terraced houses at £570,210, semi-detached at £780,892 and detached at £1,255,722, though the houses concentrate in the suburbs.
Through a buy-to-let lens, KT6 is the cheapest practical entry with rental data and the joint-highest-yielding at 4.2%, while KT2 is the dearest and the lowest-yielding at 3.4%.
What type of property is most common in Kingston upon Thames?
Houses, across most of the borough. Flats lead only in KT1 (Kingston town centre) at 54.5% of the stock, while every other postcode is house-dominated, peaking with KT9 (Chessington) where flats fall to 10.7% and houses make up 88.9%. KT5 in Berrylands is the most semi-detached postcode at 49.6%. For a buy-to-let investor, Kingston is a flat market in the town centre and a family-house market everywhere else.
Why have Kingston upon Thames house prices held up better than inner London?
Kingston reached an all-time high of £617,017 in September 2022 and has since eased only to £571,088 by April 2026, around 7.4% below that peak, and it remains up 7.4% over five years. The boroughs nearer the centre, weighted towards small investor-owned flats and overseas demand, corrected harder when interest rates rose after 2022. Kingston's stock is mostly owner-occupied family houses in the suburbs, a base that trades less on investor sentiment and more on local demand for schools, parks and commuter links.
The longer view supports that read. The borough is up 13.4% over ten years and 570.4% over thirty, a long and fairly even climb broken only by the 23.7% fall in the 2008 financial crisis, from which it recovered to its pre-crash peak in about four and a half years.
Is there demand for student and shared accommodation in Kingston upon Thames?
Student and sharer demand is a steady current in the town-centre postcodes. Kingston University spreads across several campuses around KT1 and KT2, drawing students into the town centre and Penrhyn Road area, while the major teaching and district hospitals at Kingston and Tolworth add NHS and key-worker tenants. Central London is about half an hour from Kingston, Surbiton and Norbiton stations, which keeps a flow of graduate commuters and sharers through the rental market.
On the shared-house side, the larger semi-detached stock in Surbiton and New Malden supports house shares and HMOs as a route to a workable yield where single-let returns are thin. For how the numbers work on a shared house, see our HMO investment guide, and for the purpose-built end of the market, our guide to student property investment.
How does Kingston upon Thames compare to Richmond for buy-to-let?
Richmond is the more expensive of the two by a wide margin and yields slightly more. Richmond's mean asking price is £880,115 against Kingston's £590,531, nearly £290,000 higher, and its top yield is 4.9% against Kingston's 4.2%, on a higher average rent of £2,622 versus £1,931. Both are riverside south-west London boroughs with settled owner-occupier markets, strong schools and good central-London links.
The choice tends to come down to budget and the kind of stock. Richmond carries a prime premium for its riverside and Richmond Park position, while Kingston offers a similar profile, a working town centre and steady growth at materially lower asking prices. For an investor weighing income against deposit size, Kingston's lower price point does more of the work.
What are the Local Housing Allowance rates in Kingston upon Thames?
Kingston spans two Broad Rental Market Areas, so the rate depends on the postcode. KT1, KT2, KT3, KT5 and KT6 fall in Outer South West London, where the June 2026 figures run from £136.13 a week for a shared room to £586.85 for a four-bed, with a one-bed at £276.16 and a two-bed at £344.05. KT9 in Chessington falls in Outer South London, where the rates are lower: £131.02 for a shared room up to £448.77 for a four-bed. Those figures are the most a tenant on housing support can claim, and they sit well below Kingston's open-market rents across the borough.
How do I buy an investment property in Kingston upon Thames?
Start by deciding whether you are buying for income or for capital growth, because the two point to different postcodes. For yield, KT6 (Surbiton, Tolworth) is the cheapest practical entry at £506,295 and the joint-highest-yielding at 4.2%, with KT1 matching the yield from the town centre. For growth, the Surbiton and New Malden suburbs have risen most over five years. Budget for a 30% deposit, which runs from £146,123 in KT9 to £223,866 in KT2.
Because the northern postcodes are buyers' markets, with KT2 and KT3 carrying around 17 months of unsold stock, there is often room to negotiate. Plenty of experienced investors buy below asking through off market properties and BMV property. To see what is available now, browse investment properties or buy-to-let opportunities.
Ready to buy property?
Access off-market investment properties with an average 8%+ annual gross yield (beating the UK's typical 3-5%).
Get property alerts