Where to Buy Property Investments in Reading: Yields of 6.1%
Reading is a large town and unitary authority in Berkshire, South East England. Gross rental yields range from 3.4% to 6.1% across all six postcodes, with RG1 delivering the highest returns. Average sold prices sit 21.6% above the England average but 6.3% below the South East regional average, and the town's population grew 11.9% to 174,224 between the 2011 and 2021 censuses.
Reading's average sold price of £354,805 sits between England's £291,865 and the South East's £378,800. That gap creates a pricing position where investors access a South East tenant pool on South East salaries without paying full South East prices. Asking prices start from £286,731 in RG1, and rental data is available for all 6 postcodes.
This guide covers all 6 Reading postcodes: RG1, RG2, RG4, RG6, RG30, and RG31, under the Reading unitary authority (ONS code E06000038). Reading sits in Berkshire, 40 miles west of London, with direct rail connections to Paddington in under 30 minutes. Investors comparing options in the region may also consider Slough, Bracknell, Oxford, or Basingstoke. Browse all our South East location guides.
Article updated: March 2026
Reading Buy-to-Let Market Overview 2026
Reading offers South East location fundamentals at prices below the regional average, backed by a strong corporate employment base and fast rail access to London.
- Average sold price: £354,805 (21.6% above England's £291,865)
- Asking price range: £286,731 (RG1) to £569,103 (RG4)
- Rental yields: 3.4% (RG4) to 6.1% (RG1) across all 6 postcodes
- Rental income: Monthly rents from £1,306 (RG30) to £2,127 (RG6)
- Price per sq ft: Sold prices from £385/sq ft (RG30) to £476/sq ft (RG6)
- Market activity: Sales ranging from 25 per month (RG6) to 42 per month (RG1)
- Deposit requirements: 30% deposits range from £86,019 (RG1) to £170,731 (RG4)
- Affordability ratios: Property prices from 7.0 to 14.0 times Reading's median annual salary of £40,700
Contents

-
by Robert Jones, Founder of Property Investments UK
With two decades in UK property, Rob has been investing in buy-to-let since 2005, and uses property data to develop tools for property market analysis.

Property Data Sources
Our location guide relies on diverse, authoritative datasets including:
- HM Land Registry UK House Price Index
- Ministry of Housing, Communities and Local Government
- Ordnance Survey Data Hub
- Propertydata.co.uk
We update our property data quarterly to ensure accuracy. Last update: March 2026. All data is presented as provided by our sources without adjustments or amendments.
Why Invest in Reading?
Reading's population grew 11.9% to 174,224 between the 2011 and 2021 censuses, nearly double the England average of 6.6%. That growth reflects a town that continues to attract working-age residents. The University of Reading brings a student population of around 20,000, creating sustained demand for rental accommodation across the town's central and eastern postcodes.
Reading's median annual salary of £40,700 is 4.0% above the Great Britain median of £39,125. Median gross weekly pay is £782.70 locally, compared with £800.30 across the South East region and £752.40 across Great Britain. The employment rate stands at 83.8%. Reading's economy is anchored by technology, telecommunications, and financial services, with major employers including Microsoft, Oracle, and Cisco maintaining UK headquarters in or near the town.
Reading Economic Summary
- Population: 174,224 (2021 Census). Growth of 11.9% from 2011.
- Median annual salary: £40,700 (Reading), £41,616 (South East), £39,125 (Great Britain)
- Employment rate: 83.8% (Reading)
- Unemployment rate: Data suppressed (small sample size in ONS Annual Population Survey)
- Key employment sectors: Technology, telecommunications, financial services, healthcare, education
Source: ONS Census 2021, Nomis Labour Market Profile (ASHE 2025)
Regeneration & Investment in Reading
Three major development projects are delivering over 1,800 new homes and significant commercial space across Reading's town centre and southern fringe. Station Hill is complete, Minster Quarter has planning approval, and Royal Elm Park secured design code sign-off in October 2025.
- Station Hill is the largest completed mixed-use scheme in Reading's town centre. Developed by Lincoln Property Company and MGT, the project delivered 598 build-to-rent apartments (Ebb & Flow) and a 275,000 sq ft office building (One Station Hill) with 2 acres of public realm directly outside Reading station. Both phases are now complete.
- Minster Quarter (Broad Street Mall) received planning approval in May 2025. McLaren Living and AEW will deliver 643 build-to-rent homes across four residential buildings on a 4.6-acre site south of Broad Street Mall, alongside 19,000 sq ft of commercial space and an NHS Walk-In Centre extension.
- Royal Elm Park secured design code approval in October 2025 after nine years in planning. The scheme adjacent to Reading FC's stadium will deliver 618 apartments, a 246-bedroom hotel, 102 serviced apartments, a convention centre, and an ice rink in the RG2 area of south Reading.

Reading Property Market Analysis
When was the last house price crash in Reading?
Reading is a unitary authority, so all sold property prices from the HM Land Registry House Price Index are available at this level. The full history runs from January 1995 to December 2025 and shows one major crash, a prolonged recovery, a pre-pandemic correction, and a sharp pandemic-era surge.
- 1995-2007 (The Boom): Reading began 1995 at £58,306. The technology boom drove rapid growth through the late 1990s, with prices reaching £122,266 by December 2000. Growth continued into the mid-2000s. By December 2005, the average stood at £185,014, and the pre-crash peak hit £223,512 in December 2007. Prices nearly quadrupled in 12 years.
- 2007-2009 (The Financial Crisis): From the peak of £223,512 in December 2007 to the trough of £181,603 in January 2009, Reading lost 18.8% of its value in 13 months. The worst annual change reading was -18.5% at the trough. Flats fell hardest at 19.6%, followed by terraced houses at 18.8%, semi-detached at 18.4%, and detached at 17.3%. Reading's decline of 18.8% sat between England (-18.2%, September 2007 to March 2009) and the South East (-20.0%, October 2007 to March 2009).
- 2009-2013 (Stagnation): Prices bounced from the trough to £201,005 by December 2010 but then lost momentum. By December 2013, the average was £218,881. Still 2.1% below the pre-crash peak after four years of gradual recovery.
- 2014-2016 (Recovery): Growth accelerated sharply. Reading passed its December 2007 peak in February 2014 at £224,931, a recovery period of 6.2 years. By December 2015, the average had reached £290,858, a 44.7% increase from the 2010 level. The South East housing market was running hard, and Reading's position on the rail network fuelled the growth.
- 2017-2019 (Pre-pandemic correction): Prices peaked at £319,957 in December 2017 before Brexit uncertainty and affordability pressure reversed the trend. By December 2019, the average had fallen to £299,963, a 6.2% decline over two years. Reading's premium South East pricing made it more sensitive to these headwinds than lower-cost markets.
- 2020-2022 (Pandemic surge): The stamp duty holiday and remote working shift pushed prices from £305,900 in December 2020 to £358,325 by December 2022. A 17.1% gain in two years. Reading's fast London rail access made it attractive to workers leaving the capital.
- 2023 (Rate shock): Interest rate rises cooled the market. Prices fell from £358,325 in December 2022 to £340,447 by December 2023, a decline of 5.0%.
- 2024-2025 (Stabilisation): Prices recovered through 2024, reaching £360,385 in September before easing to £354,805 by December 2025. Annual growth of 1.2% suggests a market finding its level after the post-pandemic correction.
Long-Term Property Value Growth in Reading
- 5 years (2020-2025): +16.0% (£305,900 to £354,805)
- 10 years (2015-2025): +22.0% (£290,858 to £354,805)
- 15 years (2010-2025): +76.5% (£201,005 to £354,805)
- 20 years (2005-2025): +91.8% (£185,014 to £354,805)
- 30 years (1995-2025): +508.5% (£58,306 to £354,805)
The 2008 crash is the reference point for Reading investors assessing downside. An 18.8% decline took 6.2 years to recover. Reading's position has changed since 2007. The Elizabeth Line opened in 2022, connecting Reading directly to central London and Canary Wharf. Station Hill has added 598 apartments and 275,000 sq ft of office space to the town centre. The employment base is broader and the transport links are stronger. The structural picture is different, even if property prices are never guaranteed.
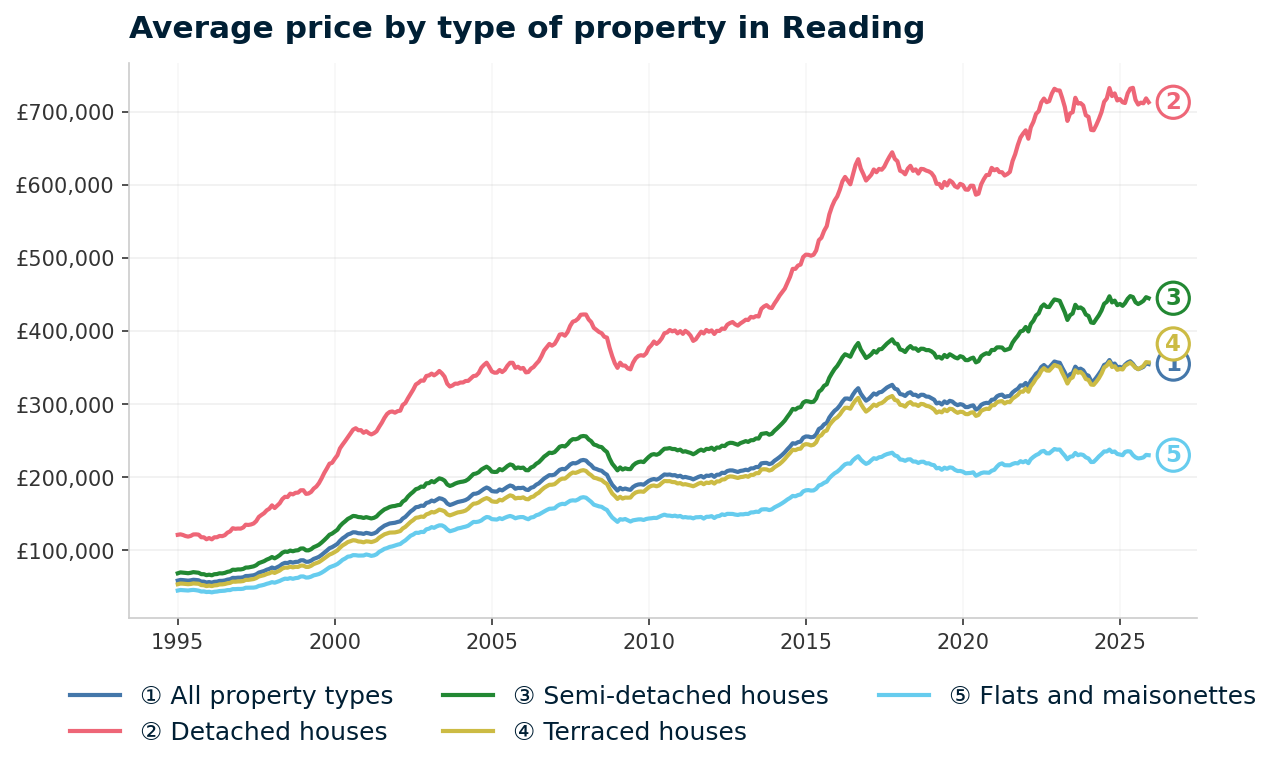
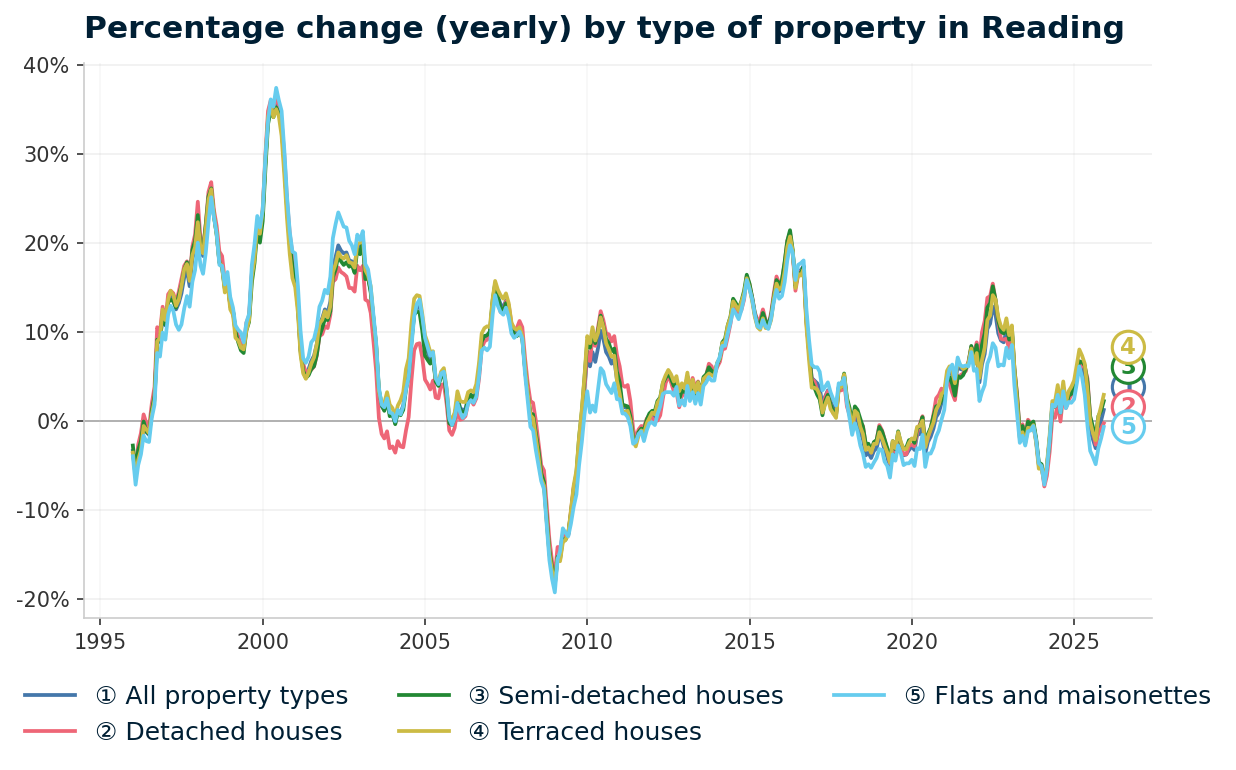
Source: HM Land Registry House Price Index for Reading, January 1995 to December 2025.
Thinking of Buying?
We have off-market investment properties averaging 8%+ annual yield.
View Property DealsSold House Prices in Reading
Reading's average sold price of £354,805 is 21.6% above England's £291,865 but 6.3% below the South East's £378,800. Prices sit above the England average across every property type. That dual positioning sets Reading apart from most locations in this guide. For investors, that positioning matters. Reading offers a South East location at a discount to the regional average.
Semi-detached houses in Reading average £444,975. That is 53.9% above the England average of £289,135. This is the widest premium of any property type and reflects Reading's position as a commuter town where family housing competes with London overspill demand. Owner-occupier competition in postcodes like RG4 Caversham and RG31 Tilehurst drives these prices well beyond national norms.
| Property Type | Reading Average | England Average | Difference |
|---|---|---|---|
| Detached houses | £713,317 | £471,667 | +51.2% |
| Semi-detached houses | £444,975 | £289,135 | +53.9% |
| Terraced houses | £357,063 | £244,830 | +45.8% |
| Flats and maisonettes | £230,068 | £219,340 | +4.9% |
| All property types | £354,805 | £291,865 | +21.6% |
Flats show the narrowest premium at just 4.9% above England. Reading's flat market averages £230,068 against England's £219,340. That near-parity with the national average is significant. Flats are the property type where Reading looks most like a mid-market town rather than a South East commuter hub. For buy-to-let investors, this is the entry point where Reading's prices come closest to national norms while still offering access to South East rental demand.
Detached houses sit 51.2% above England at £713,317. The detached market in Reading serves owner-occupiers in premium postcodes like RG4 Caversham and is largely outside the buy-to-let investment range. The premium reflects Reading's proximity to London and the quality of its suburban housing stock.
Terraced houses average £357,063, a 45.8% premium. The terraced stock in RG1 Town Centre and RG30 Tilehurst forms the core of Reading's traditional rental market. Despite the premium over England, terraced houses offer more accessible entry points than semis or detached properties, and the postcode-level data below shows where individual entry prices sit.
For investors seeking properties below market value, the flat market in Reading represents the narrowest gap to the national average and the lowest absolute entry point at £230,068. Those looking for renovation properties or repossessed houses for sale may find additional entry points below these averages.
Price Per Square Foot in Reading
Reading's sold price per square foot ranges from £385 in RG30 Tilehurst to £476 in RG6 Earley. Average asking prices can mislead because a postcode might look expensive simply because it has larger properties. Price per square foot strips out that size bias and shows what you are actually paying for space.
The spread of £91 across six postcodes is relatively tight compared with many towns in this guide. It reflects a housing market where even the most affordable areas carry South East pricing, and the premium postcodes do not run away from the pack as dramatically as they do in cities with more extreme wealth gaps.
| Rank | Area | Price Per Sq Ft |
|---|---|---|
| 1 | RG30 (Tilehurst, Southcote) | £385 |
| 2 | RG1 (Town Centre) | £393 |
| 3 | RG2 (Whitley, Shinfield) | £421 |
| 4 | RG31 (Tilehurst, Calcot) | £438 |
| 5 | RG4 (Caversham) | £474 |
| 6 | RG6 (Earley, Lower Earley) | £476 |
RG30 Tilehurst at £385 per square foot is the most affordable space in Reading. This is a residential suburb west of the town centre with a mix of inter-war and post-war housing. At £385, RG30 also delivers 14.9% five-year growth, which means investors who bought here in 2021 have seen meaningful equity gains from the lowest per-foot cost base in Reading.
RG4 Caversham and RG6 Earley sit almost level at £474 and £476 per square foot. These are the premium postcodes where larger family homes and established residential areas command higher rates. The near-identical per-foot costs suggest similar underlying land values north and east of the town centre, despite RG4 carrying significantly higher asking prices (£569,103 vs £497,615). The difference in headline price is driven by property size, not per-foot value.
RG1 Town Centre at £393 per square foot ranks second cheapest. Read this alongside the yield data in the rental section. RG1 delivers Reading's highest gross yield at 6.1% from the second-lowest per-foot cost. That combination of affordable space and strong rental income is what drives the yield performance.
Figures reflect averages across all property types and ages. Individual values depend on condition, location within the postcode, and building age.
For Sale Asking Prices in Reading
Asking prices in Reading range from £286,731 in RG1 Town Centre to £569,103 in RG4 Caversham, a spread of £282,372. Asking prices reflect what sellers and agents think the market will pay, not what buyers actually paid. The gap between asking and sold prices matters: in a rising market, asking prices run ahead; in a cooling market, they sit above what eventually transacts.
The mean asking price across all postcodes is £415,265. For investors looking at investment property in the South East, Reading's entry point in RG1 is £128,534 below the town-wide average.
| Rank | Area | Average Asking Price |
|---|---|---|
| 1 | RG1 (Town Centre) | £286,731 |
| 2 | RG30 (Tilehurst, Southcote) | £335,994 |
| 3 | RG2 (Whitley, Shinfield) | £376,715 |
| 4 | RG31 (Tilehurst, Calcot) | £425,430 |
| 5 | RG6 (Earley, Lower Earley) | £497,615 |
| 6 | RG4 (Caversham) | £569,103 |
RG1 Town Centre at £286,731 is Reading's most affordable postcode by asking price. This is also the postcode that delivers the highest gross yield at 6.1%. The combination is unusual for a South East location. Town centre stock in RG1 includes a mix of flats, converted properties, and some terraced housing near the station. The Station Hill development has added 598 build-to-rent apartments to this postcode.
RG30 Tilehurst at £335,994 is the second most affordable entry point. The gap between RG1 and RG30 is £49,263. After that, prices step up more sharply: RG2 Whitley at £376,715 and RG31 Tilehurst at £425,430 represent mid-range options where suburban family housing stock dominates.
RG4 Caversham at £569,103 is Reading's most expensive postcode. Caversham sits north of the Thames, physically separated from the town centre by the river. The premium reflects a combination of period housing stock, proximity to the countryside, and high demand from professional families. At nearly double the price of RG1, the 3.4% yield in RG4 reflects a market driven by capital appreciation rather than rental income.

House Price Growth in Reading
All six Reading postcodes delivered positive five-year growth, with RG31 Tilehurst leading at 15.6% and RG6 Earley the weakest at 2.9%. The five-year figure matters most for buy-to-let investors because it captures a full market cycle and filters out short-term noise. One-year growth can swing on a handful of transactions.
The one-year figures tell a more mixed story. Four postcodes show positive one-year growth while RG2 and RG6 recorded falls of 9.4% and 7.2% respectively.
| Area | 1 Year | 3 Years | 5 Years |
|---|---|---|---|
| RG31 (Tilehurst, Calcot) | 4.2% | 1.6% | 15.6% |
| RG30 (Tilehurst, Southcote) | 0.5% | 3.5% | 14.9% |
| RG1 (Town Centre) | 2.7% | -1.1% | 12.4% |
| RG4 (Caversham) | 4.5% | -0.7% | 11.0% |
| RG2 (Whitley, Shinfield) | -9.4% | -6.7% | 4.7% |
| RG6 (Earley, Lower Earley) | -7.2% | -4.7% | 2.9% |
The two Tilehurst postcodes (RG30 and RG31) have delivered the strongest five-year growth at 14.9% and 15.6%. These are Reading's western suburbs where inter-war and post-war housing stock has been steadily repriced. An investor who bought at £285,000 in RG30 five years ago would now hold a property asking £335,994. That is £50,000 in equity growth from an area that still offers Reading's lowest price per square foot.
RG2 Whitley and RG6 Earley are both in negative territory over one and three years. RG2 at -9.4% one-year and -6.7% three-year is the weakest performer in Reading. RG6 follows a similar pattern at -7.2% and -4.7%. Both postcodes delivered positive five-year growth (4.7% and 2.9%), but the recent trajectory is downward. New-build supply from large housing developments in these areas may be absorbing demand that would otherwise push existing stock prices higher.
RG4 Caversham shows an interesting split: strong one-year growth at 4.5% but negative three-year growth at -0.7%. That pattern suggests prices fell in 2022-2023 when interest rate rises hit the South East premium market hardest, and have since recovered. The five-year figure of 11.0% confirms Caversham's long-term appreciation trend despite the mid-period dip.
Monthly Property Sales in Reading
Reading records 201 property transactions per month across all six postcodes, with volumes ranging from 25 in RG6 to 42 in both RG1 and RG30. Transaction volumes reveal which areas have the deepest buyer pools and, for buy-to-let investors, whether you can sell when you need to. High volume and high turnover mean a liquid market.
Turnover rates vary more dramatically than volumes, from 14% in RG1 to 45% in RG6.
| Area | Sales Per Month | Turnover | Asking Price |
|---|---|---|---|
| RG1 (Town Centre) | 42 | 14% | £286,731 |
| RG30 (Tilehurst, Southcote) | 42 | 23% | £335,994 |
| RG31 (Tilehurst, Calcot) | 32 | 31% | £425,430 |
| RG4 (Caversham) | 32 | 32% | £569,103 |
| RG2 (Whitley, Shinfield) | 28 | 19% | £376,715 |
| RG6 (Earley, Lower Earley) | 25 | 45% | £497,615 |
RG1 Town Centre has the highest sales volume (42 per month) but the lowest turnover at just 14%. That tells you there is a large pool of stock in the town centre that rarely comes to market. Landlords and owner-occupiers hold long-term. The low turnover confirms that this is an area where properties are bought to keep, not to flip. For investors, low turnover alongside high volume means a deep market that absorbs new stock without price disruption.
RG6 Earley has the highest turnover at 45% despite the lowest sales volume of 25 per month. High turnover with low volume suggests a smaller total housing stock where a relatively high proportion trades each year. For exit planning, the 45% turnover means a willing buyer pool exists, but the lower absolute volume means fewer comparable transactions to benchmark a sale price against.
RG4 Caversham and RG31 Tilehurst both record 32 sales per month with similar turnover (32% and 31%). These two postcodes have the most balanced liquidity profiles in Reading. Sufficient volume to sell when needed, and turnover rates that suggest a healthy mix of long-term holders and active buyers.

Reading Rental Market Analysis
For investors weighing up whether rental property is a worthwhile investment in Reading, the data below breaks down average monthly rents and gross rental yields across all six postcodes.
Rental data is available for all 6 postcodes. Monthly rents range from £1,306 in RG30 to £2,127 in RG6 and gross yields range from 3.4% to 6.1%. If you are looking to build a property portfolio in the South East, Reading's combination of corporate tenant demand and transport links to London creates sustained rental pressure across the town.
Average Rent & Gross Rental Yields in Reading
Gross rental yields in Reading range from 3.4% in RG4 Caversham to 6.1% in RG1 Town Centre, a spread of 2.7 percentage points. Gross yield is calculated from the average asking price and average monthly rent for each postcode. It does not account for void periods, maintenance, management fees, or mortgage costs.
RG1 delivers the highest return at 6.1%, where monthly rents of £1,450 meet asking prices of £286,731. At the other end, RG4 Caversham at 3.4% reflects the highest asking prices in Reading absorbing rents of £1,619. That gap means the difference between a property that generates meaningful cash flow and one that relies on capital growth.
| Area | Average Monthly Rent | Average Asking Price | Gross Yield |
|---|---|---|---|
| RG1 (Town Centre) | £1,450 | £286,731 | 6.1% |
| RG2 (Whitley, Shinfield) | £1,629 | £376,715 | 5.2% |
| RG6 (Earley, Lower Earley) | £2,127 | £497,615 | 5.1% |
| RG30 (Tilehurst, Southcote) | £1,306 | £335,994 | 4.7% |
| RG31 (Tilehurst, Calcot) | £1,486 | £425,430 | 4.2% |
| RG4 (Caversham) | £1,619 | £569,103 | 3.4% |
Three postcodes sit above 5% gross yield: RG1, RG2, and RG6. Each taps into a different tenant pool. RG1 Town Centre draws young professionals and students near the university and station. RG2 Whitley attracts tenants near the south Reading business parks. RG6 Earley benefits from the University of Reading campus and family demand in a well-established residential area. That diversity of demand across three different parts of the town is a structural strength.
RG6 commands Reading's highest absolute rent at £2,127 per month. That figure is significantly above any other postcode. Earley and Lower Earley's combination of university proximity, good schools, and suburban family housing drives premium rents. The yield of 5.1% comes despite asking prices of £497,615, which demonstrates how rental income at this level can still generate above-average returns from expensive stock.
RG30 and RG31 in Tilehurst sit at 4.7% and 4.2% respectively. These are Reading's suburban growth postcodes with the strongest five-year price appreciation (14.9% and 15.6%). Investors in Tilehurst are trading some yield for capital growth. The rents (£1,306 and £1,486) are among Reading's most affordable, but price growth has outpaced most other postcodes over five years.
Is Reading Rent High?
Rent in Reading consumes between 38.5% and 62.7% of the local median gross monthly salary, with all six postcodes above the 30% affordability benchmark. For tenants, this determines whether they can sustain payments long-term. For landlords, areas where rent consumes a lower share of income tend to produce more reliable tenants and fewer arrears.
The median gross weekly salary in Reading is £782.70, which equates to £3,392 per month or £40,700 per year. This is below the South East regional median of £800.30 per week but above the Great Britain median of £752.40 per week. Data from the Nomis Labour Market Profile (ASHE 2025).
Reading's high rents relative to local earnings reflect the town's position in the South East, where rents are structurally higher than in most English towns.
| Rank | Area | Rent as % of Income |
|---|---|---|
| 1 | RG6 (Earley, Lower Earley) | 62.7% |
| 2 | RG2 (Whitley, Shinfield) | 48.0% |
| 3 | RG4 (Caversham) | 47.7% |
| 4 | RG31 (Tilehurst, Calcot) | 43.8% |
| 5 | RG1 (Town Centre) | 42.8% |
| 6 | RG30 (Tilehurst, Southcote) | 38.5% |
RG6 Earley at 62.7% is the most stretched on this measure. The £2,127 monthly rent is by far Reading's highest, and it pushes the ratio well beyond the 30% benchmark. In practice, tenants in RG6 are typically dual-income professional households and university staff earning significantly above Reading's median. The town-wide median salary understates what tenants in this postcode actually earn.
RG30 Tilehurst at 38.5% has the lowest ratio in Reading. Rents of £1,306 per month are Reading's most affordable. For landlords, this affordability translates to a tenant pool that can sustain rent payments without financial pressure, even on a single income near the local median. RG30 may not deliver the highest yield (4.7%), but the affordability ratio suggests stable, long-term tenancies.
RG1 Town Centre at 42.8% sits in the middle of Reading's range. The town centre draws tenants with a range of incomes, from students and young professionals to corporate workers relocating. The median salary is a blunt tool for this postcode because the tenant mix is broader than the suburban postcodes.
Thinking of Buying?
We have off-market investment properties averaging 8%+ annual yield.
View Property DealsBuy-to-Let Considerations
Are Reading House Prices High? Price-to-Earnings Ratios
Purchasing a property in Reading requires between 7.0 and 14.0 times the local median annual salary of £40,700. The price-to-earnings ratio compares a postcode's average asking price to local earnings. The national benchmark is 7.5x, calculated from England's average sold price of £291,865 against Great Britain's median annual salary of £39,125.
Only one of Reading's six postcodes sits below that national benchmark. RG1 Town Centre at 7.0x is the only postcode where prices are more affordable than the national average relative to local earnings. The remaining five postcodes range from 8.3x (RG30) to 14.0x (RG4). This is based on the Nomis Labour Market Profile for Reading showing the median gross annual income for Reading residents is £40,700. This reflects Reading's position as a South East town where property prices run ahead of even above-average local earnings.
| Rank | Area | Price-to-Earnings Ratio |
|---|---|---|
| 1 | RG1 (Town Centre) | 7.0x |
| 2 | RG30 (Tilehurst, Southcote) | 8.3x |
| 3 | RG2 (Whitley, Shinfield) | 9.3x |
| 4 | RG31 (Tilehurst, Calcot) | 10.5x |
| 5 | RG6 (Earley, Lower Earley) | 12.2x |
| 6 | RG4 (Caversham) | 14.0x |
RG1 at 7.0x is the only postcode where the ratio sits below the national benchmark. At £286,731 against earnings of £40,700, the town centre is the most accessible entry point in Reading on this measure. It is also where yield, price per square foot, and asking price all converge to produce the strongest buy-to-let numbers. Investors who factor in stamp duty costs will find the lower purchase price in RG1 also reduces transaction costs.
RG4 Caversham at 14.0x is nearly double the national benchmark. A property in Caversham costs 14 years of Reading's median salary. This is firmly in owner-occupier territory where capital growth drives returns rather than rental yield. The 3.4% gross yield in RG4 confirms that this postcode serves a different investment thesis from the town centre.
The jump from RG31 (10.5x) to RG6 (12.2x) to RG4 (14.0x) maps directly onto the asking price gradient. As prices rise above £425,000, the ratios stretch beyond the point where single-earner mortgage affordability works. These are dual-income postcodes where the price-to-earnings ratio overstates the stretch because both partners contribute. The ratio is most useful for comparing postcodes within Reading rather than against the national benchmark.
Deposit Requirements in Reading
Reading's 30% buy-to-let deposit range runs from £86,019 in RG1 Town Centre to £170,731 in RG4 Caversham, a spread of £84,712. Most UK lenders require a 30% deposit for buy-to-let mortgages. The table below shows what that means in practice across Reading's six postcodes. Understanding the full costs of buy-to-let including deposits, stamp duty, and legal fees is an essential part of investment planning.
Three postcodes require deposits under £115,000, while the remaining three sit above £127,000.
| Rank | Area | 30% Deposit Required |
|---|---|---|
| 1 | RG1 (Town Centre) | £86,019 |
| 2 | RG30 (Tilehurst, Southcote) | £100,798 |
| 3 | RG2 (Whitley, Shinfield) | £113,014 |
| 4 | RG31 (Tilehurst, Calcot) | £127,629 |
| 5 | RG6 (Earley, Lower Earley) | £149,284 |
| 6 | RG4 (Caversham) | £170,731 |
RG1 at £86,019 is Reading's lowest deposit requirement. This is the same postcode that delivers the highest yield (6.1%), the lowest asking price (£286,731), and the second-cheapest price per square foot (£393). For investors building a portfolio, the lower capital requirement in RG1 allows room for diversification across multiple properties or locations. Browse buy-to-let properties for sale in Reading and the surrounding area.
The step from RG2 (£113,014) to RG31 (£127,629) marks where deposits cross £125,000. That is a meaningful threshold for many investors and separates the three most accessible postcodes (RG1, RG30, RG2) from the three premium postcodes (RG31, RG6, RG4). The three affordable postcodes deliver yields of 6.1% (RG1), 5.2% (RG2), and 4.7% (RG30), with two of the three ranking among Reading's highest-yielding postcodes. Capital efficiency and yield performance align at the lower end of the deposit range.
RG4 Caversham at £170,731 requires nearly double the deposit of RG1. An investor allocating £170,731 to a single Caversham property is deploying almost the same capital required for two RG1 deposits (2 × £86,019 = £172,038). The yield differential (6.1% vs 3.4%) compounds that capital efficiency gap over time. Investors exploring ways to reduce upfront capital requirements can read about no-deposit investment property strategies.

What the Reading Data Tells Buy-to-Let Investors
Reading's six postcodes split into two distinct investment tiers based on yield, price, and growth patterns. RG1 Town Centre, RG2 Whitley, and RG30 Tilehurst form the yield tier where gross returns range from 4.7% to 6.1% and asking prices sit between £286,731 and £376,715. RG4 Caversham, RG6 Earley, and RG31 Tilehurst form the growth tier where five-year appreciation and absolute rents are higher but yields range from 3.4% to 5.1%.
RG1 Town Centre is the postcode where multiple metrics converge. It ranks first for yield (6.1%), first for lowest asking price (£286,731), first for lowest deposit (£86,019), second for price per square foot (£393), and first for transaction volume (42 per month). It is also the only Reading postcode with a price-to-earnings ratio below the national benchmark (7.0x vs 7.5x). The Station Hill regeneration has added 598 build-to-rent apartments and 275,000 sq ft of office space to this postcode, creating both additional rental supply and employment demand in the same location.
RG30 Tilehurst occupies a different position: lower yield (4.7%) but the strongest price per square foot value (£385) and the second-strongest five-year growth (14.9%). Rent affordability is the most comfortable in Reading at 38.5% of income. For investors focused on capital appreciation with stable tenancies, RG30 offers a different return profile from the town centre.
RG6 Earley delivers Reading's highest absolute rent at £2,127 per month. That is £498 more than the next highest postcode (RG2 at £1,629). The premium reflects family and professional tenant demand near the University of Reading campus. The trade-off is negative one-year (-7.2%) and three-year (-4.7%) price growth, which suggests the postcode's asking prices may have overshot and are correcting. For investors seeking off-market opportunities, motivated sellers in a correcting postcode can create entry points below the headline asking price.
Reading's overall position in the UK buy-to-let landscape is defined by its South East economics. Rents are high because local earnings are high. Prices are above the England average but below the South East average. The 6.1% top yield in RG1 is a figure more commonly seen in northern English towns than in the commuter belt. That yield, backed by corporate employment and fast London rail access, is what sets Reading apart from its South East peers.
How Reading Compares
Reading has the lowest mean asking price (£415,265) and the highest top gross yield (6.1%) of five South East and Thames Valley towns. The table below compares Reading with four nearby locations across mean asking price, mean monthly rent, and top gross yield. All data is from March 2026.
| Location | Mean Asking Price | Mean Monthly Rent | Top Gross Yield |
|---|---|---|---|
| Reading | £415,265 | £1,603 | 6.1% |
| Basingstoke | £489,238 | £1,472 | 5.7% |
| Oxford | £518,350 | £1,776 | 5.4% |
| Slough | £421,952 | £1,544 | 4.9% |
| Bracknell | £555,697 | £1,934 | 4.6% |
Reading has the lowest mean asking price and the highest top gross yield of all five locations. At £415,265, Reading's mean asking price is £6,687 below Slough (the next cheapest) and £140,432 below Bracknell (the most expensive). The 6.1% top yield in RG1 is 0.4 percentage points above Basingstoke's 5.7% and 1.5 points above Bracknell's 4.6%.
Oxford has the second-highest mean rent at £1,776 but only the third-highest yield at 5.4%. Oxford's premium asking prices (£518,350) absorb the higher rents and compress the yield below Reading's. Bracknell shows a similar pattern: the highest rents of the five locations (£1,934) but the lowest yield (4.6%) because asking prices of £555,697 are the highest in the group.
Basingstoke is Reading's closest competitor on yield at 5.7%. The difference is that Basingstoke's mean asking price is £489,238, which is £73,973 higher than Reading. Both towns draw from the M4 corridor employment base, but Reading's town centre pricing creates a lower entry point that pushes its top yield above Basingstoke's. Investors comparing the two will also want to consider that Reading has direct Elizabeth Line rail services to London, which Basingstoke does not.
Frequently Asked Questions
What is the average rent in Reading?
Average monthly rents in Reading range from £1,306 in RG30 (Tilehurst, Southcote) to £2,127 in RG6 (Earley, Lower Earley). The mean monthly rent across all six postcodes is £1,603. RG6's rent is significantly higher than other postcodes due to family housing demand near the University of Reading and established suburban schools. Data from PropertyData, March 2026.
What areas are in Reading for property investment?
Reading has six postcodes for property investment: RG1 (Town Centre), RG2 (Whitley, Shinfield), RG4 (Caversham), RG6 (Earley, Lower Earley), RG30 (Tilehurst, Southcote), and RG31 (Tilehurst, Calcot). All fall under the Reading unitary authority (ONS code E06000038). Asking prices range from £286,731 (RG1) to £569,103 (RG4) and gross yields from 3.4% (RG4) to 6.1% (RG1). Nearby towns covered in our guides include Swindon, High Wycombe, and Guildford.
Which Reading postcodes have the highest rental yields?
RG1 (Town Centre) at 6.1%, RG2 (Whitley, Shinfield) at 5.2%, and RG6 (Earley, Lower Earley) at 5.1% are Reading's three highest-yielding postcodes. These three postcodes each draw from different tenant pools: town centre professionals, south Reading business park workers, and university-area families. The lowest yield is RG4 (Caversham) at 3.4%, where premium asking prices of £569,103 compress the return despite monthly rents of £1,619.
What are the most expensive areas of Reading?
RG4 (Caversham) is Reading's most expensive postcode at £569,103 average asking price. RG6 (Earley, Lower Earley) follows at £497,615 with the highest price per square foot at £476. Both postcodes sit north and east of the town centre in established residential areas. At the other end, RG1 (Town Centre) at £286,731 and RG30 (Tilehurst) at £335,994 are Reading's most affordable postcodes by asking price.
How much deposit do I need to buy an investment property in Reading?
Between £86,019 and £170,731, based on a standard 30% buy-to-let mortgage deposit. Reading's deposit range runs from £86,019 in RG1 (Town Centre) to £170,731 in RG4 (Caversham). Three postcodes require deposits under £115,000: RG1 (£86,019), RG30 (£100,798), and RG2 (£113,014). These are the same three postcodes that deliver yields of 6.1%, 5.2%, and 4.7%.
Is Reading a city in the UK?
No, Reading is officially a large town, not a city. It is a unitary authority in Berkshire, South East England, with a population of 174,224 (2021 Census). Reading applied for city status during the 2022 Platinum Jubilee civic honours but was unsuccessful. Despite its size and economic output, Reading remains one of the largest towns in the UK without city status. For property investors, Reading's unitary authority status means all HM Land Registry data is reported at the local authority level, giving a complete picture of sold prices across all six postcodes.