
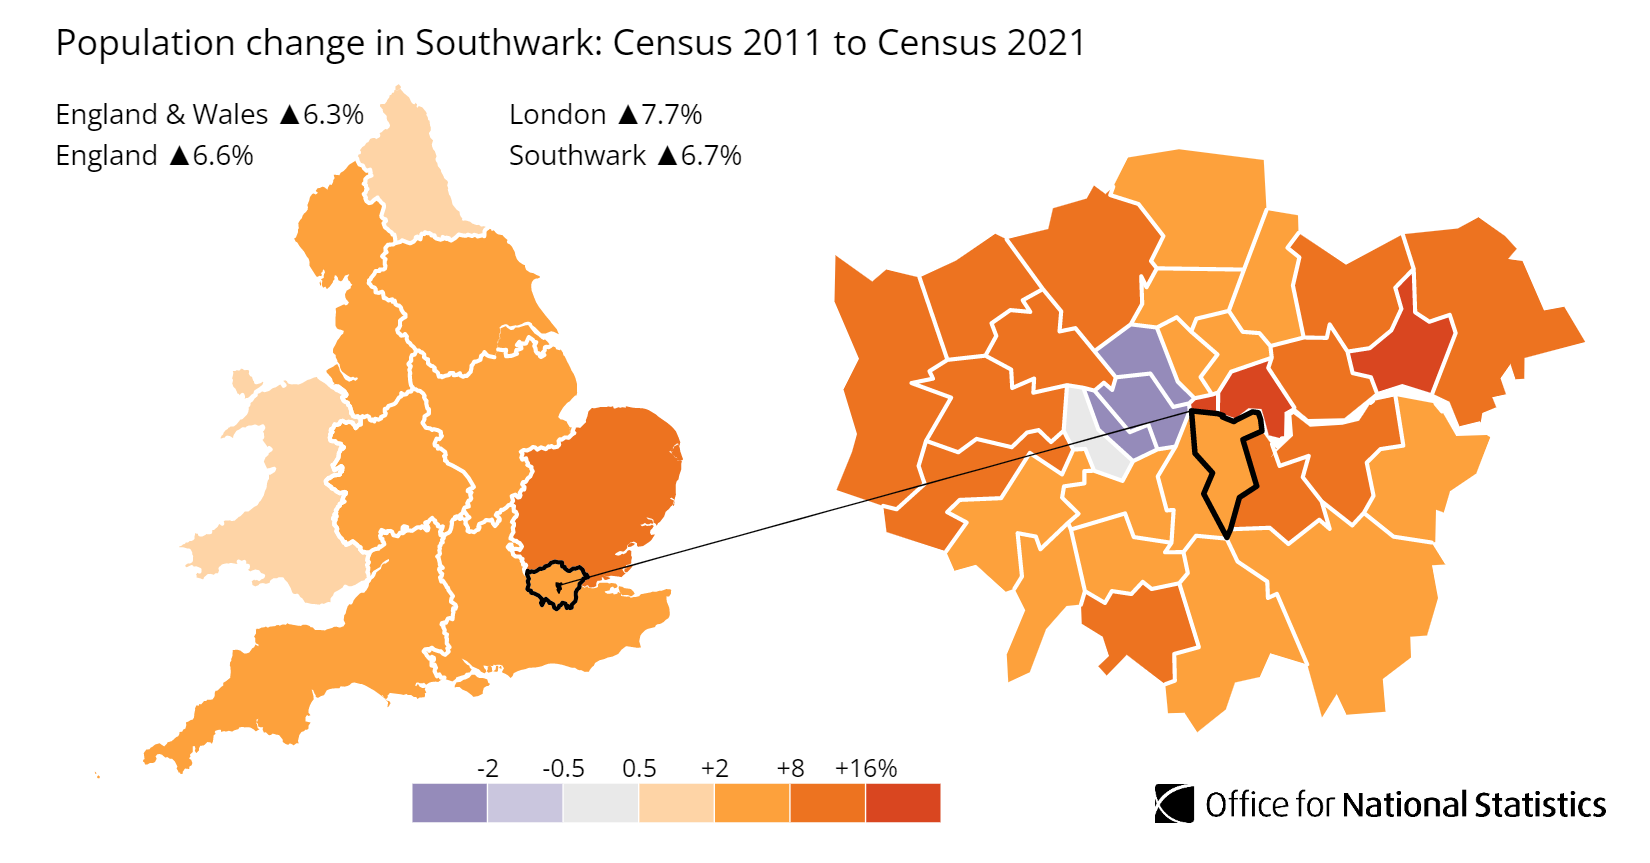
Southwark is an inner-London borough on the south bank of the Thames. Average sold prices across Southwark sit at £572,455 on the HM Land Registry House Price Index, 97.4% above the England average of £289,946 yet barely 3.6% above the wider London figure of £552,655. That places Southwark firmly in inner-London pricing without the prime premium of the boroughs to the west, and the gap between its cheapest postcode and its dearest tells the real story: SE16 at a £473,663 asking price sits next to SE1 at £714,030, two very different markets inside one borough. The local population grew 6.71% between the 2011 and 2021 censuses, from 288,283 to 307,637 residents.
The shape of Southwark's recent price history is the thing to know first. The borough reached an all-time high of £622,328 in December 2020 and has since drifted back to £572,455, about 8.0% below that peak, leaving the market essentially flat over five years and down over ten. So the income return and the postcode split carry more of the story than the borough-wide average does. Top gross yields reach 6.0% in SE16, while the two Dulwich postcodes yield 4.2% and 4.1%.
This guide covers the London Borough of Southwark (ONS code E09000028) across postcodes SE1, SE5, SE15, SE16, SE17, SE21, and SE22. Southwark runs south from the Thames at Borough and Bankside through Walworth, Camberwell and Peckham down to Dulwich, sharing borders with Lambeth to the west and Lewisham to the south-east.
Article updated: July 2026
Why Invest in Southwark?
Southwark added 19,354 residents between the 2011 and 2021 censuses, a 6.71% rise from 288,283 to 307,637, slightly ahead of the 6.3% England and Wales average. The borough packs a lot into a narrow strip running south from the river: the cultural draw of Bankside and Borough at the top, the dense residential and student markets of Walworth and Camberwell through the middle, and the leafy owner-occupier streets of Dulwich at the bottom. That range is what gives Southwark its two-tier character, and it runs through every table in this guide.
The local employment rate of 72.1% sits below both the London figure of 74.9% and the Great Britain figure of 75.6%, and unemployment runs at 9.5%. The tenure table further down shows the mix behind those numbers: social renting runs from 13.2% of households in SE21 up to 48.5% in SE17, and private renting from 17.9% to 37.7%, so the balance of who lives where shifts sharply from one postcode to the next.
Median gross weekly earnings for Southwark residents are £939.90, and the median annual salary is £48,681. That is above the London median of £902.70 a week and well clear of the Great Britain figure of £766.60. Rents run from £2,172 a month in Peckham up to £2,920 in the SE1 riverside postcode, and every one of them takes more than half of that median salary, which the affordability table below sets out. The London College of Communication, part of the University of the Arts London, sits at Elephant and Castle in SE1, and King's College London has its Denmark Hill campus in SE5.
Southwark Economic Summary
- Population: 307,637 (2021 Census). Growth of 6.71% from 2011.
- Median annual salary: £48,681 (local), £46,415 (London), £39,125 (Great Britain)
- Employment rate: 72.1% (local), 74.9% (London), 75.6% (Great Britain)
- Unemployment rate: 9.5% (local)
- Key employment sectors: Professional and financial services, health, education, culture and hospitality, public administration
Source: ONS Census 2021, Nomis Labour Market Profile (ASHE 2025, residence-based earnings)
Regeneration and Investment in Southwark
Southwark has three large regeneration programmes running at once: Canada Water, the Old Kent Road Opportunity Area, and Elephant & Castle, between them planned to deliver well over 25,000 new homes. The investment is concentrated in the riverside and central postcodes, which is also where the growth table below shows the biggest falls since 2021.
- Canada Water Masterplan (First phase complete, up to 4,184 homes): British Land and AustralianSuper are delivering a 53-acre town centre on the SE16 dock basin through a 50:50 joint venture, working with Southwark Council, with up to 4,184 new homes under the revised masterplan approved in March 2026, around 2.5 million square feet of workspace, a new high street, a leisure centre and a public park. The affordable commitment is 20% in the next phase and a minimum of 9% across the whole masterplan. The first phase is complete, with 186 homes at The Founding and 79 affordable homes at Roberts Close, and the next phase is expected to start on site from 2027 (British Land). Updates at Southwark Council.
- Old Kent Road Opportunity Area (Long-term, around 20,000 homes): The Mayor of London has designated the Old Kent Road corridor an opportunity area planned for roughly 20,000 new homes over the coming decades, contingent in its later phases on the proposed Bakerloo line extension from Elephant & Castle with new tube stations along the route. The first phase supports up to 9,500 homes, with the balance tied to the rail upgrade. This sits behind SE15 and SE1 and would reshape transport access across the eastern half of the borough. Details at London City Hall.
- Elephant & Castle and Elephant Park (Active, around 3,000 homes): Lendlease's Elephant Park is the centrepiece of a long-running £4 billion programme remaking the Elephant & Castle district in SE17 and SE1, delivering around 3,000 new homes and a new central London park. A further town-centre scheme adds 485 homes alongside a major upgrade to the Underground station that makes provision for the Bakerloo line extension, plus a new building for the London College of Communication, opening in September 2027 just across the road from its current site. Updates at Southwark Council.
Southwark Property Market Analysis
Average property prices in Southwark have risen 630.6% since January 1995, from £78,355 to £572,455. The sections below trace that path through the borough's actual cycles, then break down current postcode-level data for sold prices, price per square foot, asking prices, growth trends, and monthly transaction volumes.
When was the last house price crash in Southwark?
Southwark's sold prices are recorded by HM Land Registry at borough level under ONS code E09000028, and the House Price Index runs from January 1995 to the latest reading in April 2026, covering 31 years of market cycles.
The 1995 to 2007 climb: Southwark started at £78,355 in January 1995 and had more than doubled to £176,926 by December 2000, then reached £259,753 by December 2005. The pre-crash market topped out at £354,862 in December 2007, more than four times its 1995 level.
2008 to 2009, the financial crisis: Prices fell from the December 2007 peak of £354,862 to a trough of £290,218 in May 2009, a drop of 18.2% over 17 months, with the worst year-on-year reading at -16.2% in June 2009.
Recovery, 2009 to 2011: The bounce came fast. Prices climbed back through 2010 and passed the December 2007 pre-crash peak by February 2011, when the average reached £361,082. That recovery took just over three years.
2012 to 2016, the post-crisis surge: Prices ran from £401,488 in December 2012 to £447,861 by December 2013, with annual growth above 11%, and reached £588,479 by December 2016. That is a rise of 46.6% across four years.
2017 to 2019, the plateau: Growth stalled. The average barely moved from £586,997 in December 2019 against the £588,479 of three years earlier.
2020, the all-time high: Prices reached £591,135 by June 2020 and went on to an all-time high of £622,328 in December 2020. That December 2020 peak remains the highest reading in the borough's 31-year record.
2021 to present, the give-back: Since that high the market has eased rather than crashed. Prices slipped to £597,779 by September 2022, dropped to £565,336 by December 2023, and have settled at £572,455 by April 2026. That leaves Southwark about 8.0% below its December 2020 peak, roughly flat over five years and slightly lower over ten.
Long-term growth summary:
- 5 years (April 2021 to April 2026): 0.9% growth (£567,605 to £572,455)
- 10 years (April 2016 to April 2026): -3.7% (£594,187 to £572,455)
- 15 years (April 2011 to April 2026): 63.6% growth (£349,912 to £572,455)
- 20 years (April 2006 to April 2026): 115.1% growth (£266,154 to £572,455)
- 31 years (January 1995 to April 2026): 630.6% growth (£78,355 to £572,455)
The shape of those numbers is the key to Southwark today. The 31-year and 20-year returns are strong, but the five-year and ten-year readings are flat to slightly negative. An investor who bought at the December 2020 high is sitting about 8.0% down on the Land Registry average, while one who bought at the end of 2012, when the average was £401,488, is about 43% up. Over the last five and ten years the borough-wide average has moved little either way.
- All property types
- Detached
- Semi-detached
- Terraced
- Flats
Source: HM Land Registry House Price Index
| Year | All property types | Detached | Semi-detached | Terraced | Flats |
|---|---|---|---|---|---|
| 1995-01 | £78,355 | £223,577 | £150,009 | £95,652 | £68,829 |
| 1995-02 | £74,793 | £209,608 | £142,911 | £91,726 | £65,519 |
| 1995-03 | £75,906 | £212,121 | £144,483 | £93,054 | £66,593 |
| 1995-04 | £72,802 | £201,155 | £137,989 | £89,305 | £63,938 |
| 1995-05 | £74,356 | £205,852 | £141,005 | £90,894 | £65,494 |
| 1995-06 | £74,051 | £203,570 | £140,361 | £90,218 | £65,454 |
| 1995-07 | £77,362 | £213,841 | £147,298 | £94,494 | £68,127 |
| 1995-08 | £75,632 | £210,531 | £144,228 | £92,683 | £66,360 |
| 1995-09 | £73,256 | £206,030 | £140,538 | £90,079 | £63,939 |
| 1995-10 | £70,277 | £197,792 | £134,668 | £85,864 | £61,715 |
| 1995-11 | £71,246 | £198,597 | £135,928 | £86,376 | £63,106 |
| 1995-12 | £72,017 | £199,421 | £136,614 | £86,944 | £64,146 |
| 1996-01 | £75,894 | £209,046 | £143,630 | £91,755 | £67,572 |
| 1996-02 | £78,345 | £214,515 | £148,299 | £94,828 | £69,711 |
| 1996-03 | £79,489 | £217,675 | £150,739 | £96,186 | £70,715 |
| 1996-04 | £80,333 | £217,930 | £151,654 | £96,896 | £71,840 |
| 1996-05 | £79,539 | £215,570 | £149,817 | £96,263 | £70,964 |
| 1996-06 | £81,273 | £219,302 | £152,772 | £98,491 | £72,493 |
| 1996-07 | £81,068 | £221,580 | £153,669 | £98,785 | £71,664 |
| 1996-08 | £81,267 | £224,852 | £154,829 | £99,134 | £71,584 |
| 1996-09 | £81,842 | £228,177 | £156,438 | £99,967 | £71,881 |
| 1996-10 | £81,660 | £228,313 | £156,163 | £99,642 | £71,764 |
| 1996-11 | £85,247 | £236,652 | £162,627 | £103,906 | £75,093 |
| 1996-12 | £85,226 | £235,162 | £162,551 | £103,827 | £75,150 |
| 1997-01 | £85,208 | £234,460 | £162,569 | £104,112 | £74,932 |
| 1997-02 | £83,084 | £229,652 | £158,267 | £101,224 | £73,080 |
| 1997-03 | £84,597 | £234,726 | £160,688 | £103,180 | £74,243 |
| 1997-04 | £87,204 | £242,181 | £165,416 | £106,230 | £76,600 |
| 1997-05 | £91,060 | £254,389 | £174,017 | £111,443 | £79,651 |
| 1997-06 | £94,419 | £266,772 | £181,841 | £116,023 | £82,250 |
| 1997-07 | £94,369 | £267,493 | £182,350 | £116,352 | £81,988 |
| 1997-08 | £96,774 | £274,754 | £187,123 | £119,474 | £83,996 |
| 1997-09 | £98,707 | £279,885 | £190,781 | £121,636 | £85,778 |
| 1997-10 | £99,512 | £282,776 | £192,631 | £122,500 | £86,502 |
| 1997-11 | £95,509 | £272,633 | £185,116 | £117,450 | £83,040 |
| 1997-12 | £93,826 | £266,730 | £181,637 | £115,199 | £81,684 |
| 1998-01 | £95,121 | £271,586 | £184,129 | £117,007 | £82,706 |
| 1998-02 | £96,893 | £273,909 | £186,546 | £118,757 | £84,439 |
| 1998-03 | £99,186 | £279,774 | £190,726 | £121,454 | £86,425 |
| 1998-04 | £102,745 | £288,362 | £197,661 | £125,709 | £89,572 |
| 1998-05 | £103,457 | £290,939 | £199,372 | £127,143 | £89,992 |
| 1998-06 | £107,789 | £303,295 | £207,590 | £132,565 | £93,736 |
| 1998-07 | £107,924 | £304,814 | £208,572 | £133,134 | £93,679 |
| 1998-08 | £110,216 | £313,461 | £213,763 | £136,067 | £95,566 |
| 1998-09 | £108,275 | £311,130 | £211,158 | £134,176 | £93,624 |
| 1998-10 | £109,283 | £312,714 | £211,814 | £134,543 | £94,850 |
| 1998-11 | £111,683 | £318,364 | £215,839 | £136,612 | £97,255 |
| 1998-12 | £113,465 | £319,533 | £217,960 | £137,860 | £99,217 |
| 1999-01 | £115,556 | £325,555 | £222,082 | £140,348 | £101,054 |
| 1999-02 | £118,394 | £333,814 | £227,718 | £144,162 | £103,412 |
| 1999-03 | £120,312 | £339,252 | £231,277 | £146,515 | £105,071 |
| 1999-04 | £121,060 | £340,097 | £232,575 | £147,998 | £105,573 |
| 1999-05 | £119,540 | £332,643 | £228,694 | £146,167 | £104,314 |
| 1999-06 | £118,551 | £330,826 | £227,347 | £145,660 | £103,207 |
| 1999-07 | £120,459 | £338,641 | £231,706 | £148,422 | £104,691 |
| 1999-08 | £126,979 | £360,759 | £245,617 | £157,276 | £110,016 |
| 1999-09 | £137,907 | £394,105 | £266,931 | £170,735 | £119,479 |
| 1999-10 | £144,538 | £410,975 | £278,615 | £177,753 | £125,649 |
| 1999-11 | £143,271 | £406,630 | £275,508 | £175,581 | £124,767 |
| 1999-12 | £140,728 | £393,551 | £268,671 | £171,716 | £122,923 |
| 2000-01 | £140,782 | £396,910 | £270,717 | £172,463 | £122,645 |
| 2000-02 | £150,364 | £423,927 | £288,373 | £184,219 | £130,980 |
| 2000-03 | £152,883 | £436,399 | £295,311 | £188,217 | £132,737 |
| 2000-04 | £155,598 | £439,582 | £298,076 | £191,002 | £135,355 |
| 2000-05 | £153,952 | £433,429 | £295,491 | £188,757 | £133,964 |
| 2000-06 | £158,740 | £443,400 | £303,468 | £193,799 | £138,401 |
| 2000-07 | £164,907 | £466,531 | £318,273 | £201,680 | £143,538 |
| 2000-08 | £172,023 | £487,017 | £332,134 | £209,271 | £149,997 |
| 2000-09 | £179,098 | £510,539 | £345,931 | £217,235 | £156,296 |
| 2000-10 | £183,701 | £522,283 | £353,378 | £221,651 | £160,662 |
| 2000-11 | £181,536 | £517,010 | £347,954 | £218,447 | £158,960 |
| 2000-12 | £176,926 | £498,155 | £337,056 | £211,893 | £155,296 |
| 2001-01 | £178,792 | £499,649 | £338,984 | £214,393 | £156,956 |
| 2001-02 | £178,861 | £499,624 | £339,356 | £214,891 | £156,933 |
| 2001-03 | £180,882 | £508,173 | £344,250 | £218,179 | £158,450 |
| 2001-04 | £180,361 | £507,449 | £342,300 | £217,408 | £158,075 |
| 2001-05 | £189,124 | £529,199 | £357,429 | £228,072 | £165,810 |
| 2001-06 | £196,784 | £544,956 | £370,192 | £236,789 | £172,788 |
| 2001-07 | £196,979 | £546,616 | £372,032 | £237,509 | £172,745 |
| 2001-08 | £192,828 | £535,284 | £364,192 | £232,500 | £169,103 |
| 2001-09 | £191,409 | £536,460 | £361,468 | £230,532 | £167,913 |
| 2001-10 | £194,576 | £544,651 | £366,590 | £233,453 | £170,996 |
| 2001-11 | £198,857 | £554,624 | £374,827 | £237,702 | £175,024 |
| 2001-12 | £198,817 | £548,133 | £373,531 | £236,545 | £175,415 |
| 2002-01 | £200,514 | £548,269 | £375,251 | £237,587 | £177,294 |
| 2002-02 | £201,802 | £548,162 | £376,134 | £239,444 | £178,423 |
| 2002-03 | £202,578 | £551,866 | £378,521 | £240,781 | £178,930 |
| 2002-04 | £207,254 | £560,013 | £385,671 | £245,787 | £183,325 |
| 2002-05 | £211,228 | £569,308 | £392,595 | £249,892 | £187,052 |
| 2002-06 | £215,648 | £572,611 | £398,237 | £255,025 | £191,163 |
| 2002-07 | £215,294 | £574,306 | £398,874 | £256,036 | £190,345 |
| 2002-08 | £218,473 | £582,371 | £404,403 | £259,776 | £193,187 |
| 2002-09 | £221,626 | £597,486 | £412,275 | £263,966 | £195,709 |
| 2002-10 | £221,519 | £594,987 | £411,495 | £262,535 | £196,045 |
| 2002-11 | £221,831 | £598,129 | £411,373 | £262,308 | £196,525 |
| 2002-12 | £220,260 | £589,682 | £407,758 | £259,369 | £195,518 |
| 2003-01 | £224,002 | £597,978 | £412,940 | £264,242 | £198,790 |
| 2003-02 | £219,342 | £578,912 | £404,682 | £258,476 | £194,755 |
| 2003-03 | £220,362 | £579,368 | £406,273 | £260,061 | £195,568 |
| 2003-04 | £225,189 | £586,021 | £416,497 | £265,447 | £199,913 |
| 2003-05 | £234,036 | £607,949 | £433,151 | £277,604 | £207,235 |
| 2003-06 | £234,590 | £609,869 | £432,041 | £277,835 | £207,957 |
| 2003-07 | £233,991 | £608,763 | £431,105 | £277,657 | £207,255 |
| 2003-08 | £233,300 | £607,906 | £429,570 | £276,566 | £206,732 |
| 2003-09 | £235,984 | £616,264 | £437,536 | £281,682 | £208,370 |
| 2003-10 | £232,981 | £606,310 | £429,680 | £277,905 | £205,898 |
| 2003-11 | £234,004 | £606,250 | £430,943 | £278,501 | £207,035 |
| 2003-12 | £236,619 | £606,509 | £432,861 | £280,339 | £209,907 |
| 2004-01 | £238,308 | £612,863 | £437,690 | £282,946 | £211,129 |
| 2004-02 | £240,816 | £619,637 | £442,895 | £286,740 | £213,058 |
| 2004-03 | £246,253 | £632,173 | £453,176 | £294,171 | £217,526 |
| 2004-04 | £248,670 | £632,360 | £457,004 | £297,831 | £219,513 |
| 2004-05 | £252,860 | £632,816 | £461,991 | £303,069 | £223,300 |
| 2004-06 | £250,221 | £621,467 | £456,271 | £299,837 | £221,041 |
| 2004-07 | £252,671 | £628,621 | £462,153 | £303,311 | £223,015 |
| 2004-08 | £252,356 | £634,222 | £463,476 | £303,300 | £222,545 |
| 2004-09 | £254,773 | £645,789 | £469,838 | £306,914 | £224,400 |
| 2004-10 | £256,598 | £647,443 | £469,113 | £307,748 | £226,512 |
| 2004-11 | £257,349 | £646,069 | £468,381 | £308,031 | £227,423 |
| 2004-12 | £253,422 | £629,446 | £456,884 | £302,296 | £224,406 |
| 2005-01 | £252,807 | £626,653 | £454,969 | £302,098 | £223,758 |
| 2005-02 | £249,520 | £619,781 | £450,308 | £298,749 | £220,630 |
| 2005-03 | £255,442 | £635,056 | £462,544 | £306,652 | £225,605 |
| 2005-04 | £258,735 | £640,832 | £469,279 | £310,886 | £228,416 |
| 2005-05 | £260,634 | £641,396 | £470,093 | £312,924 | £230,301 |
| 2005-06 | £259,880 | £637,663 | £467,823 | £312,623 | £229,528 |
| 2005-07 | £258,001 | £636,021 | £465,419 | £310,675 | £227,726 |
| 2005-08 | £261,780 | £648,802 | £472,629 | £315,788 | £230,878 |
| 2005-09 | £264,041 | £659,525 | £477,941 | £318,812 | £232,710 |
| 2005-10 | £262,772 | £654,874 | £473,794 | £317,120 | £231,725 |
| 2005-11 | £259,912 | £645,392 | £468,723 | £313,831 | £229,170 |
| 2005-12 | £259,753 | £638,234 | £465,481 | £312,780 | £229,428 |
| 2006-01 | £260,445 | £641,994 | £468,403 | £314,538 | £229,712 |
| 2006-02 | £261,327 | £641,874 | £469,900 | £315,713 | £230,405 |
| 2006-03 | £262,645 | £649,914 | £475,987 | £318,863 | £230,950 |
| 2006-04 | £266,154 | £654,510 | £481,314 | £323,097 | £234,100 |
| 2006-05 | £274,591 | £676,543 | £496,642 | £333,158 | £241,546 |
| 2006-06 | £278,641 | £686,156 | £503,216 | £337,719 | £245,205 |
| 2006-07 | £285,862 | £706,551 | £518,179 | £348,058 | £251,171 |
| 2006-08 | £286,658 | £709,687 | £521,628 | £350,969 | £251,415 |
| 2006-09 | £288,904 | £717,704 | £527,255 | £354,390 | £253,188 |
| 2006-10 | £296,101 | £736,270 | £539,067 | £361,867 | £259,797 |
| 2006-11 | £297,566 | £740,233 | £541,796 | £363,240 | £261,160 |
| 2006-12 | £303,529 | £754,917 | £552,087 | £370,818 | £266,354 |
| 2007-01 | £298,862 | £744,800 | £544,938 | £365,581 | £262,116 |
| 2007-02 | £304,501 | £760,849 | £554,128 | £371,092 | £267,339 |
| 2007-03 | £319,437 | £802,102 | £583,363 | £390,305 | £280,176 |
| 2007-04 | £333,201 | £836,085 | £608,497 | £408,558 | £291,987 |
| 2007-05 | £343,300 | £857,318 | £625,667 | £421,634 | £300,768 |
| 2007-06 | £340,706 | £847,845 | £619,194 | £417,911 | £298,663 |
| 2007-07 | £342,509 | £856,515 | £624,460 | £420,129 | £300,161 |
| 2007-08 | £342,148 | £862,847 | £627,722 | £422,203 | £299,220 |
| 2007-09 | £340,975 | £865,009 | £628,509 | £421,022 | £298,029 |
| 2007-10 | £341,732 | £866,227 | £625,590 | £420,266 | £299,137 |
| 2007-11 | £349,908 | £889,099 | £639,629 | £428,128 | £306,716 |
| 2007-12 | £354,862 | £894,686 | £643,710 | £432,861 | £311,494 |
| 2008-01 | £350,360 | £887,912 | £636,929 | £427,206 | £307,506 |
| 2008-02 | £339,988 | £864,127 | £618,470 | £415,128 | £298,288 |
| 2008-03 | £334,860 | £859,865 | £612,636 | £410,543 | £293,353 |
| 2008-04 | £343,036 | £886,275 | £629,589 | £422,729 | £300,087 |
| 2008-05 | £345,478 | £891,547 | £634,800 | £426,633 | £302,060 |
| 2008-06 | £352,543 | £907,290 | £648,680 | £435,605 | £308,183 |
| 2008-07 | £347,638 | £895,366 | £641,393 | £429,446 | £303,869 |
| 2008-08 | £347,195 | £895,401 | £642,149 | £429,181 | £303,394 |
| 2008-09 | £333,492 | £867,914 | £616,591 | £411,411 | £291,538 |
| 2008-10 | £321,078 | £830,353 | £590,822 | £394,427 | £281,049 |
| 2008-11 | £314,009 | £813,436 | £575,510 | £384,293 | £275,154 |
| 2008-12 | £303,868 | £784,077 | £556,606 | £372,853 | £266,123 |
| 2009-01 | £304,918 | £791,146 | £559,386 | £374,016 | £267,029 |
| 2009-02 | £297,368 | £768,066 | £546,027 | £364,667 | £260,439 |
| 2009-03 | £295,310 | £761,055 | £542,401 | £361,092 | £258,792 |
| 2009-04 | £291,265 | £741,697 | £533,919 | £356,827 | £255,175 |
| 2009-05 | £290,218 | £739,100 | £532,217 | £356,886 | £253,914 |
| 2009-06 | £295,471 | £751,916 | £541,962 | £364,866 | £258,131 |
| 2009-07 | £298,557 | £766,553 | £552,566 | £371,599 | £259,839 |
| 2009-08 | £304,888 | £791,836 | £568,045 | £381,957 | £264,521 |
| 2009-09 | £312,498 | £815,239 | £584,977 | £392,930 | £270,622 |
| 2009-10 | £310,962 | £815,079 | £582,708 | £391,418 | £269,144 |
| 2009-11 | £309,701 | £811,154 | £580,062 | £390,877 | £267,820 |
| 2009-12 | £306,001 | £801,576 | £573,398 | £387,055 | £264,403 |
| 2010-01 | £316,385 | £831,563 | £597,014 | £403,653 | £272,354 |
| 2010-02 | £326,596 | £862,428 | £618,440 | £416,958 | £280,850 |
| 2010-03 | £330,869 | £876,212 | £626,848 | £421,238 | £284,563 |
| 2010-04 | £338,052 | £891,233 | £637,531 | £427,680 | £291,396 |
| 2010-05 | £339,780 | £894,892 | £638,649 | £428,751 | £293,190 |
| 2010-06 | £350,209 | £926,021 | £660,802 | £444,312 | £301,599 |
| 2010-07 | £350,588 | £940,714 | £665,874 | £447,291 | £301,207 |
| 2010-08 | £352,840 | £948,741 | £675,942 | £452,877 | £302,387 |
| 2010-09 | £348,618 | £943,782 | £670,440 | £448,340 | £298,467 |
| 2010-10 | £341,093 | £915,644 | £654,773 | £437,357 | £292,360 |
| 2010-11 | £336,200 | £904,450 | £644,481 | £429,277 | £288,541 |
| 2010-12 | £339,707 | £913,135 | £651,585 | £432,967 | £291,694 |
| 2011-01 | £353,108 | £960,553 | £676,785 | £449,906 | £303,189 |
| 2011-02 | £361,082 | £990,548 | £690,366 | £458,509 | £310,425 |
| 2011-03 | £357,330 | £992,116 | £683,694 | £453,050 | £307,281 |
| 2011-04 | £349,912 | £968,304 | £668,187 | £442,559 | £301,212 |
| 2011-05 | £349,013 | £950,273 | £658,417 | £440,737 | £300,993 |
| 2011-06 | £356,588 | £953,942 | £667,061 | £450,078 | £307,887 |
| 2011-07 | £370,936 | £987,585 | £693,161 | £468,648 | £320,228 |
| 2011-08 | £380,135 | £1,027,515 | £721,687 | £484,624 | £326,671 |
| 2011-09 | £374,928 | £1,025,549 | £718,128 | £480,247 | £321,384 |
| 2011-10 | £364,324 | £1,006,242 | £701,919 | £467,832 | £311,825 |
| 2011-11 | £352,074 | £969,406 | £675,103 | £449,297 | £302,104 |
| 2011-12 | £359,498 | £980,483 | £683,993 | £456,814 | £309,163 |
| 2012-01 | £363,356 | £987,291 | £692,057 | £463,238 | £312,139 |
| 2012-02 | £365,752 | £1,001,376 | £699,759 | £469,735 | £313,275 |
| 2012-03 | £364,635 | £999,862 | £698,621 | £469,372 | £312,022 |
| 2012-04 | £365,370 | £1,000,371 | £696,509 | £469,320 | £313,003 |
| 2012-05 | £381,805 | £1,034,453 | £723,927 | £488,900 | £327,615 |
| 2012-06 | £391,472 | £1,062,111 | £743,065 | £503,916 | £335,264 |
| 2012-07 | £402,097 | £1,094,317 | £765,737 | £519,657 | £343,790 |
| 2012-08 | £392,443 | £1,073,069 | £751,178 | £510,361 | £334,655 |
| 2012-09 | £389,533 | £1,069,449 | £746,861 | £506,999 | £332,015 |
| 2012-10 | £382,491 | £1,047,073 | £731,419 | £497,075 | £326,265 |
| 2012-11 | £385,900 | £1,054,541 | £736,547 | £500,675 | £329,415 |
| 2012-12 | £401,488 | £1,097,739 | £767,162 | £520,777 | £342,718 |
| 2013-01 | £395,460 | £1,088,509 | £760,431 | £513,935 | £337,162 |
| 2013-02 | £406,645 | £1,125,278 | £783,738 | £528,911 | £346,509 |
| 2013-03 | £380,916 | £1,055,228 | £734,023 | £494,225 | £324,776 |
| 2013-04 | £401,489 | £1,105,408 | £769,807 | £520,636 | £342,497 |
| 2013-05 | £406,042 | £1,110,907 | £777,085 | £525,414 | £346,648 |
| 2013-06 | £422,860 | £1,154,269 | £810,475 | £548,999 | £360,655 |
| 2013-07 | £419,572 | £1,145,157 | £805,870 | £545,979 | £357,583 |
| 2013-08 | £417,871 | £1,141,864 | £805,525 | £546,498 | £355,562 |
| 2013-09 | £429,794 | £1,181,589 | £827,780 | £561,143 | £365,871 |
| 2013-10 | £434,009 | £1,193,402 | £834,106 | £565,351 | £369,738 |
| 2013-11 | £434,163 | £1,192,963 | £830,680 | £563,133 | £370,404 |
| 2013-12 | £447,861 | £1,218,272 | £853,231 | £580,072 | £382,386 |
| 2014-01 | £457,323 | £1,248,431 | £871,684 | £592,451 | £390,415 |
| 2014-02 | £463,143 | £1,270,433 | £881,495 | £599,364 | £395,468 |
| 2014-03 | £456,402 | £1,258,631 | £869,444 | £590,804 | £389,597 |
| 2014-04 | £459,171 | £1,263,642 | £872,632 | £594,656 | £391,976 |
| 2014-05 | £482,254 | £1,321,058 | £916,418 | £625,946 | £411,500 |
| 2014-06 | £492,318 | £1,346,720 | £935,463 | £640,436 | £419,881 |
| 2014-07 | £504,841 | £1,383,738 | £961,686 | £659,015 | £430,151 |
| 2014-08 | £509,781 | £1,406,021 | £974,567 | £667,808 | £433,890 |
| 2014-09 | £526,747 | £1,458,582 | £1,009,402 | £690,562 | £448,171 |
| 2014-10 | £529,025 | £1,465,385 | £1,012,924 | £691,296 | £450,465 |
| 2014-11 | £527,492 | £1,457,702 | £1,008,098 | £687,329 | £449,512 |
| 2014-12 | £516,431 | £1,420,899 | £982,469 | £670,478 | £440,583 |
| 2015-01 | £516,167 | £1,418,284 | £981,961 | £669,868 | £440,408 |
| 2015-02 | £513,397 | £1,413,138 | £976,874 | £665,075 | £438,225 |
| 2015-03 | £513,854 | £1,412,160 | £977,351 | £664,579 | £438,873 |
| 2015-04 | £515,765 | £1,420,590 | £979,999 | £667,861 | £440,379 |
| 2015-05 | £528,554 | £1,447,488 | £1,002,613 | £684,167 | £451,424 |
| 2015-06 | £538,152 | £1,480,994 | £1,026,756 | £701,542 | £458,584 |
| 2015-07 | £549,343 | £1,507,381 | £1,049,656 | £716,214 | £468,084 |
| 2015-08 | £556,709 | £1,528,817 | £1,064,605 | £728,267 | £473,913 |
| 2015-09 | £560,611 | £1,544,904 | £1,069,957 | £731,192 | £477,636 |
| 2015-10 | £562,838 | £1,552,955 | £1,074,041 | £734,664 | £479,433 |
| 2015-11 | £560,951 | £1,551,523 | £1,071,829 | £731,794 | £477,841 |
| 2015-12 | £564,008 | £1,553,310 | £1,078,396 | £735,804 | £480,452 |
| 2016-01 | £571,920 | £1,573,691 | £1,097,294 | £746,291 | £487,072 |
| 2016-02 | £575,842 | £1,588,599 | £1,106,386 | £751,013 | £490,419 |
| 2016-03 | £592,533 | £1,641,405 | £1,137,504 | £772,057 | £504,754 |
| 2016-04 | £594,187 | £1,635,726 | £1,133,181 | £772,848 | £506,639 |
| 2016-05 | £597,752 | £1,619,061 | £1,129,782 | £775,091 | £510,482 |
| 2016-06 | £581,535 | £1,560,609 | £1,094,417 | £752,301 | £497,127 |
| 2016-07 | £583,138 | £1,566,254 | £1,099,000 | £754,866 | £498,365 |
| 2016-08 | £587,400 | £1,590,656 | £1,113,021 | £761,538 | £501,589 |
| 2016-09 | £598,390 | £1,618,467 | £1,137,321 | £776,682 | £510,734 |
| 2016-10 | £602,318 | £1,627,644 | £1,142,288 | £777,224 | £514,947 |
| 2016-11 | £595,013 | £1,611,144 | £1,126,120 | £764,899 | £509,250 |
| 2016-12 | £588,479 | £1,596,277 | £1,111,126 | £754,413 | £504,076 |
| 2017-01 | £582,118 | £1,578,633 | £1,097,661 | £747,539 | £498,446 |
| 2017-02 | £581,209 | £1,568,335 | £1,090,022 | £743,768 | £498,235 |
| 2017-03 | £593,932 | £1,599,325 | £1,111,240 | £757,760 | £509,573 |
| 2017-04 | £596,518 | £1,608,073 | £1,113,932 | £758,151 | £512,297 |
| 2017-05 | £606,338 | £1,623,344 | £1,128,968 | £768,113 | £521,262 |
| 2017-06 | £607,607 | £1,614,979 | £1,127,171 | £769,248 | £522,565 |
| 2017-07 | £611,030 | £1,615,590 | £1,132,960 | £774,286 | £525,444 |
| 2017-08 | £618,306 | £1,644,956 | £1,153,138 | £788,742 | £530,667 |
| 2017-09 | £613,671 | £1,644,992 | £1,149,582 | £785,062 | £526,169 |
| 2017-10 | £604,186 | £1,629,957 | £1,137,248 | £775,482 | £517,474 |
| 2017-11 | £569,823 | £1,533,923 | £1,072,439 | £730,664 | £488,177 |
| 2017-12 | £560,669 | £1,505,689 | £1,052,871 | £718,779 | £480,419 |
| 2018-01 | £567,929 | £1,521,989 | £1,066,493 | £727,368 | £486,770 |
| 2018-02 | £594,702 | £1,600,011 | £1,114,840 | £761,372 | £509,689 |
| 2018-03 | £598,700 | £1,614,139 | £1,126,643 | £769,523 | £512,606 |
| 2018-04 | £597,818 | £1,616,779 | £1,125,857 | £772,494 | £511,315 |
| 2018-05 | £582,250 | £1,582,087 | £1,105,886 | £758,870 | £497,020 |
| 2018-06 | £578,026 | £1,580,560 | £1,102,695 | £753,867 | £493,233 |
| 2018-07 | £578,787 | £1,593,717 | £1,109,203 | £756,140 | £493,603 |
| 2018-08 | £584,332 | £1,615,392 | £1,121,299 | £762,666 | £498,370 |
| 2018-09 | £575,834 | £1,593,667 | £1,107,422 | £753,207 | £490,877 |
| 2018-10 | £570,735 | £1,576,029 | £1,092,937 | £743,056 | £487,043 |
| 2018-11 | £576,532 | £1,603,800 | £1,107,227 | £752,582 | £491,656 |
| 2018-12 | £578,284 | £1,604,962 | £1,103,997 | £752,129 | £493,606 |
| 2019-01 | £577,307 | £1,605,275 | £1,105,691 | £752,221 | £492,536 |
| 2019-02 | £564,556 | £1,559,991 | £1,074,399 | £732,042 | £482,265 |
| 2019-03 | £565,541 | £1,562,892 | £1,081,563 | £736,247 | £482,646 |
| 2019-04 | £561,488 | £1,550,251 | £1,073,858 | £733,610 | £478,827 |
| 2019-05 | £574,495 | £1,583,178 | £1,104,820 | £755,212 | £489,172 |
| 2019-06 | £571,966 | £1,575,593 | £1,101,081 | £753,433 | £486,786 |
| 2019-07 | £576,274 | £1,577,144 | £1,108,506 | £758,201 | £490,632 |
| 2019-08 | £572,111 | £1,571,360 | £1,103,224 | £755,685 | £486,613 |
| 2019-09 | £582,725 | £1,605,632 | £1,121,859 | £770,116 | £495,603 |
| 2019-10 | £589,499 | £1,640,546 | £1,140,348 | £779,685 | £501,113 |
| 2019-11 | £587,624 | £1,640,903 | £1,140,262 | £775,762 | £499,624 |
| 2019-12 | £586,997 | £1,643,720 | £1,143,078 | £774,939 | £498,992 |
| 2020-01 | £579,820 | £1,619,184 | £1,128,668 | £766,536 | £492,770 |
| 2020-02 | £572,942 | £1,609,527 | £1,117,775 | £759,870 | £486,419 |
| 2020-03 | £575,388 | £1,622,127 | £1,125,834 | £764,650 | £488,170 |
| 2020-04 | £581,284 | £1,656,217 | £1,144,986 | £774,722 | £492,567 |
| 2020-05 | £599,629 | £1,703,113 | £1,176,420 | £793,617 | £509,052 |
| 2020-06 | £591,135 | £1,674,963 | £1,161,442 | £784,997 | £501,444 |
| 2020-07 | £588,798 | £1,655,708 | £1,153,566 | £783,386 | £499,397 |
| 2020-08 | £584,189 | £1,649,768 | £1,155,822 | £786,195 | £493,895 |
| 2020-09 | £589,931 | £1,679,391 | £1,176,185 | £798,330 | £497,837 |
| 2020-10 | £595,599 | £1,708,324 | £1,193,494 | £811,491 | £501,639 |
| 2020-11 | £608,047 | £1,745,381 | £1,216,180 | £829,888 | £511,978 |
| 2020-12 | £622,328 | £1,787,111 | £1,242,503 | £851,598 | £523,753 |
| 2021-01 | £612,818 | £1,746,161 | £1,217,526 | £834,870 | £516,485 |
| 2021-02 | £586,869 | £1,654,741 | £1,158,008 | £796,558 | £495,288 |
| 2021-03 | £575,984 | £1,598,120 | £1,124,454 | £775,644 | £487,387 |
| 2021-04 | £567,605 | £1,570,649 | £1,104,515 | £764,102 | £480,437 |
| 2021-05 | £566,180 | £1,568,524 | £1,101,509 | £761,514 | £479,345 |
| 2021-06 | £558,287 | £1,548,186 | £1,085,898 | £754,877 | £471,965 |
| 2021-07 | £539,044 | £1,508,573 | £1,053,507 | £725,428 | £456,139 |
| 2021-08 | £537,423 | £1,539,824 | £1,067,611 | £727,277 | £453,554 |
| 2021-09 | £539,751 | £1,568,825 | £1,083,392 | £730,416 | £455,183 |
| 2021-10 | £551,342 | £1,628,784 | £1,118,521 | £752,876 | £463,407 |
| 2021-11 | £559,555 | £1,651,867 | £1,134,186 | £764,094 | £470,334 |
| 2021-12 | £558,544 | £1,663,383 | £1,138,613 | £765,093 | £468,880 |
| 2022-01 | £574,271 | £1,701,946 | £1,171,609 | £789,310 | £481,639 |
| 2022-02 | £575,211 | £1,693,592 | £1,168,660 | £789,718 | £482,935 |
| 2022-03 | £569,952 | £1,684,973 | £1,161,133 | £782,270 | £478,507 |
| 2022-04 | £567,428 | £1,676,007 | £1,153,844 | £780,011 | £476,203 |
| 2022-05 | £568,585 | £1,688,170 | £1,163,258 | £785,753 | £475,992 |
| 2022-06 | £579,803 | £1,714,847 | £1,184,186 | £801,883 | £485,345 |
| 2022-07 | £589,778 | £1,741,295 | £1,208,819 | £818,378 | £492,993 |
| 2022-08 | £595,787 | £1,754,643 | £1,222,687 | £830,288 | £497,223 |
| 2022-09 | £597,779 | £1,769,605 | £1,233,462 | £838,048 | £497,553 |
| 2022-10 | £590,680 | £1,751,407 | £1,216,246 | £827,903 | £491,753 |
| 2022-11 | £589,751 | £1,754,459 | £1,211,806 | £825,214 | £491,328 |
| 2022-12 | £586,868 | £1,737,210 | £1,200,177 | £818,926 | £489,634 |
| 2023-01 | £595,197 | £1,766,405 | £1,223,199 | £830,854 | £496,303 |
| 2023-02 | £582,206 | £1,725,252 | £1,197,363 | £811,846 | £485,599 |
| 2023-03 | £571,584 | £1,705,674 | £1,181,076 | £794,645 | £476,931 |
| 2023-04 | £556,404 | £1,664,580 | £1,147,784 | £772,066 | £464,574 |
| 2023-05 | £566,669 | £1,688,807 | £1,168,638 | £785,761 | £473,307 |
| 2023-06 | £576,499 | £1,718,747 | £1,189,762 | £803,341 | £480,713 |
| 2023-07 | £580,813 | £1,727,698 | £1,201,236 | £812,155 | £483,725 |
| 2023-08 | £577,988 | £1,732,374 | £1,199,096 | £812,118 | £480,420 |
| 2023-09 | £590,827 | £1,766,247 | £1,226,356 | £831,704 | £490,808 |
| 2023-10 | £592,671 | £1,763,349 | £1,225,208 | £831,889 | £492,996 |
| 2023-11 | £589,727 | £1,751,806 | £1,218,281 | £824,310 | £491,261 |
| 2023-12 | £565,336 | £1,667,395 | £1,160,044 | £787,082 | £471,838 |
| 2024-01 | £563,292 | £1,661,031 | £1,156,253 | £785,307 | £469,915 |
| 2024-02 | £566,759 | £1,662,187 | £1,162,416 | £791,768 | £472,578 |
| 2024-03 | £566,750 | £1,666,161 | £1,163,902 | £790,204 | £472,729 |
| 2024-04 | £562,893 | £1,655,535 | £1,157,390 | £783,996 | £469,612 |
| 2024-05 | £564,487 | £1,656,062 | £1,155,836 | £784,092 | £471,443 |
| 2024-06 | £583,664 | £1,706,206 | £1,194,260 | £812,831 | £487,163 |
| 2024-07 | £590,060 | £1,725,723 | £1,209,297 | £825,802 | £491,773 |
| 2024-08 | £591,428 | £1,731,140 | £1,214,695 | £832,556 | £492,032 |
| 2024-09 | £583,095 | £1,724,258 | £1,206,865 | £824,412 | £484,170 |
| 2024-10 | £585,060 | £1,732,120 | £1,208,161 | £824,386 | £486,321 |
| 2024-11 | £584,022 | £1,732,192 | £1,207,757 | £822,012 | £485,547 |
| 2024-12 | £580,377 | £1,715,173 | £1,195,717 | £816,330 | £482,754 |
| 2025-01 | £581,925 | £1,720,970 | £1,200,941 | £821,436 | £483,500 |
| 2025-02 | £581,929 | £1,719,090 | £1,199,831 | £823,349 | £483,221 |
| 2025-03 | £583,617 | £1,687,934 | £1,187,513 | £822,487 | £485,679 |
| 2025-04 | £579,489 | £1,701,460 | £1,195,904 | £819,977 | £481,240 |
| 2025-05 | £573,035 | £1,696,488 | £1,192,125 | £813,883 | £475,132 |
| 2025-06 | £567,845 | £1,717,582 | £1,203,643 | £815,270 | £468,765 |
| 2025-07 | £569,570 | £1,698,535 | £1,194,176 | £818,648 | £470,458 |
| 2025-08 | £581,740 | £1,730,040 | £1,222,018 | £840,317 | £479,854 |
| 2025-09 | £596,136 | £1,781,791 | £1,259,335 | £865,592 | £490,856 |
| 2025-10 | £598,135 | £1,797,875 | £1,271,578 | £871,410 | £491,836 |
| 2025-11 | £594,610 | £1,792,312 | £1,264,472 | £867,845 | £488,669 |
| 2025-12 | £585,174 | £1,762,243 | £1,242,622 | £851,249 | £481,384 |
| 2026-01 | £577,655 | £1,749,972 | £1,235,055 | £843,720 | £474,462 |
| 2026-02 | £568,615 | £1,721,746 | £1,215,816 | £827,761 | £467,536 |
| 2026-03 | £564,467 | £1,701,723 | £1,205,861 | £826,869 | £463,448 |
| 2026-04 | £572,455 | £1,721,044 | £1,215,320 | £834,935 | £470,801 |
- All property types
- Detached
- Semi-detached
- Terraced
- Flats
Source: HM Land Registry House Price Index
| Year | All property types | Detached | Semi-detached | Terraced | Flats |
|---|---|---|---|---|---|
| 1996-01 | -3.1% | -6.5% | -4.3% | -4.1% | -1.8% |
| 1996-02 | +4.7% | +2.3% | +3.8% | +3.4% | +6.4% |
| 1996-03 | +4.7% | +2.6% | +4.3% | +3.4% | +6.2% |
| 1996-04 | +10.3% | +8.3% | +9.9% | +8.5% | +12.4% |
| 1996-05 | +7.0% | +4.7% | +6.2% | +5.9% | +8.4% |
| 1996-06 | +9.8% | +7.7% | +8.8% | +9.2% | +10.8% |
| 1996-07 | +4.8% | +3.6% | +4.3% | +4.5% | +5.2% |
| 1996-08 | +7.4% | +6.8% | +7.4% | +7.0% | +7.9% |
| 1996-09 | +11.7% | +10.7% | +11.3% | +11.0% | +12.4% |
| 1996-10 | +16.2% | +15.4% | +16.0% | +16.0% | +16.3% |
| 1996-11 | +19.7% | +19.2% | +19.6% | +20.3% | +19.0% |
| 1996-12 | +18.3% | +17.9% | +19.0% | +19.4% | +17.2% |
| 1997-01 | +12.3% | +12.2% | +13.2% | +13.5% | +10.9% |
| 1997-02 | +6.0% | +7.1% | +6.7% | +6.7% | +4.8% |
| 1997-03 | +6.4% | +7.8% | +6.6% | +7.3% | +5.0% |
| 1997-04 | +8.6% | +11.1% | +9.1% | +9.6% | +6.6% |
| 1997-05 | +14.5% | +18.0% | +16.2% | +15.8% | +12.2% |
| 1997-06 | +16.2% | +21.6% | +19.0% | +17.8% | +13.5% |
| 1997-07 | +16.4% | +20.7% | +18.7% | +17.8% | +14.4% |
| 1997-08 | +19.1% | +22.2% | +20.9% | +20.5% | +17.3% |
| 1997-09 | +20.6% | +22.7% | +22.0% | +21.7% | +19.3% |
| 1997-10 | +21.9% | +23.9% | +23.4% | +22.9% | +20.5% |
| 1997-11 | +12.0% | +15.2% | +13.8% | +13.0% | +10.6% |
| 1997-12 | +10.1% | +13.4% | +11.7% | +11.0% | +8.7% |
| 1998-01 | +11.6% | +15.8% | +13.3% | +12.4% | +10.4% |
| 1998-02 | +16.6% | +19.3% | +17.9% | +17.3% | +15.5% |
| 1998-03 | +17.2% | +19.2% | +18.7% | +17.7% | +16.4% |
| 1998-04 | +17.8% | +19.1% | +19.5% | +18.3% | +16.9% |
| 1998-05 | +13.6% | +14.4% | +14.6% | +14.1% | +13.0% |
| 1998-06 | +14.2% | +13.7% | +14.2% | +14.3% | +14.0% |
| 1998-07 | +14.4% | +14.0% | +14.4% | +14.4% | +14.3% |
| 1998-08 | +13.9% | +14.1% | +14.2% | +13.9% | +13.8% |
| 1998-09 | +9.7% | +11.2% | +10.7% | +10.3% | +9.1% |
| 1998-10 | +9.8% | +10.6% | +10.0% | +9.8% | +9.7% |
| 1998-11 | +16.9% | +16.8% | +16.6% | +16.3% | +17.1% |
| 1998-12 | +20.9% | +19.8% | +20.0% | +19.7% | +21.5% |
| 1999-01 | +21.5% | +19.9% | +20.6% | +19.9% | +22.2% |
| 1999-02 | +22.2% | +21.9% | +22.1% | +21.4% | +22.5% |
| 1999-03 | +21.3% | +21.3% | +21.3% | +20.6% | +21.6% |
| 1999-04 | +17.8% | +17.9% | +17.7% | +17.7% | +17.9% |
| 1999-05 | +15.5% | +14.3% | +14.7% | +15.0% | +15.9% |
| 1999-06 | +10.0% | +9.1% | +9.5% | +9.9% | +10.1% |
| 1999-07 | +11.6% | +11.1% | +11.1% | +11.5% | +11.8% |
| 1999-08 | +15.2% | +15.1% | +14.9% | +15.6% | +15.1% |
| 1999-09 | +27.4% | +26.7% | +26.4% | +27.2% | +27.6% |
| 1999-10 | +32.3% | +31.4% | +31.5% | +32.1% | +32.5% |
| 1999-11 | +28.3% | +27.7% | +27.6% | +28.5% | +28.3% |
| 1999-12 | +24.0% | +23.2% | +23.3% | +24.6% | +23.9% |
| 2000-01 | +21.8% | +21.9% | +21.9% | +22.9% | +21.4% |
| 2000-02 | +27.0% | +27.0% | +26.6% | +27.8% | +26.7% |
| 2000-03 | +27.1% | +28.6% | +27.7% | +28.5% | +26.3% |
| 2000-04 | +28.5% | +29.3% | +28.2% | +29.1% | +28.2% |
| 2000-05 | +28.8% | +30.3% | +29.2% | +29.1% | +28.4% |
| 2000-06 | +33.9% | +34.0% | +33.5% | +33.0% | +34.1% |
| 2000-07 | +36.9% | +37.8% | +37.4% | +35.9% | +37.1% |
| 2000-08 | +35.5% | +35.0% | +35.2% | +33.1% | +36.3% |
| 2000-09 | +29.9% | +29.5% | +29.6% | +27.2% | +30.8% |
| 2000-10 | +27.1% | +27.1% | +26.8% | +24.7% | +27.9% |
| 2000-11 | +26.7% | +27.1% | +26.3% | +24.4% | +27.4% |
| 2000-12 | +25.7% | +26.6% | +25.5% | +23.4% | +26.3% |
| 2001-01 | +27.0% | +25.9% | +25.2% | +24.3% | +28.0% |
| 2001-02 | +19.0% | +17.9% | +17.7% | +16.6% | +19.8% |
| 2001-03 | +18.3% | +16.4% | +16.6% | +15.9% | +19.4% |
| 2001-04 | +15.9% | +15.4% | +14.8% | +13.8% | +16.8% |
| 2001-05 | +22.8% | +22.1% | +21.0% | +20.8% | +23.8% |
| 2001-06 | +24.0% | +22.9% | +22.0% | +22.2% | +24.8% |
| 2001-07 | +19.4% | +17.2% | +16.9% | +17.8% | +20.3% |
| 2001-08 | +12.1% | +9.9% | +9.7% | +11.1% | +12.7% |
| 2001-09 | +6.9% | +5.1% | +4.5% | +6.1% | +7.4% |
| 2001-10 | +5.9% | +4.3% | +3.7% | +5.3% | +6.4% |
| 2001-11 | +9.5% | +7.3% | +7.7% | +8.8% | +10.1% |
| 2001-12 | +12.4% | +10.0% | +10.8% | +11.6% | +13.0% |
| 2002-01 | +12.1% | +9.7% | +10.7% | +10.8% | +13.0% |
| 2002-02 | +12.8% | +9.7% | +10.8% | +11.4% | +13.7% |
| 2002-03 | +12.0% | +8.6% | +10.0% | +10.4% | +12.9% |
| 2002-04 | +14.9% | +10.4% | +12.7% | +13.1% | +16.0% |
| 2002-05 | +11.7% | +7.6% | +9.8% | +9.6% | +12.8% |
| 2002-06 | +9.6% | +5.1% | +7.6% | +7.7% | +10.6% |
| 2002-07 | +9.3% | +5.1% | +7.2% | +7.8% | +10.2% |
| 2002-08 | +13.3% | +8.8% | +11.0% | +11.7% | +14.2% |
| 2002-09 | +15.8% | +11.4% | +14.1% | +14.5% | +16.6% |
| 2002-10 | +13.8% | +9.2% | +12.2% | +12.5% | +14.6% |
| 2002-11 | +11.6% | +7.8% | +9.8% | +10.4% | +12.3% |
| 2002-12 | +10.8% | +7.6% | +9.2% | +9.6% | +11.5% |
| 2003-01 | +11.7% | +9.1% | +10.0% | +11.2% | +12.1% |
| 2003-02 | +8.7% | +5.6% | +7.6% | +7.9% | +9.2% |
| 2003-03 | +8.8% | +5.0% | +7.3% | +8.0% | +9.3% |
| 2003-04 | +8.7% | +4.6% | +8.0% | +8.0% | +9.0% |
| 2003-05 | +10.8% | +6.8% | +10.3% | +11.1% | +10.8% |
| 2003-06 | +8.8% | +6.5% | +8.5% | +8.9% | +8.8% |
| 2003-07 | +8.7% | +6.0% | +8.1% | +8.4% | +8.9% |
| 2003-08 | +6.8% | +4.4% | +6.2% | +6.5% | +7.0% |
| 2003-09 | +6.5% | +3.1% | +6.1% | +6.7% | +6.5% |
| 2003-10 | +5.2% | +1.9% | +4.4% | +5.9% | +5.0% |
| 2003-11 | +5.5% | +1.4% | +4.8% | +6.2% | +5.3% |
| 2003-12 | +7.4% | +2.9% | +6.2% | +8.1% | +7.4% |
| 2004-01 | +6.4% | +2.5% | +6.0% | +7.1% | +6.2% |
| 2004-02 | +9.8% | +7.0% | +9.4% | +10.9% | +9.4% |
| 2004-03 | +11.7% | +9.1% | +11.5% | +13.1% | +11.2% |
| 2004-04 | +10.4% | +7.9% | +9.7% | +12.2% | +9.8% |
| 2004-05 | +8.0% | +4.1% | +6.7% | +9.2% | +7.8% |
| 2004-06 | +6.7% | +1.9% | +5.6% | +7.9% | +6.3% |
| 2004-07 | +8.0% | +3.3% | +7.2% | +9.2% | +7.6% |
| 2004-08 | +8.2% | +4.3% | +7.9% | +9.7% | +7.6% |
| 2004-09 | +8.0% | +4.8% | +7.4% | +9.0% | +7.7% |
| 2004-10 | +10.1% | +6.8% | +9.2% | +10.7% | +10.0% |
| 2004-11 | +10.0% | +6.6% | +8.7% | +10.6% | +9.8% |
| 2004-12 | +7.1% | +3.8% | +5.5% | +7.8% | +6.9% |
| 2005-01 | +6.1% | +2.3% | +3.9% | +6.8% | +6.0% |
| 2005-02 | +3.6% | 0.0% | +1.7% | +4.2% | +3.6% |
| 2005-03 | +3.7% | +0.5% | +2.1% | +4.2% | +3.7% |
| 2005-04 | +4.0% | +1.3% | +2.7% | +4.4% | +4.1% |
| 2005-05 | +3.1% | +1.4% | +1.8% | +3.3% | +3.1% |
| 2005-06 | +3.9% | +2.6% | +2.5% | +4.3% | +3.8% |
| 2005-07 | +2.1% | +1.2% | +0.7% | +2.4% | +2.1% |
| 2005-08 | +3.7% | +2.3% | +2.0% | +4.1% | +3.7% |
| 2005-09 | +3.6% | +2.1% | +1.7% | +3.9% | +3.7% |
| 2005-10 | +2.4% | +1.1% | +1.0% | +3.0% | +2.3% |
| 2005-11 | +1.0% | -0.1% | +0.1% | +1.9% | +0.8% |
| 2005-12 | +2.5% | +1.4% | +1.9% | +3.5% | +2.2% |
| 2006-01 | +3.0% | +2.4% | +3.0% | +4.1% | +2.7% |
| 2006-02 | +4.7% | +3.6% | +4.4% | +5.7% | +4.4% |
| 2006-03 | +2.8% | +2.3% | +2.9% | +4.0% | +2.4% |
| 2006-04 | +2.9% | +2.1% | +2.6% | +3.9% | +2.5% |
| 2006-05 | +5.4% | +5.5% | +5.6% | +6.5% | +4.9% |
| 2006-06 | +7.2% | +7.6% | +7.6% | +8.0% | +6.8% |
| 2006-07 | +10.8% | +11.1% | +11.3% | +12.0% | +10.3% |
| 2006-08 | +9.5% | +9.4% | +10.4% | +11.1% | +8.9% |
| 2006-09 | +9.4% | +8.8% | +10.3% | +11.2% | +8.8% |
| 2006-10 | +12.7% | +12.4% | +13.8% | +14.1% | +12.1% |
| 2006-11 | +14.5% | +14.7% | +15.6% | +15.7% | +14.0% |
| 2006-12 | +16.9% | +18.3% | +18.6% | +18.6% | +16.1% |
| 2007-01 | +14.8% | +16.0% | +16.3% | +16.2% | +14.1% |
| 2007-02 | +16.5% | +18.5% | +17.9% | +17.5% | +16.0% |
| 2007-03 | +21.6% | +23.4% | +22.6% | +22.4% | +21.3% |
| 2007-04 | +25.2% | +27.7% | +26.4% | +26.5% | +24.7% |
| 2007-05 | +25.0% | +26.7% | +26.0% | +26.6% | +24.5% |
| 2007-06 | +22.3% | +23.6% | +23.0% | +23.7% | +21.8% |
| 2007-07 | +19.8% | +21.2% | +20.5% | +20.7% | +19.5% |
| 2007-08 | +19.4% | +21.6% | +20.3% | +20.3% | +19.0% |
| 2007-09 | +18.0% | +20.5% | +19.2% | +18.8% | +17.7% |
| 2007-10 | +15.4% | +17.7% | +16.1% | +16.1% | +15.1% |
| 2007-11 | +17.6% | +20.1% | +18.1% | +17.9% | +17.4% |
| 2007-12 | +16.9% | +18.5% | +16.6% | +16.7% | +16.9% |
| 2008-01 | +17.2% | +19.2% | +16.9% | +16.9% | +17.3% |
| 2008-02 | +11.7% | +13.6% | +11.6% | +11.9% | +11.6% |
| 2008-03 | +4.8% | +7.2% | +5.0% | +5.2% | +4.7% |
| 2008-04 | +3.0% | +6.0% | +3.5% | +3.5% | +2.8% |
| 2008-05 | +0.6% | +4.0% | +1.5% | +1.2% | +0.4% |
| 2008-06 | +3.5% | +7.0% | +4.8% | +4.2% | +3.2% |
| 2008-07 | +1.5% | +4.5% | +2.7% | +2.2% | +1.2% |
| 2008-08 | +1.5% | +3.8% | +2.3% | +1.7% | +1.4% |
| 2008-09 | -2.2% | +0.3% | -1.9% | -2.3% | -2.2% |
| 2008-10 | -6.0% | -4.1% | -5.6% | -6.1% | -6.0% |
| 2008-11 | -10.3% | -8.5% | -10.0% | -10.2% | -10.3% |
| 2008-12 | -14.4% | -12.4% | -13.5% | -13.9% | -14.6% |
| 2009-01 | -13.0% | -10.9% | -12.2% | -12.5% | -13.2% |
| 2009-02 | -12.5% | -11.1% | -11.7% | -12.2% | -12.7% |
| 2009-03 | -11.8% | -11.5% | -11.5% | -12.0% | -11.8% |
| 2009-04 | -15.1% | -16.3% | -15.2% | -15.6% | -15.0% |
| 2009-05 | -16.0% | -17.1% | -16.2% | -16.3% | -15.9% |
| 2009-06 | -16.2% | -17.1% | -16.5% | -16.2% | -16.2% |
| 2009-07 | -14.1% | -14.4% | -13.8% | -13.5% | -14.5% |
| 2009-08 | -12.2% | -11.6% | -11.5% | -11.0% | -12.8% |
| 2009-09 | -6.3% | -6.1% | -5.1% | -4.5% | -7.2% |
| 2009-10 | -3.2% | -1.8% | -1.4% | -0.8% | -4.2% |
| 2009-11 | -1.4% | -0.3% | +0.8% | +1.7% | -2.7% |
| 2009-12 | +0.7% | +2.2% | +3.0% | +3.8% | -0.6% |
| 2010-01 | +3.8% | +5.1% | +6.7% | +7.9% | +2.0% |
| 2010-02 | +9.8% | +12.3% | +13.3% | +14.3% | +7.8% |
| 2010-03 | +12.0% | +15.1% | +15.6% | +16.7% | +10.0% |
| 2010-04 | +16.1% | +20.2% | +19.4% | +19.9% | +14.2% |
| 2010-05 | +17.1% | +21.1% | +20.0% | +20.1% | +15.5% |
| 2010-06 | +18.5% | +23.2% | +21.9% | +21.8% | +16.8% |
| 2010-07 | +17.4% | +22.7% | +20.5% | +20.4% | +15.9% |
| 2010-08 | +15.7% | +19.8% | +19.0% | +18.6% | +14.3% |
| 2010-09 | +11.6% | +15.8% | +14.6% | +14.1% | +10.3% |
| 2010-10 | +9.7% | +12.3% | +12.4% | +11.7% | +8.6% |
| 2010-11 | +8.6% | +11.5% | +11.1% | +9.8% | +7.7% |
| 2010-12 | +11.0% | +13.9% | +13.6% | +11.9% | +10.3% |
| 2011-01 | +11.6% | +15.5% | +13.4% | +11.5% | +11.3% |
| 2011-02 | +10.6% | +14.9% | +11.6% | +10.0% | +10.5% |
| 2011-03 | +8.0% | +13.2% | +9.1% | +7.6% | +8.0% |
| 2011-04 | +3.5% | +8.6% | +4.8% | +3.5% | +3.4% |
| 2011-05 | +2.7% | +6.2% | +3.1% | +2.8% | +2.7% |
| 2011-06 | +1.8% | +3.0% | +0.9% | +1.3% | +2.1% |
| 2011-07 | +5.8% | +5.0% | +4.1% | +4.8% | +6.3% |
| 2011-08 | +7.7% | +8.3% | +6.8% | +7.0% | +8.0% |
| 2011-09 | +7.5% | +8.7% | +7.1% | +7.1% | +7.7% |
| 2011-10 | +6.8% | +9.9% | +7.2% | +7.0% | +6.7% |
| 2011-11 | +4.7% | +7.2% | +4.8% | +4.7% | +4.7% |
| 2011-12 | +5.8% | +7.4% | +5.0% | +5.5% | +6.0% |
| 2012-01 | +2.9% | +2.8% | +2.3% | +3.0% | +3.0% |
| 2012-02 | +1.3% | +1.1% | +1.4% | +2.4% | +0.9% |
| 2012-03 | +2.0% | +0.8% | +2.2% | +3.6% | +1.5% |
| 2012-04 | +4.4% | +3.3% | +4.2% | +6.0% | +3.9% |
| 2012-05 | +9.4% | +8.9% | +9.9% | +10.9% | +8.8% |
| 2012-06 | +9.8% | +11.3% | +11.4% | +12.0% | +8.9% |
| 2012-07 | +8.4% | +10.8% | +10.5% | +10.9% | +7.4% |
| 2012-08 | +3.2% | +4.4% | +4.1% | +5.3% | +2.4% |
| 2012-09 | +3.9% | +4.3% | +4.0% | +5.6% | +3.3% |
| 2012-10 | +5.0% | +4.1% | +4.2% | +6.3% | +4.6% |
| 2012-11 | +9.6% | +8.8% | +9.1% | +11.4% | +9.0% |
| 2012-12 | +11.7% | +12.0% | +12.2% | +14.0% | +10.9% |
| 2013-01 | +8.8% | +10.3% | +9.9% | +10.9% | +8.0% |
| 2013-02 | +11.2% | +12.4% | +12.0% | +12.6% | +10.6% |
| 2013-03 | +4.5% | +5.5% | +5.1% | +5.3% | +4.1% |
| 2013-04 | +9.9% | +10.5% | +10.5% | +10.9% | +9.4% |
| 2013-05 | +6.3% | +7.4% | +7.3% | +7.5% | +5.8% |
| 2013-06 | +8.0% | +8.7% | +9.1% | +8.9% | +7.6% |
| 2013-07 | +4.3% | +4.6% | +5.2% | +5.1% | +4.0% |
| 2013-08 | +6.5% | +6.4% | +7.2% | +7.1% | +6.2% |
| 2013-09 | +10.3% | +10.5% | +10.8% | +10.7% | +10.2% |
| 2013-10 | +13.5% | +14.0% | +14.0% | +13.7% | +13.3% |
| 2013-11 | +12.5% | +13.1% | +12.8% | +12.5% | +12.4% |
| 2013-12 | +11.6% | +11.0% | +11.2% | +11.4% | +11.6% |
| 2014-01 | +15.6% | +14.7% | +14.6% | +15.3% | +15.8% |
| 2014-02 | +13.9% | +12.9% | +12.5% | +13.3% | +14.1% |
| 2014-03 | +19.8% | +19.3% | +18.4% | +19.5% | +20.0% |
| 2014-04 | +14.4% | +14.3% | +13.4% | +14.2% | +14.4% |
| 2014-05 | +18.8% | +18.9% | +17.9% | +19.1% | +18.7% |
| 2014-06 | +16.4% | +16.7% | +15.4% | +16.7% | +16.4% |
| 2014-07 | +20.3% | +20.8% | +19.3% | +20.7% | +20.3% |
| 2014-08 | +22.0% | +23.1% | +21.0% | +22.2% | +22.0% |
| 2014-09 | +22.6% | +23.4% | +21.9% | +23.1% | +22.5% |
| 2014-10 | +21.9% | +22.8% | +21.4% | +22.3% | +21.8% |
| 2014-11 | +21.5% | +22.2% | +21.4% | +22.1% | +21.4% |
| 2014-12 | +15.3% | +16.6% | +15.1% | +15.6% | +15.2% |
| 2015-01 | +12.9% | +13.6% | +12.7% | +13.1% | +12.8% |
| 2015-02 | +10.9% | +11.2% | +10.8% | +11.0% | +10.8% |
| 2015-03 | +12.6% | +12.2% | +12.4% | +12.5% | +12.6% |
| 2015-04 | +12.3% | +12.4% | +12.3% | +12.3% | +12.3% |
| 2015-05 | +9.6% | +9.6% | +9.4% | +9.3% | +9.7% |
| 2015-06 | +9.3% | +10.0% | +9.8% | +9.5% | +9.2% |
| 2015-07 | +8.8% | +8.9% | +9.1% | +8.7% | +8.8% |
| 2015-08 | +9.2% | +8.7% | +9.2% | +9.1% | +9.2% |
| 2015-09 | +6.4% | +5.9% | +6.0% | +5.9% | +6.6% |
| 2015-10 | +6.4% | +6.0% | +6.0% | +6.3% | +6.4% |
| 2015-11 | +6.3% | +6.4% | +6.3% | +6.5% | +6.3% |
| 2015-12 | +9.2% | +9.3% | +9.8% | +9.7% | +9.0% |
| 2016-01 | +10.8% | +11.0% | +11.7% | +11.4% | +10.6% |
| 2016-02 | +12.2% | +12.4% | +13.3% | +12.9% | +11.9% |
| 2016-03 | +15.3% | +16.2% | +16.4% | +16.2% | +15.0% |
| 2016-04 | +15.2% | +15.1% | +15.6% | +15.7% | +15.0% |
| 2016-05 | +13.1% | +11.9% | +12.7% | +13.3% | +13.1% |
| 2016-06 | +8.1% | +5.4% | +6.6% | +7.2% | +8.4% |
| 2016-07 | +6.2% | +3.9% | +4.7% | +5.4% | +6.5% |
| 2016-08 | +5.5% | +4.0% | +4.5% | +4.6% | +5.8% |
| 2016-09 | +6.7% | +4.8% | +6.3% | +6.2% | +6.9% |
| 2016-10 | +7.0% | +4.8% | +6.4% | +5.8% | +7.4% |
| 2016-11 | +6.1% | +3.8% | +5.1% | +4.5% | +6.6% |
| 2016-12 | +4.3% | +2.8% | +3.0% | +2.5% | +4.9% |
| 2017-01 | +1.8% | +0.3% | 0.0% | +0.2% | +2.3% |
| 2017-02 | +0.9% | -1.3% | -1.5% | -1.0% | +1.6% |
| 2017-03 | +0.2% | -2.6% | -2.3% | -1.9% | +1.0% |
| 2017-04 | +0.4% | -1.7% | -1.7% | -1.9% | +1.1% |
| 2017-05 | +1.4% | +0.3% | -0.1% | -0.9% | +2.1% |
| 2017-06 | +4.5% | +3.5% | +3.0% | +2.3% | +5.1% |
| 2017-07 | +4.8% | +3.1% | +3.1% | +2.6% | +5.4% |
| 2017-08 | +5.3% | +3.4% | +3.6% | +3.6% | +5.8% |
| 2017-09 | +2.6% | +1.6% | +1.1% | +1.1% | +3.0% |
| 2017-10 | +0.3% | +0.1% | -0.4% | -0.2% | +0.5% |
| 2017-11 | -4.2% | -4.8% | -4.8% | -4.5% | -4.1% |
| 2017-12 | -4.7% | -5.7% | -5.2% | -4.7% | -4.7% |
| 2018-01 | -2.4% | -3.6% | -2.8% | -2.7% | -2.3% |
| 2018-02 | +2.3% | +2.0% | +2.3% | +2.4% | +2.3% |
| 2018-03 | +0.8% | +0.9% | +1.4% | +1.6% | +0.6% |
| 2018-04 | +0.2% | +0.5% | +1.1% | +1.9% | -0.2% |
| 2018-05 | -4.0% | -2.5% | -2.0% | -1.2% | -4.7% |
| 2018-06 | -4.9% | -2.1% | -2.2% | -2.0% | -5.6% |
| 2018-07 | -5.3% | -1.4% | -2.1% | -2.3% | -6.1% |
| 2018-08 | -5.5% | -1.8% | -2.8% | -3.3% | -6.1% |
| 2018-09 | -6.2% | -3.1% | -3.7% | -4.1% | -6.7% |
| 2018-10 | -5.5% | -3.3% | -3.9% | -4.2% | -5.9% |
| 2018-11 | +1.2% | +4.6% | +3.2% | +3.0% | +0.7% |
| 2018-12 | +3.1% | +6.6% | +4.9% | +4.6% | +2.7% |
| 2019-01 | +1.7% | +5.5% | +3.7% | +3.4% | +1.2% |
| 2019-02 | -5.1% | -2.5% | -3.6% | -3.9% | -5.4% |
| 2019-03 | -5.5% | -3.2% | -4.0% | -4.3% | -5.8% |
| 2019-04 | -6.1% | -4.1% | -4.6% | -5.0% | -6.4% |
| 2019-05 | -1.3% | +0.1% | -0.1% | -0.5% | -1.6% |
| 2019-06 | -1.0% | -0.3% | -0.1% | -0.1% | -1.3% |
| 2019-07 | -0.4% | -1.0% | -0.1% | +0.3% | -0.6% |
| 2019-08 | -2.1% | -2.7% | -1.6% | -0.9% | -2.4% |
| 2019-09 | +1.2% | +0.8% | +1.3% | +2.2% | +1.0% |
| 2019-10 | +3.3% | +4.1% | +4.3% | +4.9% | +2.9% |
| 2019-11 | +1.9% | +2.3% | +3.0% | +3.1% | +1.6% |
| 2019-12 | +1.5% | +2.4% | +3.5% | +3.0% | +1.1% |
| 2020-01 | +0.4% | +0.9% | +2.1% | +1.9% | 0.0% |
| 2020-02 | +1.5% | +3.2% | +4.0% | +3.8% | +0.9% |
| 2020-03 | +1.7% | +3.8% | +4.1% | +3.9% | +1.1% |
| 2020-04 | +3.5% | +6.8% | +6.6% | +5.6% | +2.9% |
| 2020-05 | +4.4% | +7.6% | +6.5% | +5.1% | +4.1% |
| 2020-06 | +3.4% | +6.3% | +5.5% | +4.2% | +3.0% |
| 2020-07 | +2.2% | +5.0% | +4.1% | +3.3% | +1.8% |
| 2020-08 | +2.1% | +5.0% | +4.8% | +4.0% | +1.5% |
| 2020-09 | +1.2% | +4.6% | +4.8% | +3.7% | +0.5% |
| 2020-10 | +1.0% | +4.1% | +4.7% | +4.1% | +0.1% |
| 2020-11 | +3.5% | +6.4% | +6.7% | +7.0% | +2.5% |
| 2020-12 | +6.0% | +8.7% | +8.7% | +9.9% | +5.0% |
| 2021-01 | +5.7% | +7.8% | +7.9% | +8.9% | +4.8% |
| 2021-02 | +2.4% | +2.8% | +3.6% | +4.8% | +1.8% |
| 2021-03 | +0.1% | -1.5% | -0.1% | +1.4% | -0.2% |
| 2021-04 | -2.4% | -5.2% | -3.5% | -1.4% | -2.5% |
| 2021-05 | -5.6% | -7.9% | -6.4% | -4.0% | -5.8% |
| 2021-06 | -5.6% | -7.6% | -6.5% | -3.8% | -5.9% |
| 2021-07 | -8.5% | -8.9% | -8.7% | -7.4% | -8.7% |
| 2021-08 | -8.0% | -6.7% | -7.6% | -7.5% | -8.2% |
| 2021-09 | -8.5% | -6.6% | -7.9% | -8.5% | -8.6% |
| 2021-10 | -7.4% | -4.7% | -6.3% | -7.2% | -7.6% |
| 2021-11 | -8.0% | -5.4% | -6.7% | -7.9% | -8.1% |
| 2021-12 | -10.2% | -6.9% | -8.4% | -10.2% | -10.5% |
| 2022-01 | -6.3% | -2.5% | -3.8% | -5.5% | -6.7% |
| 2022-02 | -2.0% | +2.3% | +0.9% | -0.9% | -2.5% |
| 2022-03 | -1.0% | +5.4% | +3.3% | +0.9% | -1.8% |
| 2022-04 | 0.0% | +6.7% | +4.5% | +2.1% | -0.9% |
| 2022-05 | +0.4% | +7.6% | +5.6% | +3.2% | -0.7% |
| 2022-06 | +3.9% | +10.8% | +9.1% | +6.2% | +2.8% |
| 2022-07 | +9.4% | +15.4% | +14.7% | +12.8% | +8.1% |
| 2022-08 | +10.9% | +14.0% | +14.5% | +14.2% | +9.6% |
| 2022-09 | +10.8% | +12.8% | +13.9% | +14.7% | +9.3% |
| 2022-10 | +7.1% | +7.5% | +8.7% | +10.0% | +6.1% |
| 2022-11 | +5.4% | +6.2% | +6.8% | +8.0% | +4.5% |
| 2022-12 | +5.1% | +4.4% | +5.4% | +7.0% | +4.4% |
| 2023-01 | +3.6% | +3.8% | +4.4% | +5.3% | +3.0% |
| 2023-02 | +1.2% | +1.9% | +2.5% | +2.8% | +0.6% |
| 2023-03 | +0.3% | +1.2% | +1.7% | +1.6% | -0.3% |
| 2023-04 | -1.9% | -0.7% | -0.5% | -1.0% | -2.4% |
| 2023-05 | -0.3% | 0.0% | +0.5% | 0.0% | -0.6% |
| 2023-06 | -0.6% | +0.2% | +0.5% | +0.2% | -1.0% |
| 2023-07 | -1.5% | -0.8% | -0.6% | -0.8% | -1.9% |
| 2023-08 | -3.0% | -1.3% | -1.9% | -2.2% | -3.4% |
| 2023-09 | -1.2% | -0.2% | -0.6% | -0.8% | -1.4% |
| 2023-10 | +0.3% | +0.7% | +0.7% | +0.5% | +0.3% |
| 2023-11 | 0.0% | -0.2% | +0.5% | -0.1% | 0.0% |
| 2023-12 | -3.7% | -4.0% | -3.3% | -3.9% | -3.6% |
| 2024-01 | -5.4% | -6.0% | -5.5% | -5.5% | -5.3% |
| 2024-02 | -2.7% | -3.7% | -2.9% | -2.5% | -2.7% |
| 2024-03 | -0.8% | -2.3% | -1.5% | -0.6% | -0.9% |
| 2024-04 | +1.2% | -0.5% | +0.8% | +1.5% | +1.1% |
| 2024-05 | -0.4% | -1.9% | -1.1% | -0.2% | -0.4% |
| 2024-06 | +1.2% | -0.7% | +0.4% | +1.2% | +1.3% |
| 2024-07 | +1.6% | -0.1% | +0.7% | +1.7% | +1.7% |
| 2024-08 | +2.3% | -0.1% | +1.3% | +2.5% | +2.4% |
| 2024-09 | -1.3% | -2.4% | -1.6% | -0.9% | -1.4% |
| 2024-10 | -1.3% | -1.8% | -1.4% | -0.9% | -1.4% |
| 2024-11 | -1.0% | -1.1% | -0.9% | -0.3% | -1.2% |
| 2024-12 | +2.7% | +2.9% | +3.1% | +3.7% | +2.3% |
| 2025-01 | +3.3% | +3.6% | +3.9% | +4.6% | +2.9% |
| 2025-02 | +2.7% | +3.4% | +3.2% | +4.0% | +2.3% |
| 2025-03 | +3.0% | +1.3% | +2.0% | +4.1% | +2.7% |
| 2025-04 | +2.9% | +2.8% | +3.3% | +4.6% | +2.5% |
| 2025-05 | +1.5% | +2.5% | +3.2% | +3.8% | +0.8% |
| 2025-06 | -2.7% | +0.7% | +0.8% | +0.3% | -3.8% |
| 2025-07 | -3.5% | -1.6% | -1.2% | -0.9% | -4.3% |
| 2025-08 | -1.6% | -0.1% | +0.6% | +0.9% | -2.5% |
| 2025-09 | +2.2% | +3.3% | +4.3% | +5.0% | +1.4% |
| 2025-10 | +2.2% | +3.8% | +5.2% | +5.7% | +1.1% |
| 2025-11 | +1.8% | +3.5% | +4.7% | +5.6% | +0.6% |
| 2025-12 | +0.8% | +2.7% | +3.9% | +4.3% | -0.3% |
| 2026-01 | -0.7% | +1.7% | +2.8% | +2.7% | -1.9% |
| 2026-02 | -2.3% | +0.2% | +1.3% | +0.5% | -3.2% |
| 2026-03 | -3.3% | +0.8% | +1.5% | +0.5% | -4.6% |
| 2026-04 | -1.2% | +1.2% | +1.6% | +1.8% | -2.2% |
Sold House Prices in Southwark
The average sold price across all property types in Southwark is £572,455 on the April 2026 reading, which is 97.4% above the March 2026 England average of £289,946. The premium widens sharply with the size of the home: detached houses cost 265.8% more than the England average, while flats cost 119.4% more. Flats are the largest single type of home in every postcode, and the majority in all but SE21.
| Property Type | Southwark Average | England Average | Difference |
|---|---|---|---|
| Detached houses | £1,721,044 | £470,492 | +265.8% |
| Semi-detached houses | £1,215,320 | £288,185 | +321.7% |
| Terraced houses | £834,935 | £243,788 | +242.5% |
| Flats and maisonettes | £470,801 | £214,563 | +119.4% |
| All property types | £572,455 | £289,946 | +97.4% |
Detached houses at £1,721,044 are 265.8% above the England average, but they are a small share of the stock: 20.8% of homes in SE21, 4.4% in SE22 and under 3% everywhere else. Detached values rose 1.2% over the year.
Semi-detached houses at £1,215,320 carry the widest premium of all four types at 321.7% above England. Outside Dulwich, semis barely feature: 25.2% of homes in SE21 and 18.6% in SE22, then under 8% in every other postcode. Semi-detached values rose 1.6% over the year.
Terraced houses at £834,935 sit 242.5% above the England average. The largest terrace shares are in SE15 (24.5%), SE22 (23.8%) and SE21 (21.2%), and terraced values grew 1.8% over the year, the fastest of the four types.
Flats and maisonettes at £470,801 are 119.4% above England, the narrowest premium of the four. Flats are 88.0% of the stock in SE1, 84.6% in SE17 and 74.7% in SE16, and the all-property average of £572,455 sits much closer to the flat figure than to any house type. Flat values fell 2.2% over the year while all three house types rose, and the all-types reading came in at -1.2%.
Price Per Square Foot in Southwark
£152 per square foot separates Southwark's cheapest postcode from its dearest, with SE5 at £663 and SE1 at £815. Pricing by the square foot strips out how large the homes are, though not the type or condition of what sold. The order does not follow distance from the river: SE1 on the South Bank tops the table at £815, but East Dulwich's SE22, at the far end of the borough, is next at £791, while central SE5 is the cheapest.
| Rank | Area | Price Per Sq Ft |
|---|---|---|
| 1 | SE5 (Camberwell) | £663 |
| 2 | SE16 (Rotherhithe, Bermondsey) | £671 |
| 3 | SE17 (Walworth, Elephant & Castle) | £693 |
| 4 | SE15 (Peckham, Nunhead) | £696 |
| 5 | SE21 (Dulwich) | £724 |
| 6 | SE22 (East Dulwich) | £791 |
| 7 | SE1 (South Bank, Borough, Bermondsey) | £815 |
SE5 at £663 per square foot is the most affordable space in the borough, covering Camberwell and Denmark Hill in the centre of Southwark. Based on 518 sales, its rate sits about 19% below SE1's.
Space in East Dulwich costs almost as much as on the South Bank: SE22 averages £791 per square foot against SE1's £815, the SE1 figure from 755 sales. SE1 wraps the South Bank and Bankside directly across the river from the City, and 88.0% of its stock is flats. SE22 is the one postcode near the top of this table with a large house share, at 46.8%.
For Sale Asking Prices in Southwark
SE16 at £473,663 and SE1 at £714,030 sit 50.7% apart, the full width of Southwark's asking-price range. The hierarchy splits the borough into a cheaper central and southern band and a dearer riverside-and-Dulwich band, with the Rotherhithe and Camberwell postcodes the most affordable. The mean asking price across all seven postcodes is £588,476.
| Rank | Area | Asking Price |
|---|---|---|
| 1 | SE16 (Rotherhithe, Bermondsey) | £473,663 |
| 2 | SE5 (Camberwell) | £477,979 |
| 3 | SE15 (Peckham, Nunhead) | £527,295 |
| 4 | SE17 (Walworth, Elephant & Castle) | £571,043 |
| 5 | SE22 (East Dulwich) | £650,883 |
| 6 | SE21 (Dulwich) | £704,442 |
| 7 | SE1 (South Bank, Borough, Bermondsey) | £714,030 |
SE16 at £473,663 is the cheapest way into the borough, covering Rotherhithe and the Bermondsey docks where the Canada Water scheme is adding thousands of new flats. It sits just below SE5 in Camberwell at £477,979, and the two are the borough's two lowest asking prices. Both sit below the borough's Land Registry sold average of £572,455.
SE1 at £714,030 is the most expensive, the South Bank and Borough market of small central flats facing the City across the river. The £240,367 step from SE16 to SE1 buys a more central postcode at a higher price per square foot, £815 against £671, and the yield table below shows the income return on each.

House Price Growth in Southwark
SE17 leads Southwark on five-year growth at 22.1%, with SE21 next at 18.7%, while SE1 sits at the other extreme, down 26.2% over the same period. Four of the seven postcodes are up over five years and three are down. Over one year, only SE21, SE22 and SE15 are up.
| Area | 1 Year | 3 Years | 5 Years |
|---|---|---|---|
| SE17 (Walworth, Elephant & Castle) | -16.8% | 2.3% | 22.1% |
| SE21 (Dulwich) | 8.2% | 20.2% | 18.7% |
| SE22 (East Dulwich) | 8.5% | 14.5% | 4.9% |
| SE15 (Peckham, Nunhead) | 2.6% | -1.1% | 1.0% |
| SE16 (Rotherhithe, Bermondsey) | -1.0% | -7.6% | -0.6% |
| SE5 (Camberwell) | -2.3% | -2.8% | -1.4% |
| SE1 (South Bank, Borough, Bermondsey) | -3.4% | -13.6% | -26.2% |
SE21 (Dulwich) posted a five-year return of 18.7% alongside a 20.2% three-year gain and 8.2% over the past year, one of two postcodes positive across all three windows, with SE22 (East Dulwich) the other at 8.5%, 14.5% and 4.9%. SE17 (Walworth) shows the strongest five-year figure at 22.1%, but its -16.8% one-year reading is the sharpest fall in the table, so its record is the most uneven of the seven.
SE1 (South Bank, Borough) sits at the bottom, down 26.2% over five years and 13.6% over three. It is the dearest postcode per square foot and has the weakest three-year and five-year figures in the table; the largest one-year fall is SE17's 16.8%.
Monthly Property Sales in Southwark
Southwark records around 169 sales a month across its seven postcodes, with SE15 (Peckham) the busiest at 41 and SE21 (Dulwich) the quietest at 8. Turnover here is monthly sales as a share of the homes on the market at the time.
| Area | Sales Per Month | Turnover | Asking Price |
|---|---|---|---|
| SE15 (Peckham, Nunhead) | 41 | 9% | £527,295 |
| SE1 (South Bank, Borough, Bermondsey) | 38 | 3% | £714,030 |
| SE16 (Rotherhithe, Bermondsey) | 28 | 6% | £473,663 |
| SE5 (Camberwell) | 21 | 6% | £477,979 |
| SE22 (East Dulwich) | 19 | 6% | £650,883 |
| SE17 (Walworth, Elephant & Castle) | 14 | 5% | £571,043 |
| SE21 (Dulwich) | 8 | 6% | £704,442 |
SE15 is the busiest market at 41 sales a month on 9% turnover, the highest in the borough. SE1 is close behind on volume at 38 sales a month, but on just 3% turnover, so its 38 sales are a small share of a much larger number of homes advertised for sale.
SE21 in Dulwich is the quietest at 8 sales a month, and it has the highest outright ownership in the borough at 36.5%. Its growth is positive over every window in the table above.
How Long Properties Take to Sell in Southwark
SE15 (Peckham) is the only Southwark postcode rated a balanced market, with homes taking an estimated 338 days to sell, while in SE1 the estimate is roughly 1,014 days on 33 months of unsold stock. The days figure is an estimate from the current pace of sales, not a measured time from listing to completion; months of unsold stock is how many months of homes are on the market at that pace. A headline yield says nothing about how long your money is likely to be tied up at the end, and in Southwark that estimate runs from under a year to nearly three. The table is ranked fastest first.
| Area | Avg Days to Sell | Months of Unsold Stock | Market |
|---|---|---|---|
| SE15 (Peckham, Nunhead) | 338 | 11.1 | Balanced market |
| SE5 (Camberwell) | 435 | 14.3 | Buyer's market |
| SE21 (Dulwich) | 435 | 14.3 | Buyer's market |
| SE16 (Rotherhithe, Bermondsey) | 507 | 16.7 | Buyer's market |
| SE22 (East Dulwich) | 608 | 20.0 | Buyer's market |
| SE17 (Walworth, Elephant & Castle) | 761 | 25.0 | Buyer's market |
| SE1 (South Bank, Borough, Bermondsey) | 1,014 | 33.3 | Buyer's market |
SE15 in Peckham has the shortest estimated selling time at about 338 days on 11.1 months of unsold stock, the only postcode that registers as balanced rather than a buyer's market, which fits its position as the borough's busiest. At the other end, SE1 carries 33.3 months of unsold stock and an estimated 1,014 days to sell, three times SE15's figure, so each month's sales clear a far smaller share of the listings there.
What Type of Property Can You Buy in Southwark?
Flats dominate the riverside and central postcodes, from 88.0% of stock in SE1 down to 32.9% in Dulwich's SE21, where houses make up the majority instead. Flats are the largest single type in every postcode, and the majority in all but SE21. Houses make up most of SE21's homes at 67.2%, but they are still a minority in SE22 at 46.8% and SE15 at 34.3%. The shares quoted here and in the table are the housing-type breakdown a commercial property-data provider reports for each postcode, which it describes as Census-based. The Census release and the areas behind each figure are not specified in the data we hold, so read the percentages as the provider's reported figures rather than verified proportions of all the homes in the postcode.
| Area | Detached | Semi-detached | Terraced | Flats |
|---|---|---|---|---|
| SE1 (South Bank, Borough, Bermondsey) | 0.7% | 2.3% | 8.8% | 88.0% |
| SE17 (Walworth, Elephant & Castle) | 1.1% | 2.6% | 11.6% | 84.6% |
| SE5 (Camberwell) | 2.6% | 5.9% | 15.8% | 75.7% |
| SE16 (Rotherhithe, Bermondsey) | 1.5% | 5.9% | 17.2% | 74.7% |
| SE15 (Peckham, Nunhead) | 2.5% | 7.3% | 24.5% | 65.5% |
| SE22 (East Dulwich) | 4.4% | 18.6% | 23.8% | 53.1% |
| SE21 (Dulwich) | 20.8% | 25.2% | 21.2% | 32.9% |
SE1 and SE17 are almost entirely flats, at 88.0% and 84.6%, the dense central postcodes around Borough, Bankside and Elephant & Castle where purpose-built blocks and converted period buildings make up nearly all the stock. Houses of any kind are a small slice here, 11.8% of the stock in SE1 and 15.3% in SE17.
SE21 in Dulwich is the outlier, the only postcode where flats fall to a minority at 32.9%, with detached and semi-detached houses together making up 46.0% of the stock. East Dulwich's SE22 is a halfway market at 53.1% flats and 18.6% semi-detached. SE15 (Peckham) has the next largest house share at 34.3%, most of it terraces.
Flats combine purpose-built blocks and converted units, and a small share of other dwelling types is left out, so rows may not total 100%.
Southwark Rental Market Analysis
Monthly rents in Southwark range from £2,172 in SE15 to £2,920 in SE1, with gross rental yields from 4.1% to 6.0% across the seven postcodes. The sections below break down rents, yields and tenant affordability postcode by postcode, alongside the wider question of whether buy to let is worth it. Current buy-to-let property listings provide a separate view of available stock across the capital.
Average Rent & Gross Rental Yields in Southwark
Gross rental yields in Southwark run from 4.1% in SE22 to 6.0% in SE16. The lowest asking prices and the highest yields sit in the same two postcodes, SE16 and SE5, with SE17 matching SE5 at 5.6%, while the two Dulwich postcodes yield the least.
| Area | Average Monthly Rent | Asking Price | Gross Yield |
|---|---|---|---|
| SE16 (Rotherhithe, Bermondsey) | £2,366 | £473,663 | 6.0% |
| SE5 (Camberwell) | £2,212 | £477,979 | 5.6% |
| SE17 (Walworth, Elephant & Castle) | £2,665 | £571,043 | 5.6% |
| SE1 (South Bank, Borough, Bermondsey) | £2,920 | £714,030 | 4.9% |
| SE15 (Peckham, Nunhead) | £2,172 | £527,295 | 4.9% |
| SE21 (Dulwich) | £2,450 | £704,442 | 4.2% |
| SE22 (East Dulwich) | £2,230 | £650,883 | 4.1% |
SE16 tops the yield table at 6.0%, the only postcode at or above 6%, pairing the borough's lowest asking price of £473,663 with a £2,366 monthly rent in Rotherhithe and Bermondsey. A 30% deposit there is £142,099, the lowest figure in Southwark. Camberwell's SE5 and Walworth's SE17 both return 5.6%, on very different asking prices of £477,979 and £571,043, because SE17's rent is £453 a month higher.
SE22 in East Dulwich sits at the bottom of the yield table at 4.1%, where a £650,883 asking price meets a £2,230 rent. SE21 is next at 4.2% on a £704,442 asking price. Rents in the two Dulwich postcodes, £2,230 and £2,450, sit near the borough's middle, so it is the asking prices, both above £650,000, that pull the yields down.
Is Southwark Rent High?
Southwark rents consume between 53.5% and 72.0% of the local median individual salary, well above the 30% affordability benchmark and a clear marker of how the borough's rental market is priced. The affordability benchmark used here is 30% of gross income. No Southwark postcode comes close to that on a single median salary.
The median gross weekly salary in Southwark is £939.90, and the median annual salary is £48,681, about £4,057 a month. That sits above the London median of £902.70 a week and well clear of the Great Britain median of £766.60. Data from the Nomis Labour Market Profile (ASHE 2025).
| Rank | Area | Rent as % of Income |
|---|---|---|
| 1 | SE1 (South Bank, Borough, Bermondsey) | 72.0% |
| 2 | SE17 (Walworth, Elephant & Castle) | 65.7% |
| 3 | SE21 (Dulwich) | 60.4% |
| 4 | SE16 (Rotherhithe, Bermondsey) | 58.3% |
| 5 | SE22 (East Dulwich) | 55.0% |
| 6 | SE5 (Camberwell) | 54.5% |
| 7 | SE15 (Peckham, Nunhead) | 53.5% |
These figures compare the average advertised rent for a whole home against a single resident's median pay, so they read high by design, and they say nothing about how many incomes go into a tenancy. SE15 in Peckham at 53.5% is the most affordable on this measure, where the borough's lowest rent meets the same median salary.
How Big Is Southwark's Private Rented Sector?
The private rented sector is deepest in SE1 and SE16, where it accounts for 37.7% and 35.4% of households, and shallowest in Dulwich's SE21 at 17.9%. In the central postcodes, social renting takes a similar share of households to private renting, so the private rented figures below are only part of the rental picture. The table below shows household tenure by postcode.
| Area | Owned Outright | Owned with Mortgage | Private Rented | Social Rented |
|---|---|---|---|---|
| SE1 (South Bank, Borough, Bermondsey) | 9.3% | 12.6% | 37.7% | 37.5% |
| SE16 (Rotherhithe, Bermondsey) | 9.6% | 15.7% | 35.4% | 36.4% |
| SE17 (Walworth, Elephant & Castle) | 6.8% | 12.7% | 28.5% | 48.5% |
| SE22 (East Dulwich) | 21.9% | 32.7% | 26.7% | 17.7% |
| SE5 (Camberwell) | 10.6% | 20.2% | 26.2% | 40.6% |
| SE15 (Peckham, Nunhead) | 11.4% | 20.7% | 23.4% | 41.7% |
| SE21 (Dulwich) | 36.5% | 31.7% | 17.9% | 13.2% |
SE1 and SE16 hold the largest private rented sectors at 37.7% and 35.4%. In SE1 private renting narrowly leads social renting at 37.5%; in SE16 social renting is the larger tenure at 36.4%. Neither is a majority in either postcode.
Social renting runs from 36.4% of households in SE16 up to 48.5% in Walworth's SE17. Dulwich is the exception: in SE21 outright ownership reaches 36.5% and the private rented share drops to 17.9%. The tenure figures count households by how they hold their home; they do not say who the renters are.
Local Housing Allowance Rates in Southwark
All seven Southwark postcodes fall in the single Inner South East London Broad Rental Market Area, so the Local Housing Allowance rates are uniform across the borough, from £149.59 a week for a room to £604.11 for a four-bed. Local Housing Allowance rates cap the rent that housing support will count towards a claim. The award can be lower than the rate, and market rents can sit above or below it. To check the figure for a specific address, use the government's official Local Housing Allowance calculator.
| Property Size | Inner South East London (weekly) |
|---|---|
| Shared accommodation | £149.59 |
| 1 bedroom | £298.15 |
| 2 bedrooms | £356.71 |
| 3 bedrooms | £448.77 |
| 4 bedrooms | £604.11 |
The two-bedroom rate of £356.71 a week works out at about £1,546 a month, and the four-bedroom rate of £604.11 at about £2,618. The rent table above averages every home advertised in a postcode whatever its size, so the two are not a like-for-like pair: the two-bed rate sits below every postcode's average rent, while the four-bed rate is above five of the seven. Housing support is calculated on rent up to the Inner South East London rate. Awards can be lower, and the tenant pays whatever rent the award leaves uncovered. These rates are the June 2026 figures and are reset each April.
Buy-to-Let Considerations
Are House Prices High in Southwark? Price-to-Earnings Ratios
Buying in Southwark takes between 9.7 and 14.7 times the local median salary, with every postcode well above the national benchmark. This is based on the Nomis Labour Market Profile for Southwark, which puts the median gross annual income for residents at £48,681.
The national benchmark for price-to-earnings is 7.4x (England's average sold price of £289,946 divided by the Great Britain median annual salary of £39,125). No Southwark postcode comes close to that, which puts the whole borough firmly in expensive territory relative to local incomes, even before the deposit and purchase costs are added.
| Rank | Area | Price-to-Earnings Ratio |
|---|---|---|
| 1 | SE16 (Rotherhithe, Bermondsey) | 9.7x |
| 2 | SE5 (Camberwell) | 9.8x |
| 3 | SE15 (Peckham, Nunhead) | 10.8x |
| 4 | SE17 (Walworth, Elephant & Castle) | 11.7x |
| 5 | SE22 (East Dulwich) | 13.4x |
| 6 | SE21 (Dulwich) | 14.5x |
| 7 | SE1 (South Bank, Borough, Bermondsey) | 14.7x |
SE16 and SE5 are the most affordable on this measure at 9.7x and 9.8x, still well above the national 7.4x. Even the cheapest way into Rotherhithe or Camberwell takes nearly ten years of the local median salary.
SE1 at 14.7x is the least affordable, with SE21 in Dulwich just behind at 14.5x. SE21 sits second from bottom of the yield table at 4.2%, while SE1's £2,920 rent, the highest in the borough, lifts it to 4.9%, level with SE15.
Deposit Requirements in Southwark
A 30% deposit on a buy-to-let in Southwark ranges from £142,099 in SE16 to £214,209 in SE1. The £72,110 gap between them is 51% of the SE16 figure.
Beyond the deposit, the stamp duty calculation and other buy-to-let running costs add materially to the capital required, particularly at Southwark's price points where the surcharge on additional property runs into five figures on its own.
| Rank | Area | 30% Deposit Required |
|---|---|---|
| 1 | SE16 (Rotherhithe, Bermondsey) | £142,099 |
| 2 | SE5 (Camberwell) | £143,394 |
| 3 | SE15 (Peckham, Nunhead) | £158,188 |
| 4 | SE17 (Walworth, Elephant & Castle) | £171,313 |
| 5 | SE22 (East Dulwich) | £195,265 |
| 6 | SE21 (Dulwich) | £211,333 |
| 7 | SE1 (South Bank, Borough, Bermondsey) | £214,209 |
SE16 keeps the entry cost down at a £142,099 deposit, and SE5 is within about £1,300 of it. Rotherhithe and Camberwell pair the two lowest deposits with the two highest yields in the borough, 6.0% and 5.6%, with SE17 also on 5.6%.
At the top, SE1 needs a £214,209 deposit, around £72,000 more than SE16, for a postcode that yields 4.9% and has the longest estimated selling time in the borough at 1,014 days, on 33.3 months of unsold stock.
What the Southwark Data Tells Buy-to-Let Investors
In Southwark the cheapest postcodes are also the highest-yielding. SE16 (Rotherhithe, Bermondsey) carries the top yield at 6.0% and is also the cheapest way in, at a £473,663 asking price for an investment property in Southwark, and the most affordable against local earnings at 9.7 times income. A 30% deposit there is £142,099, the lowest in the borough, for a home renting at £2,366 a month, with the Canada Water scheme adding thousands of new flats and jobs on its doorstep.
The yield and growth tables do not rank the postcodes the same way. The three highest yields sit in SE16, SE5 and SE17; SE16 and SE5 are down over five years, while SE17 is up 22.1%, the most in the borough, after a -16.8% year. The two Dulwich postcodes yield the least, 4.2% and 4.1%, and are the only two up over one, three and five years. SE1 is down 26.2% over five years.
The flat-dominated stock is the defining feature across most of the borough. Flats make up between 65.5% and 88.0% of homes in five of the seven postcodes, and the all-property sold average of £572,455 sits close to the flat figure of £470,801 rather than the far higher house prices. The largest house shares are in SE21 and SE22, and SE15 has a third of its stock in houses too.
Southwark carries a high deposit and its prices have been broadly flat: roughly flat over five years and down over ten, and about 8.0% below its December 2020 high. Six of the seven postcodes are rated buyer's markets, with SE1 carrying 33 months of unsold stock. Our below market value and off-market property pages cover how purchases below asking are sourced.
How Southwark Compares
Southwark's mean asking price of £588,476 places it just above its inner-south-London neighbours Lambeth and Lewisham but below Wandsworth, while its top yield of 6.0% is the joint-highest of the four with Lewisham. The comparison below sets Southwark alongside three nearby boroughs, each with a different balance of price and income return. Mean asking price and mean monthly rent are simple averages across all postcodes with data, and top gross yield is the single highest postcode yield in each borough.
| Location | Mean Asking Price | Mean Monthly Rent | Mean Gross Yield | Top Yield (postcode) |
|---|---|---|---|---|
| Lewisham | £490,640 | £1,965 | 4.8% | 6.0% (SE8) |
| Lambeth | £587,762 | £2,368 | 4.8% | 5.6% (SE5) |
| Southwark | £588,476 | £2,431 | 5.0% | 6.0% (SE16) |
| Wandsworth | £663,635 | £2,770 | 5.0% | 5.3% (SW11, SW4) |
Southwark and Lambeth are near-identical on price, at £588,476 and £587,762, the two mid-table boroughs in this group, but Southwark edges ahead on both rent and top yield, reaching 6.0% against Lambeth's 5.6%. The two share a border, and both run from riverside flats down to leafier southern streets.
Lewisham matches Southwark's 6.0% top yield from a much lower £490,640 average, making it the cheaper route to the same headline income return, while Wandsworth is the most expensive at £663,635 and has the lowest top yield of the four at 5.3%, though its 5.0% mean yield matches Southwark's. Lewisham reaches the same 6.0% top yield for about £98,000 less on the mean asking price. For a data-driven comparison across the whole country, see our best places to invest in buy-to-let guide.
Frequently Asked Questions
What are buy-to-let prices, yields and growth in Southwark?
Better on income than on growth lately. Private renting is above 35% of households in the two riverside postcodes, and resident earnings are £48,681 a year, above the London median. Gross yields reach 6.0% in SE16, level with Lewisham's top yield and ahead of Lambeth and Wandsworth in the comparison on this page. On the capital side, the borough is about 8.0% below its December 2020 high, flat over five years and down over ten.
SE16, SE5 and SE17 pair the three highest yields with three of the four lowest asking prices, while the Dulwich postcodes cost more, yield less, and are up over every growth window. The postcode figures differ far more than the borough-wide average suggests.
What are the best areas in Southwark for property investment?
The borough splits cleanly, and the goal points to the postcode. For yield, SE16 (Rotherhithe) leads at 6.0% with the lowest asking price at £473,663 and the cheapest deposit at £142,099, followed by SE5 (Camberwell) and SE17 (Walworth) at 5.6%. On growth, SE17 (Walworth) leads over five years at 22.1% but fell 16.8% in the last year, while SE21 (Dulwich) at 18.7% and SE22 (East Dulwich) at 4.9% are the only two up over one, three and five years; SE21 yields 4.2%.
SE15 (Peckham) records the most sales at 41 a month and is the only postcode rated a balanced market, with 11.1 months of unsold stock against 14 to 33 months elsewhere.
What are average house prices in Southwark?
The average sold price across Southwark is £572,455 on the Land Registry index, about 97.4% above the England average of £289,946 (Southwark's April 2026 reading against the March 2026 England figure). Asking prices by postcode run from £473,663 in SE16 (Rotherhithe) up to £714,030 in SE1 (South Bank, Borough), with a borough-wide mean of £588,476. By type, the index puts flats at £470,801, terraced houses at £834,935, semi-detached at £1,215,320 and detached at £1,721,044, and house shares are highest in SE21 and SE22, with SE15 next at 34.3%.
Through a buy-to-let lens, SE16 is the cheapest entry and the highest-yielding at 6.0%, while SE1 is the dearest and yields 4.9%, with the two Dulwich postcodes lowest at 4.2% and 4.1%.
What type of property is most common in Southwark?
Flats, across most of the borough. They run from 65.5% of the stock in SE15 (Peckham) up to 88.0% in SE1 (South Bank, Borough). The exception is Dulwich: in SE21 flats fall to 32.9% and houses make up the majority, with detached and semi-detached together at 46.0%, and East Dulwich's SE22 is a halfway market at 53.1% flats. Flats are the largest single type in every postcode, SE21 included, and the majority in all but SE21.
Why have Southwark house prices fallen recently?
Southwark reached an all-time high of £622,328 in December 2020 and has since eased to £572,455 by April 2026, around 8.0% below that peak. By postcode the picture is mixed: SE1 is down 26.2% over five years and SE16 is down 0.6%, while SE17 is up 22.1%, SE21 18.7%, SE22 4.9% and SE15 1.0%. By type, flats fell 2.2% over the last year while the three house types rose.
The longer view matters too. The borough is down about 3.7% over ten years but up 630.6% over 31 years, so the recent dip follows a decade of little net movement at the top of a long-run rise, rather than a sharp reversal of recent growth.
Is there demand for student and shared accommodation in Southwark?
Two university sites sit inside the borough. The London College of Communication, part of the University of the Arts London, is at Elephant and Castle in SE1 (postcode SE1 6SB) and moves to a new building across the road in September 2027, and King's College London runs its Denmark Hill campus in SE5 alongside the teaching hospitals there. The data does not show how much of the private renting in the central postcodes is student demand.
On the shared-house side, Southwark licenses beyond the mandatory HMO scheme. Additional licensing covers HMOs let to up to four people with shared facilities, section 257 converted blocks and flats in multiple occupation in purpose-built blocks (Southwark Council), and selective licensing covers single lets in a list of wards that includes Rotherhithe, Surrey Docks, Camberwell Green, Peckham and London Bridge and West Bermondsey (selective licensing wards), with the council's map showing whether a given address needs one. For how the numbers work on a shared house, see our guide to HMO property, and for the purpose-built end of the market, our guide to student property investment.
How does Southwark compare to Lambeth for buy-to-let?
They are near-identical on price and close neighbours, with Southwark slightly ahead on income. Southwark's mean asking price is £588,476 against Lambeth's £587,762, and its top yield is 6.0% against Lambeth's 5.6%, on a marginally higher average rent of £2,431 versus £2,368. Both are inner-south-London boroughs with a riverside-to-suburb spread of stock.
Southwark adds the larger regeneration pipeline, with Canada Water, Old Kent Road and Elephant & Castle all inside its boundary, while Lambeth offers a similar profile around Brixton and Streatham. The gap between the two borough averages is under £1,000 on asking price and £63 on rent; the postcode figures inside each borough vary far more than that.
What are the Local Housing Allowance rates in Southwark?
All seven Southwark postcodes fall in the Inner South East London Broad Rental Market Area, so the rate is the same across the borough. The June 2026 figures run from £149.59 a week for a shared room to £604.11 for a four-bed, with a one-bed at £298.15 and a two-bed at £356.71. Those figures are the most a tenant on housing support can claim. A tenant may receive less than these limits and remains responsible for any rent their award leaves unpaid. The rent table on this page averages every size of home, so the fair reading is by bedroom count: the two-bed rate is below every postcode's average rent, while the four-bed rate, about £2,618 a month, is above five of the seven.
How do I buy an investment property in Southwark?
The income and capital cases point to different postcodes. For yield, SE16 (Rotherhithe) is the cheapest entry at £473,663 and the highest-yielding at 6.0%, with SE5 and SE17 close behind at 5.6%. On growth, SE17 leads over five years at 22.1% and the two Dulwich postcodes are the only ones up over every window, on yields of 4.2% and 4.1%. A 30% deposit runs from £142,099 in SE16 to £214,209 in SE1.
Six of the seven postcodes are rated buyer's markets, with SE1 carrying around 33 months of unsold stock. Our off market properties and BMV property pages cover buying below asking. To see what is available now, browse investment properties or buy-to-let opportunities.
Ready to buy property?
Browse investment properties with prices and gross yields shown for each opportunity.
See the latest deals