Barnet Property Investment: Best Buy-to-Let Areas
Straddling the Northern Line and sitting at the gateway to North London, Barnet offers property investors a unique blend of urban connectivity and suburban tranquillity.
The borough's significant 42.4% premium on detached houses compared to London averages isn't just a statistic; it reflects the enduring appeal of an area where nearly 25% of the land remains as protected green belt, including beloved spaces like Hampstead Heath and Golders Hill Park.
From the sought-after bakeries and cafés of Golders Green to the village-like charm of Hampstead Garden Suburb, Barnet's diversity is its strength. While Golders Green commands eye-watering prices at over £1. million for an average home (requiring 31.67 times local annual salaries), Cockfosters and EN4 postcode offers London's northbound investors a compelling entry point with 4.70% yields – the borough's highest by a significant margin.
Below, our in-depth analysis of Barnet's property market will explore which areas offer the best balance between capital growth, rental returns and demand.
Article updated: September 2025
Barnet Buy-to-Let Market Overview 2025
Barnet's property market offers investors premium North London locations with prices averaging 4.5% above London's overall average. The borough shows dramatic variation across its postcodes, combining family-oriented suburban areas with prestigious neighbourhoods, where Cockfosters (EN4) delivers the highest yields at 4.7% while New Southgate (N11) provides the most accessible entry point at £500,151 average price.
- Asking price range: £500,151 (N11) to £1,049,492 (NW11) across Barnet postcodes
- Rental yields: 2.8% (N20) to 4.7% (EN4) across different postcodes
- Rental income: Weekly rents from £427 to £747 (monthly: £1,849 to £3,237)
- Price per sq ft: Market positioning from £535/sq ft to £781/sq ft
- Market activity: Sales ranging from 12 per month (NW11) to 33 per month (EN5)
- Deposit requirements: 30% deposits range from £150,045 (N11) to £314,848 (NW11)
- Affordability ratios: Property prices from 15.10 to 31.67 times Barnet's mean annual salary of £33,133
Contents

-
by Robert Jones, Founder of Property Investments UK
With two decades in UK property, Rob has been investing in buy-to-let since 2005, and uses property data to develop tools for property market analysis.
Property Data Sources
Our location guide relies on diverse, authoritative datasets including:
- HM Land Registry UK House Price Index
- Ministry of Housing, Communities and Local Government
- Government Planning and Housing Data
- Propertydata.co.uk
We update our property data quarterly to ensure accuracy. Last update: September 2025. All data is presented as provided by our sources without adjustments or amendments.
Why Invest in Barnet?
Barnet is one of the more expensive London boroughs with prices 4.5% higher than the London average.
Often in property, house price growth is seen to be closely connected with population growth. Barnet has seen a greater increase in population than both the UK and London population averages, which may partially tell the story of the significant property prices in the area.
The total population of Barnet was 388,955 (as of the last UK government census in 2021) and Barnet's population has increased by 8.8%, growing from 357,538 in 2011.
Barnet borough includes the towns of Barnet, Muswell Hill, New Southgate, North Finchley, East Finchley, Whetstone, Finchley, Golders Green, Hendon and Mill Hill.
Barnet is covered by the main postcodes: EN4, EN5, N3, N11, N12, N20, NW4, NW7, NW11, HA8
With additional postcodes that cross Barnet and other local London Boroughs including:
- N6 crosses Barnet, Camden, Haringey and Islington
- N14 crosses Barnet and Enfield
- NW2 crosses Barnet, Brent and Camden
- NW3 crosses Barnet and Camden
- NW9 crosses Barnet, Brent and Harrow
For investors considering other nearby areas, you can also explore buy-to-let opportunities across North London, including neighbouring boroughs like Hackney and Tottenham, each offering distinct investment characteristics and price points.
Barnet Property Market Analysis
When Was the Last House Price Crash in Barnet?
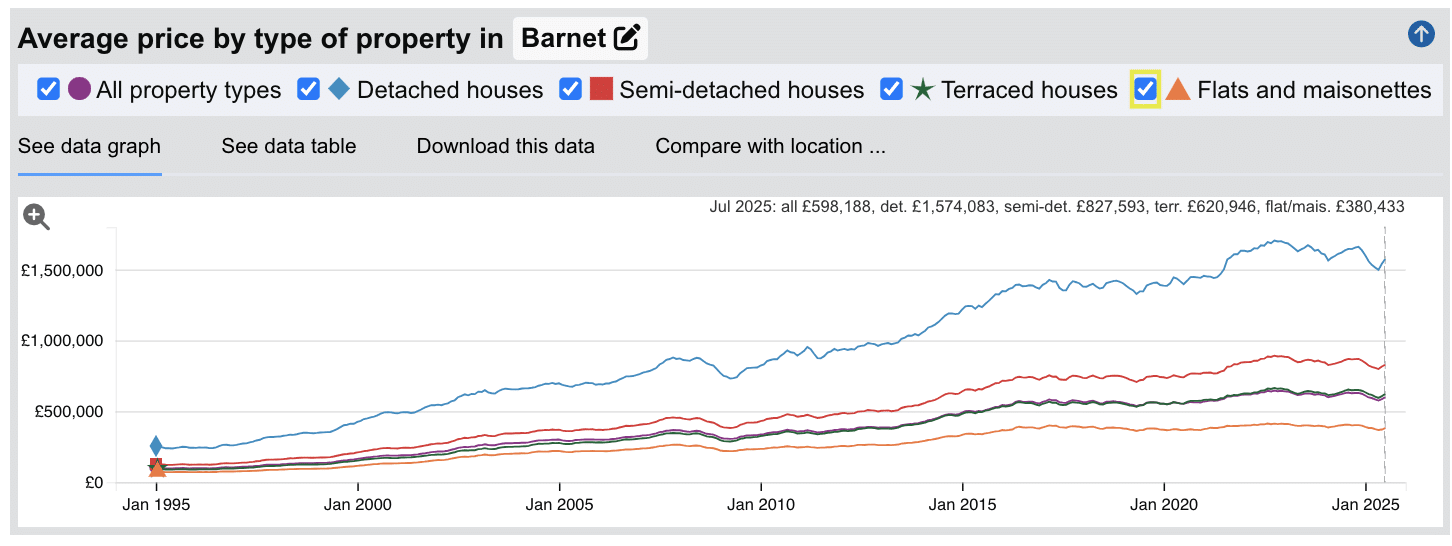
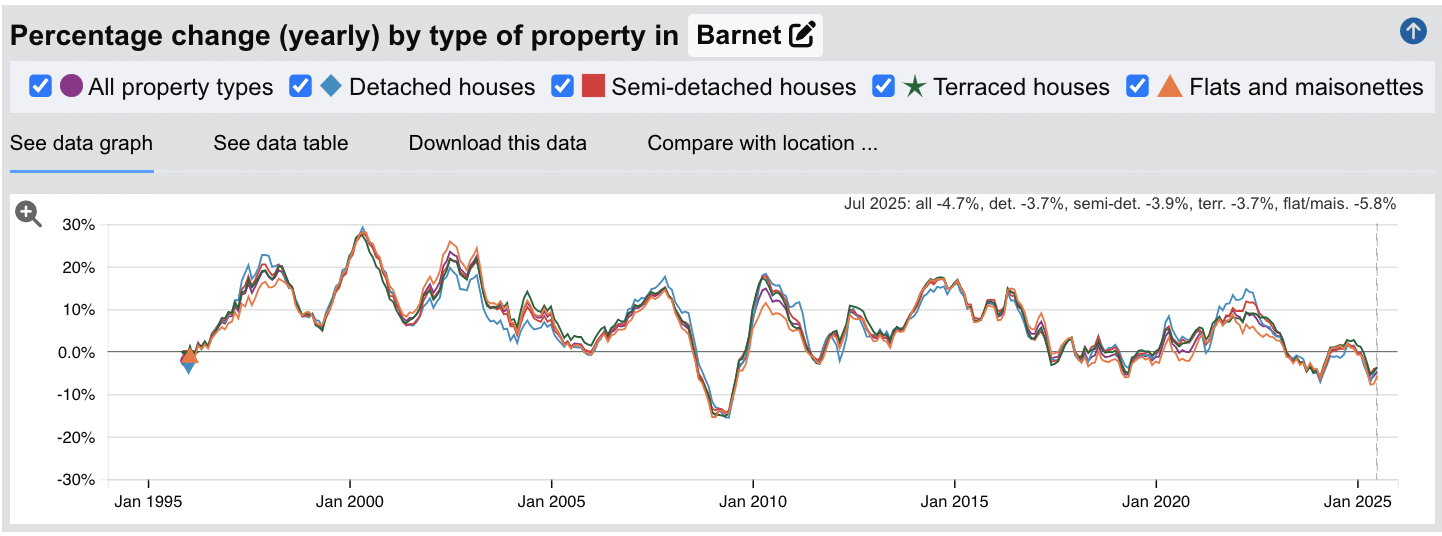
The last significant property price crash in Barnet occurred during the global financial crisis of 2008-2010, with a more modest correction in 2022-2024.
Source: HM Land Registry House Price Index for Barnet
Looking at the property data across all types:
- 1995-2000: Steady growth period with annual increases of 5-15%
- 2000-2003: Accelerated growth with peaks reaching 25-30% annual increases
- 2003-2007: Continued strong but somewhat moderated growth
- 2008-2010: Significant house price crash during the financial crisis, with values dropping by approximately 15%
- 2010-2013: Recovery period with modest growth resuming
- 2013-2016: Strong growth period with annual increases of 10-15%
- 2016-2020: Mixed performance with periods of growth and minor corrections
- 2020-2022: Despite pandemic uncertainty, strong growth resumed with values increasing significantly
- 2022-2024: Modest correction with declines across most property types
- 2025: Recent data (July 2025) shows continued negative annual growth across all property types: all properties (-4.7%), detached (-3.7%), semi-detached (-3.9%), terraced (-3.7%), and flats (-5.8%)
Barnet has demonstrated resilience during market downturns, particularly in its premium housing stock. Long-term price trajectories show substantial appreciation, with detached properties increasing from £250,463 in 1995 to £1,574,083 by July 2025 - a six-fold increase that significantly outperforms inflation.
This pattern reflects Barnet's enduring appeal as a North London borough offering excellent connectivity, highly-rated schools, and green spaces. The significant premium commanded by detached and semi-detached properties compared to London averages demonstrates Barnet's strength in the family home market.
Sold House Prices in Barnet
The latest sold house price index by the Land Registry, shows the following average 'sold' house prices across the London Borough of Barnet.
While detached houses in Barnet command a premium at 42.4% above the London average, semi-detached houses sit at 15.0% above typical London prices.
Terraced houses in Barnet show 1.2% below London averages, while flats and maisonettes are 20.3% below typical London prices.
For investors considering Barnet, the borough offers a more accessible entry point than central London while maintaining strong transport links and established residential appeal. Unlike ultra-premium boroughs like the City of Westminster, Barnet's price points make it a relevant option for landlords sticking to their investment property checklists where rental yields remain a deciding factor.
With average detached houses selling at £1,656,547, these properties primarily target family buyers and high-net-worth individuals seeking suburban London living with excellent schools and green spaces.
For those considering Barnet investment, the apartment market at £353,980 offers the most accessible entry point and represents a realistic starting point for many investors. The terrace market at £630,607 provides a middle ground for those seeking capital appreciation alongside rental income. Investors looking to build portfolios may find Barnet's mix of property types and price points attractive, with some retiring landlords benefiting from strong demand and maybe looking at how to sell a buy-to-let property will find willing buyers looking for income on day one from an established tenanted property.
Updated September 2025
| Property Type | Barnet Average Price | London Average | Difference |
|---|---|---|---|
| Detached houses | £1,656,547 | £1,163,469 | +42.4% |
| Semi-detached houses | £826,562 | £718,637 | +15.0% |
| Terraced houses | £630,607 | £638,278 | -1.2% |
| Flats and maisonettes | £353,980 | £443,692 | -20.3% |
| All property types | £586,594 | £561,309 | +4.5% |
Property Data Sources
Our location guide relies on diverse, authoritative datasets including:
- HM Land Registry UK House Price Index
- Ministry of Housing, Communities and Local Government
- Government Planning and Housing Data
- Propertydata.co.uk
We update our property data quarterly to ensure accuracy. Last update: September 2025. All data is presented as provided by our sources without adjustments or amendments.
For Sale Asking House Prices in Barnet
Updated September 2025
The data represents the average asking prices of properties currently listed for sale in Barnet.
| Rank | Area | Average House Price |
|---|---|---|
| 1 | NW11 (Golders Green) | £1,049,492 |
| 2 | N20 (Whetstone) | £882,830 |
| 3 | EN4 (Cockfosters) | £829,039 |
| 4 | NW7 (Mill Hill) | £717,790 |
| 5 | N3 (Finchley) | £711,667 |
| 6 | EN5 (High Barnet) | £660,352 |
| 7 | NW4 (Hendon) | £646,318 |
| 8 | HA8 (Edgware) | £549,234 |
| 9 | N12 (North Finchley) | £547,223 |
| 10 | N11 (New Southgate) | £500,151 |
Golders Green (NW11) commands the highest asking prices at £1,049,492, followed by Whetstone (N20) at £882,830 and Cockfosters (EN4) at £829,039. Mid-range prices include Mill Hill (NW7) and Finchley (N3) around £710,000-£720,000, with High Barnet (EN5) and Hendon (NW4) in the £640,000-£660,000 band. The most accessible entry points are Edgware (HA8), North Finchley (N12), and New Southgate (N11), ranging from £500,151 to £549,234.
These figures represent average asking prices across all property types, and actual achievable prices may vary depending on property size, condition, and specific location within each postcode.
Sold Price Per Square Foot in Barnet (£)
Updated September 2025
The data represents the average sold price per square foot of properties in Barnet.
| Rank | Area | Price Per Square Foot |
|---|---|---|
| 1 | NW11 (Golders Green) | £781 |
| 2 | N20 (Whetstone) | £654 |
| 3 | NW7 (Mill Hill) | £632 |
| 4 | N3 (Finchley Central) | £632 |
| 5 | EN4 (Cockfosters) | £625 |
| 6 | N12 (North Finchley) | £609 |
| 7 | EN5 (High Barnet) | £603 |
| 8 | NW4 (Hendon) | £583 |
| 9 | N11 (New Southgate) | £570 |
| 10 | HA8 (Edgware) | £535 |
Golders Green (NW11) commands the highest price per square foot at £781, reflecting its status as Barnet's most prestigious neighbourhood. Whetstone (N20) follows at £654, while Mill Hill (NW7) and Finchley Central (N3) both sit at £632. Cockfosters (EN4) records £625 per square foot. Mid-range values include North Finchley (N12) at £609, High Barnet (EN5) at £603, and Hendon (NW4) at £583. The most affordable price per square foot is found in Edgware (HA8) at £535, closely followed by New Southgate (N11) at £570.
These figures reflect the average across all property types and should be considered alongside factors such as building age, condition, and specific location within each postcode.
House Price Growth in Barnet (%)
Updated September 2025
The data represents the average house price growth over the past five years, calculated using a blended rolling annual comparison of both sold prices and asking prices.
| Rank | Area | 5 Year Growth |
|---|---|---|
| 1 | N11 (New Southgate) | 18.60% |
| 2 | NW11 (Golders Green) | 14.70% |
| 3 | HA8 (Edgware) | 14.30% |
| 4 | EN4 (Cockfosters) | 9.00% |
| 5 | N3 (Finchley) | 7.00% |
| 6 | N12 (North Finchley) | 2.90% |
| 7 | NW7 (Mill Hill) | 2.80% |
| 8 | NW4 (Hendon) | 2.20% |
| 9 | EN5 (High Barnet) | 1.60% |
| 10 | N20 (Whetstone) | -0.70% |
New Southgate (N11) leads five-year growth at 18.60%, followed by Golders Green (NW11) at 14.70% and Edgware (HA8) at 14.30%. Cockfosters (EN4) shows 9.00% growth, while Finchley (N3) achieved 7.00%. Lower growth areas include North Finchley (N12) at 2.90%, Mill Hill (NW7) at 2.80%, and Hendon (NW4) at 2.20%. High Barnet (EN5) recorded modest growth of 1.60%, while Whetstone (N20) experienced a slight decline of -0.70%. For more insight into identifying areas with strong appreciation potential, see our guide on capital growth signs.
These figures should be viewed with some caution as they represent average prices across all property types and include both properties 'for sale' and 'sold prices'.
Average Monthly Property Sales in Barnet
Updated September 2025
The data represents the average number of residential property sales per month across Barnet's postcode districts.
| Rank | Area | Average Monthly Sales |
|---|---|---|
| 1 | EN5 (High Barnet) | 33 |
| 2 | HA8 (Edgware) | 27 |
| 3 | N11 (New Southgate) | 22 |
| 4 | EN4 (Cockfosters) | 19 |
| 5 | NW4 (Hendon) | 19 |
| 6 | N12 (North Finchley) | 18 |
| 7 | NW7 (Mill Hill) | 15 |
| 8 | N20 (Whetstone) | 14 |
| 9 | N3 (Finchley) | 13 |
| 10 | NW11 (Golders Green) | 12 |
High Barnet (EN5) leads transaction activity with 33 sales monthly, followed by Edgware (HA8) at 27 sales. New Southgate (N11) maintains 22 monthly sales despite being one of the borough's most affordable areas. Mid-tier activity areas include Cockfosters (EN4) and Hendon (NW4) with 19 sales each, and North Finchley (N12) at 18 sales. Premium postcodes show lower volumes, with Golders Green (NW11) at 12 monthly sales and Finchley (N3) at 13 sales.
Remember: This includes all property prices and property types. Although generally higher transaction volumes indicate greater property market liquidity.
Planning Applications in Barnet
Updated September 2025
The data represents the average number of planning applications submitted per month in each postcode district, along with the percentage of applications that receive approval.
| Rank | Area | Monthly Applications | Success Rate |
|---|---|---|---|
| 1 | NW11 (Golders Green) | 75 | 88% |
| 2 | HA8 (Edgware) | 69 | 78% |
| 3 | EN5 (High Barnet) | 59 | 81% |
| 4 | NW4 (Hendon) | 47 | 79% |
| 5 | EN4 (Cockfosters) | 45 | 80% |
| 6 | NW7 (Mill Hill) | 44 | 77% |
| 7 | N20 (Whetstone) | 41 | 84% |
| 8 | N3 (Finchley Central) | 36 | 82% |
| 9 | N12 (North Finchley) | 34 | 76% |
| 10 | N11 (New Southgate) | 31 | 83% |
Golders Green (NW11) leads planning activity with 75 applications monthly and the highest success rate at 88%, indicating both strong development interest and planning-friendly conditions. Edgware (HA8) follows with 69 applications at 78% approval, while High Barnet (EN5) records 59 applications with 81% success. Mid-tier areas like Hendon (NW4) with 47 applications and Cockfosters (EN4) with 45 applications both achieve approximately 80% approval rates. Areas with fewer applications include New Southgate (N11) at 31 and North Finchley (N12) at 34, though both maintain strong success rates of 83% and 76% respectively.
For property investors and developers, higher application volumes combined with strong success rates indicate active development areas with planning-friendly environments. Success rates between 76-88% across all Barnet postcodes suggest relatively consistent planning policy application borough-wide.
Property Data Sources
Our location guide relies on diverse, authoritative datasets including:
- HM Land Registry UK House Price Index
- Ministry of Housing, Communities and Local Government
- Government Planning and Housing Data
- Propertydata.co.uk
We update our property data quarterly to ensure accuracy. Last update: September 2025. All data is presented as provided by our sources without adjustments or amendments.
Barnet Rental Market Analysis
For first-time buyers buying their first rental property and thinking how much they can charge for rent across the London borough of Barnet, the rental data below gives you an indication on the rental yields London landlords can aim to achieve for traditional assured shorthold tenants.
Note: Barnet's relatively high property prices and moderate rental yields (2.8%-4.7%) mean investors should carefully evaluate whether returns align with their portfolio strategy, particularly when compared to higher-yielding areas outside London such as Manchester or Birmingham. For those growing a residential property portfolio, focusing on areas with stronger cash flow may accelerate portfolio expansion.
Rental Prices in Barnet (£)
Updated September 2025
The data represents the average weekly and monthly rent for long-let AST properties in Barnet.
| Rank | Area | Average Weekly Rent | Average Monthly Rent |
|---|---|---|---|
| 1 | EN4 (Cockfosters) | £747 | £3,237 |
| 2 | NW11 (Golders Green) | £578 | £2,503 |
| 3 | NW7 (Mill Hill) | £542 | £2,349 |
| 4 | N3 (Finchley) | £510 | £2,211 |
| 5 | NW4 (Hendon) | £503 | £2,179 |
| 6 | EN5 (High Barnet) | £491 | £2,127 |
| 7 | N12 (North Finchley) | £474 | £2,052 |
| 8 | N20 (Whetstone) | £471 | £2,042 |
| 9 | HA8 (Edgware) | £453 | £1,961 |
| 10 | N11 (New Southgate) | £427 | £1,849 |
Cockfosters (EN4) achieves Barnet's highest rents at £747 weekly (£3,237 monthly), significantly above Golders Green (NW11) at £578 weekly. Mill Hill (NW7), Finchley (N3), and Hendon (NW4) command weekly rents between £503-£542. New Southgate (N11) offers the most affordable rents at £427 weekly (£1,849 monthly), which combined with its lower property prices delivers the borough's third-highest rental yield at 4.4%.
These figures represent average rents across all property types, from studio apartments to larger houses. Actual achievable rents vary significantly based on property size, condition, and specific location within each postcode.
Gross Rental Yields in Barnet (%)
Updated September 2025
The data represents the average gross rental yields across different postcode districts in Barnet, calculated using a snapshot of current properties for sale and properties for rent. These figures are based on asking prices and asking rents.
| Rank | Area | Gross Rental Yield |
|---|---|---|
| 1 | EN4 (Cockfosters) | 4.7% |
| 2 | N12 (North Finchley) | 4.5% |
| 3 | N11 (New Southgate) | 4.4% |
| 4 | HA8 (Edgware) | 4.3% |
| 5 | NW4 (Hendon) | 4.0% |
| 6 | EN5 (High Barnet) | 3.9% |
| 7 | NW7 (Mill Hill) | 3.9% |
| 8 | N3 (Finchley) | 3.7% |
| 9 | NW11 (Golders Green) | 2.9% |
| 10 | N20 (Whetstone) | 2.8% |
Cockfosters (EN4) delivers Barnet's highest rental yield at 4.7% with average property prices of £829,039 and monthly rents of £3,237. North Finchley (N12) follows at 4.5% with more accessible entry prices of £547,223, while New Southgate (N11) offers 4.4% yields at the borough's lowest price point of £500,151.
Edgware (HA8), Hendon (NW4), High Barnet (EN5), and Mill Hill (NW7) deliver yields between 3.9% and 4.3%. Finchley (N3) sits at 3.7% with average prices of £711,667. Premium postcodes Golders Green (NW11) and Whetstone (N20) show lower yields of 2.9% and 2.8% due to property values exceeding £880,000, though these areas typically deliver stronger capital growth.
These figures represent gross rental yields calculated from average asking rents and asking prices. Net yields will be lower after accounting for mortgage costs, maintenance, void periods, letting agent fees, insurance, and property management expenses. Landlords can use our rental investment calculator to factor in these costs.
Access our selection of exclusive, high-yielding, residential investment property deals and a personal consultant to guide you through your options.
Is Barnet Rent High?
Yes, Barnet's rental prices represent a substantial financial burden for local residents, consuming a significant percentage of local incomes.
Average rent in Barnet costs a staggering 66.97% to 117.22% as a percentage of earnings based on the ONS earnings data showing Barnet's mean annual income at £33,133 (£637 per week).
The pressure is most extreme in EN4 (Cockfosters) where local rents reach £747 per week. Based on local average mean earnings, tenants would need to pay 117.22% of their income just to cover rental housing costs - an impossible situation that highlights the severe affordability crisis.
Even in Barnet's most accessible areas, the financial burden remains substantial. New Southgate (N11) represents the borough's most affordable option at 66.97% of income, yet still requires residents to commit more than two-thirds of their earnings solely to rent.
Here's what residents face across Barnet for rental costs as a percentage of income:
- EN4 (Cockfosters) - 117.22% of local income (£747 per week)
- NW11 (Golders Green) - 90.67% of local income (£578 per week)
- NW7 (Mill Hill) - 85.08% of local income (£542 per week)
- N3 (Finchley) - 80.09% of local income (£510 per week)
- NW4 (Hendon) - 78.91% of local income (£503 per week)
- EN5 (High Barnet) - 77.04% of local income (£491 per week)
- N12 (North Finchley) - 74.31% of local income (£474 per week)
- N20 (Whetstone) - 73.97% of local income (£471 per week)
- HA8 (Edgware) - 71.03% of local income (£453 per week)
- N11 (New Southgate) - 66.97% of local income (£427 per week)
The rental-to-income ratio in Barnet highlights the significant "affordability gap" that exists across London boroughs, where rental costs have risen faster than wages for a consistent number of years. With residents requiring between 66.97-117.22% of gross mean income for rent (before tax, utilities, and other living expenses), the rental market presents significant challenges for tenants.
Buy-to-Let Considerations
Are Barnet House Prices High?
Yes, Barnet is one of the more expensive London boroughs. The Barnet housing market has some very high property prices, especially when compared with national averages.
Barnet's average property price of £586,594 sits 118.04% above the UK average of £269,079, making affordability a challenge for new property buyers looking to get on the housing ladder.
In context to London averages however, some postcodes could still be seen as 'affordable', even though as a ratio compared to earnings, prices look significant.
Demonstrating its position as a premium outer London borough, Barnet has a house price premium of 4.50% compared to the London average of £561,309.
The average asking prices for properties in Barnet currently on the market vary considerably across postcodes, from the most expensive Barnet postcode of NW11 (Golders Green) at £1,049,492 and N20 (Whetstone) at £882,830 to the lowest prices seen in N11 (New Southgate) at £500,151 and N12 (North Finchley) at £547,223.
Interestingly, median annual earnings in Barnet is low, and comes in at £29,418 (7.71% lower than the UK average of £31,875).
This puts significant pressure on affordability, with residents earning anywhere near the local 'average' income struggling to afford the high property prices.
Mean earnings in Barnet are £33,133, which is substantially below the UK mean of £39,030 and significantly below the London mean of £90,578.
Salary to House Price Ratios
Based on Barnet's mean earnings of £33,133:
- Golders Green (NW11) - £1,049,492 asking price = 31.67 times annual salary
- Whetstone (N20) - £882,830 asking price = 26.64 times annual salary
- Cockfosters (EN4) - £829,039 asking price = 25.03 times annual salary
- Finchley (N3) - £711,667 asking price = 21.48 times annual salary
- Mill Hill (NW7) - £717,790 asking price = 21.67 times annual salary
- Hendon (NW4) - £646,318 asking price = 19.51 times annual salary
- High Barnet (EN5) - £660,352 asking price = 19.93 times annual salary
- Edgware (HA8) - £549,234 asking price = 16.57 times annual salary
- North Finchley (N12) - £547,223 asking price = 16.52 times annual salary
- New Southgate (N11) - £500,151 asking price = 15.10 times annual salary
Meaning that for a local property buyer on 'average mean full time earnings', to buy a property across Barnet would require between 15.10 and 31.67 times annual salary.
Source: ONS Earnings and Hours Worked dataset
For buy-to-let investors, these high price-to-income ratios typically translate to significantly lower rental yields compared to other parts of the UK, such as the average rents in Manchester or areas with the highest rents in Birmingham. This is creating a compounding effect of low supply of new rental properties, putting more pressure on local rents and affordability.
How Much Deposit to Buy a House in Barnet?
Assuming a 30% deposit for the average buy-to-let investor, here's an overview of deposit requirements across different Barnet regions:
Central Barnet
- N3 (Finchley): A buy-to-let investor looking at an average property would need to put down a 30% deposit of £213,500.
- N12 (North Finchley): In this area, an investor would need a 30% deposit of £164,167 for an average property.
- N20 (Whetstone): In this area, an investor would need a 30% deposit of £264,849 for an average property.
North Barnet
- EN4 (Cockfosters): A buy-to-let investor would need a 30% deposit of £248,712 for an average property.
- EN5 (High Barnet): In High Barnet, an investor would need a 30% deposit of £198,106 for an average property.
South Barnet
- NW11 (Golders Green): An investor would require a 30% deposit of £314,848 for an average property.
East Barnet
- N11 (New Southgate): In New Southgate, an investor would need a 30% deposit of £150,045 for an average property.
West Barnet
- HA8 (Edgware): A buy-to-let investor would need a 30% deposit of £164,770 for an average property.
- NW4 (Hendon): A buy-to-let investor would need a 30% deposit of £193,895 for an average property.
- NW7 (Mill Hill): In Mill Hill, a property investor would need a 30% deposit of £215,337 for an average property.
If you're new to property, or just starting out through a property training course, areas like New Southgate (N11) in East Barnet, North Finchley (N12) in Central Barnet and Edgware (HA8) in West Barnet offer the most affordable deposit requirements in Barnet, all under £165,000.
How to Invest in Buy-to-Let in Barnet
Property Investments UK and our partners have ready to go buy-to-let properties to purchase across Barnet, Greater London and the rest of the UK. With new properties coming available weekly, whether you're targeting high-yield areas like Cockfosters (EN4) at 4.7%, the mid-range options in Edgware (HA8), or the more affordable entry points in New Southgate (N11), we can source suitable investment properties across the country to match your criteria.
We have partnered with the best property investment agents we can find for 8+ years and below you can find links to help you buy properties in Barnet and across the region including:
- Buy-to-let investment properties
- PBSA and student lets
- BMV properties for sale
- Airbnbs for sale
- and other high yielding opportunities
and articles helping you with:
- Finding off-market properties
- Why you should consider a Holiday home investment or a serviced accommodation asset
- Are HMO properties a good investment
For more information about specific areas to consider:
If you're interested in the highest rental returns in Barnet, consider EN4 (Cockfosters) with yields of 4.7%, followed by N12 (North Finchley) at 4.5% and N11 (New Southgate) at 4.4%. These areas benefit from excellent Northern line connections, with EN4 served by Cockfosters station (the terminus of the Piccadilly line), while N11 and N12 are served by Arnos Grove, Bounds Green, and multiple stations on the High Barnet branch of the Northern line including Woodside Park, West Finchley, and Finchley Central, providing direct access to the City via Bank and the West End via Charing Cross.
For mid level entry house prices with mid level London rental yields, HA8 (Edgware) presents a middle-ground option at £549,234 average price with a 4.3% yield, served by Edgware station at the northern terminus of the Northern line's Edgware branch, providing excellent connectivity to central London.
For an alternative look at the local London housing market, with affordable entry prices, check out our guide to the cheapest areas to live in London.
For similar suburban investment opportunities in neighbouring London boroughs, explore buy-to-let in Enfield (directly adjacent to Barnet with similar property values at £480k average and comparable transport links via the Piccadilly line), buy-to-let in Harrow (bordering Barnet to the west with £550k average prices and excellent Metropolitan line connections), or buy-to-let in Haringey (neighbouring borough to the east with £627k average and shared Northern line access through Highgate and Archway). For opportunities outside London with comparable characteristics, consider buy-to-let in St Albans (15 miles north with similar property values at £622k average, excellent schools, and 20-minute trains to London St Pancras) or buy-to-let in Watford (just 12 miles northwest with more affordable entry at around £400k average and fast Metropolitan line connections to central London).
