Camden Property Investment: Best Buy-to-Let Areas
Where quiet Victorian streets meet modern London energy, Camden presents one of the capital's most intriguing property markets. This North London borough spans everything from Camden Market's bustling energy to Hampstead Heath's oasis of calm.
Creating a property market where a £650,000 flat in Kentish Town sits just miles from a £3 million+ house in Hampstead. Two very different opportunities for resident home buyers, international investors and buy-to-let landlords.
Recent price drops of -3.8% to -7.7% across some Camden postcodes suggest something significant is shifting. After years of prices climbing beyond what even high earners could justify, the market is finding a balance. For investors with serious capital, this correction potentially creates opportunities that haven't existed since the early 2010s.
What makes Camden compelling isn't just the Northern Line convenience or cultural attractions. It's how these neighbourhoods maintain their character, provide unique housing styles with premium addresses, and attract every type of resident, young to old and those starting their professional career to winding down for retirement.
This in-depth analysis examines the Camden housing market in detail, to see which postcodes offer the best balance of opportunity, rental stability, and potential long-term value.
Article updated: October 2025
Camden Buy-to-Let Market Overview 2025
Camden's property market represents one of London's most premium boroughs with sold house prices averaging 56.1% above London's overall average.
- Asking price range: £636,565 (NW5) to £1,231,111 (NW3) across Camden postcodes
- Rental yields: 3.5% (NW3) to 5.4% (NW5) across different postcodes
- Rental income: Weekly rents from £664 to £826 (monthly: £2,878 to £3,578)
- Price per sq ft: Market positioning from £888/sq ft to £1,186/sq ft
- Market activity: Sales ranging from 11 per month (WC1) to 32 per month (NW3)
- Deposit requirements: 30% deposits range from £190,970 (NW5) to £369,333 (NW3)
- Affordability ratios: Property prices from 12.29 to 23.77 times Camden's mean annual salary of £51,782
Contents

-
by Robert Jones, Founder of Property Investments UK
With two decades in UK property, Rob has been investing in buy-to-let since 2005, and uses property data to develop tools for property market analysis.
Property Data Sources
Our location guide relies on diverse, authoritative datasets including:
- HM Land Registry UK House Price Index
- Ministry of Housing, Communities and Local Government
- Government Planning and Housing Data
- Propertydata.co.uk
We update our property data quarterly to ensure accuracy. Last update: October 2025. All data is presented as provided by our sources without adjustments or amendments.
Why Invest in Camden?
Camden is one of London's most premium boroughs with sold house prices 56.1% higher than the London average.
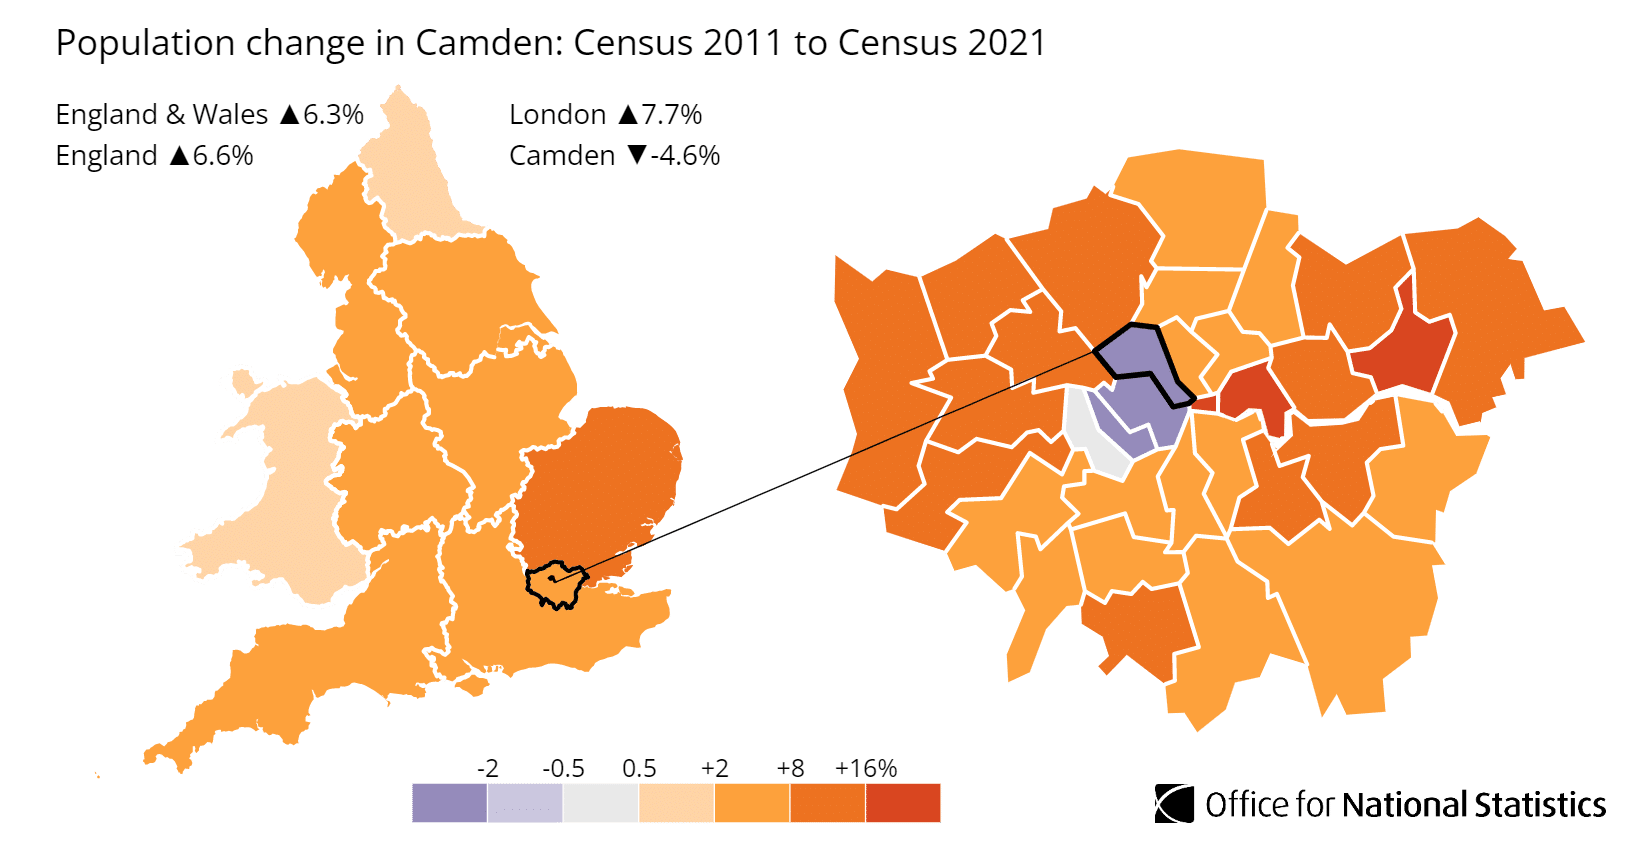
Often in property, house price growth is closely connected with population growth. However, Camden presents an unusual pattern where population has declined by 4.1% whilst maintaining premium pricing, suggesting factors beyond simple population dynamics influence this central London market.
The total population of Camden was 210,968 (as of the last UK government census in 2021) and Camden's population has decreased by 4.1%, declining from 220,087 in 2011. This population decline contrasts sharply with broader London population growth, likely reflecting Camden's transformation from residential to mixed-use development, increased commercial and institutional space, and the conversion of some residential properties to short-term lets or commercial use.
Camden borough includes the notable London neighbourhoods of Camden Town, Hampstead, Kentish Town, Bloomsbury, Fitzrovia, King's Cross, Swiss Cottage and Gospel Oak.
Camden is covered by the main postcodes: NW1, NW3, NW5, WC1
With additional postcodes that cross Camden and other local London Boroughs including:
- N6 crosses Camden, Haringey and Islington
- N19 crosses Camden and Islington
- NW2 crosses Camden and Brent
- NW6 crosses Camden, Brent and City of Westminster
- NW8 crosses Camden and City of Westminster
For investors considering other nearby areas, you can also explore buy-to-let opportunities across North London, including neighbouring boroughs like Hackney, Barnet, Enfield and Tottenham, each offering distinct investment characteristics and price points.
Camden Property Market Analysis
When Was the Last House Price Crash in Camden?
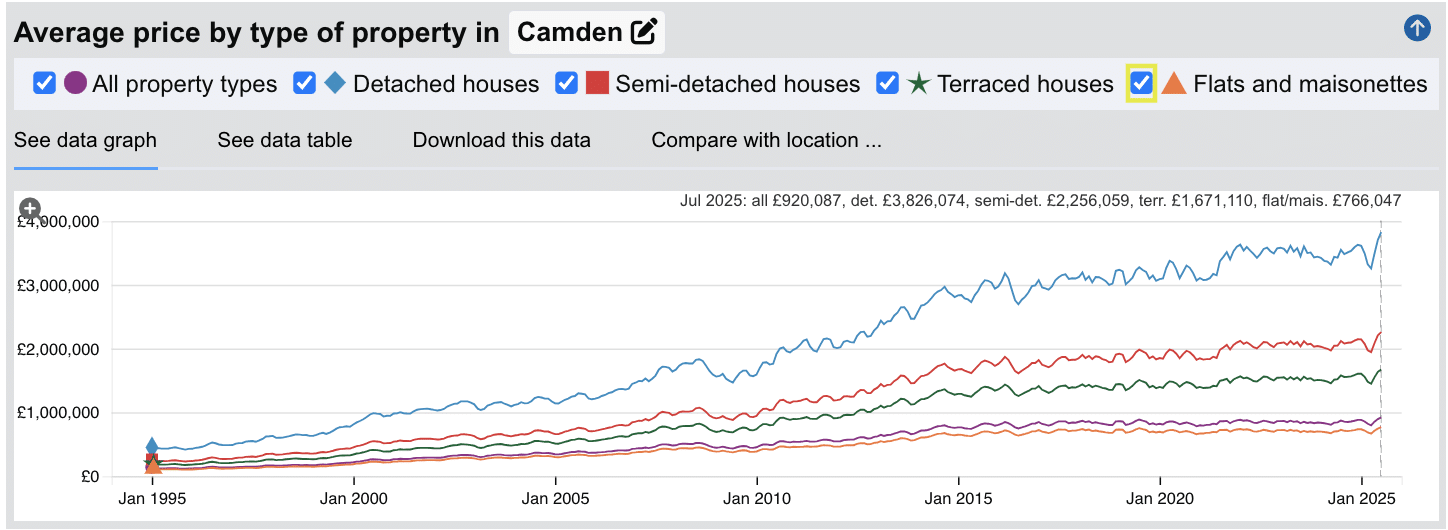
The last significant property price crash in Camden occurred during the global financial crisis of 2008-2010, with smaller corrections in late 2019, 2022-2024, and ongoing softness in 2025.
Source: HM Land Registry House Price Index for Camden
Looking at Camden's historical property prices:
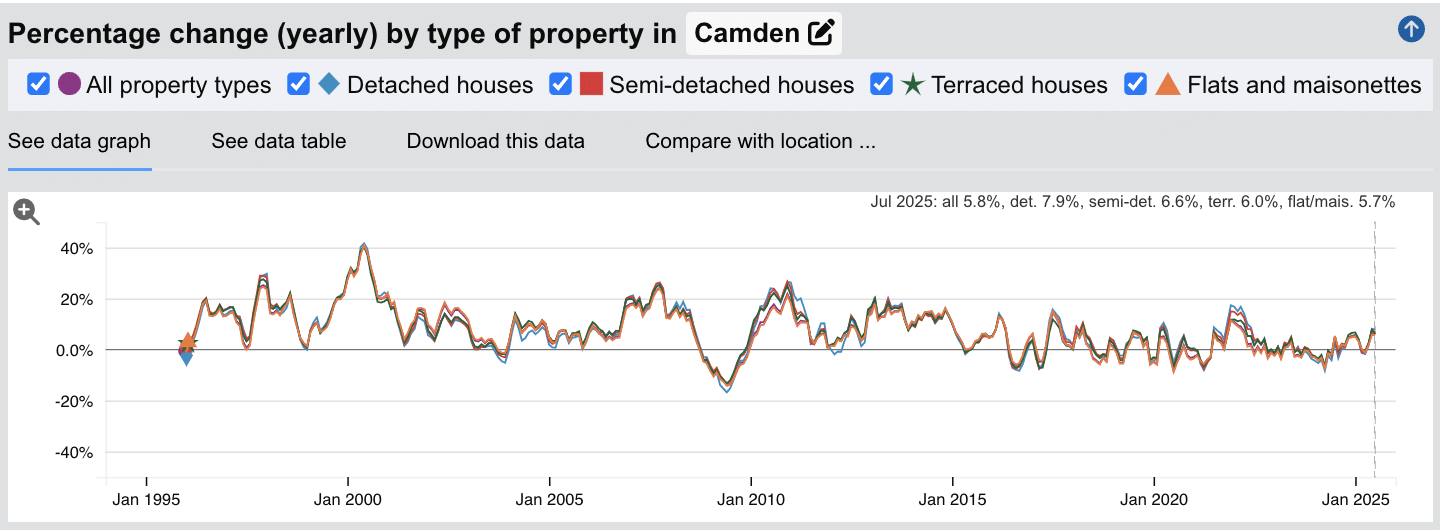
- 1995-2000: Steady appreciation with annual increases reaching up to 24%
- 2000-2004: Explosive growth with peaks reaching 40% annual increases during the early 2000s boom
- 2004-2007: Sustained premium expansion as Camden established itself as one of London's most desirable boroughs
- 2008-2010: Sharp correction during the financial crisis, with values dropping approximately 15-20%
- 2010-2014: Gradual recovery supported by transport improvements including King's Cross regeneration and cultural development
- 2014-2018: Strong growth period reaching 15-20% annual increases as prime central London peaked
- 2018-2019: Market softening began with Brexit uncertainty affecting prime London
- 2020-2021: Brief pandemic-driven uncertainty followed by temporary recovery
- 2022-2024: Correction across most property types as affordability constraints intensified
- 2025: Recent data (July 2025) shows modest growth resuming with annual increases across property types: all properties (+5.8%), detached (+7.9%), semi-detached (+6.6%), terraced (+6.0%), and flats (+5.7%)
Camden has demonstrated long-term resilience with detached properties increasing from approximately £444,944 in January 1995 to £3,826,074 by July 2025 - an eight-fold increase that significantly outperforms inflation. Unlike the crisis-driven 2008 crash, the 2022-2024 correction reflected affordability constraints where even high-earning households found Camden prices challenging. The recent return to positive growth in 2025 suggests the market may be stabilising after several years of price adjustments.
This pattern reflects Camden's enduring appeal as a central London borough offering Zone 1-2 positioning, exceptional transport connectivity through six Underground lines at King's Cross, cultural institutions, and established residential desirability. The substantial premiums commanded by all property types compared to London averages demonstrate Camden's continued strength as a premium residential location.
Sold House Prices in Camden
The latest sold house price index by the Land Registry, shows the following average 'sold' house prices across the London Borough of Camden.
While detached houses in Camden command extraordinary premiums at 179.6% above the London average, semi-detached houses similarly reflect the borough's premium positioning at 169.7% above typical London prices.
Even terraced houses in Camden represent substantial premiums at 124.0% above London averages, while flats and maisonettes offer the most accessible entry point, though still 47.6% above typical London prices.
For investors considering Camden, the borough represents one of London's most premium residential locations with established cultural appeal and Zone 1-2 positioning. Unlike more affordable outer London boroughs like Barnet and Brent, Camden's price points prioritise capital preservation over immediate rental yields. Those ticking off requirements in their investment property checklists may need to sacrifice yield expectations in return for a property address in a highly sought-after postcode.
With average detached houses selling at £3,252,919, these properties clearly serve established wealth rather than conventional property ladders. The apartment market at £654,719 offers the most accessible entry point, though this still represents significant financial commitment compared to outer London alternatives.
Investors looking to build portfolios focused on stronger yields may find neighbouring boroughs more suitable, whilst those landlords looking at how to sell a buy-to-let property in Camden will need to find wealthy buyers willing to take a short term yield hit for a long term potential of capital growth, betting on premium addresses.
Updated October 2025
| Property Type | Camden Average Price | London Average | Difference |
|---|---|---|---|
| Detached houses | £3,252,919 | £1,163,469 | +179.6% |
| Semi-detached houses | £1,938,017 | £718,637 | +169.7% |
| Terraced houses | £1,429,576 | £638,278 | +124.0% |
| Flats and maisonettes | £654,719 | £443,692 | +47.6% |
| All property types | £876,065 | £561,309 | +56.1% |
Property Data Sources
Our location guide relies on diverse, authoritative datasets including:
- HM Land Registry UK House Price Index
- Ministry of Housing, Communities and Local Government
- Government Planning and Housing Data
- Propertydata.co.uk
We update our property data quarterly to ensure accuracy. Last update: October 2025. All data is presented as provided by our sources without adjustments or amendments.
For Sale Asking House Prices in Camden
Updated October 2025
The data represents the average asking prices of properties currently listed for sale in Camden.
| Rank | Area | Average House Price |
|---|---|---|
| 1 | NW3 (Hampstead) | £1,231,111 |
| 2 | NW1 (Camden Town) | £857,123 |
| 3 | WC1 (Bloomsbury) | £838,908 |
| 4 | NW5 (Kentish Town) | £636,565 |
Hampstead (NW3) commands asking prices of £1,231,111, putting homeownership beyond most London households even with above-average earnings. Camden Town (NW1) follows at £857,123, a substantial amount though £373,988 less than Hampstead for those wanting Camden Market access and Northern Line convenience. Bloomsbury (WC1) sits at £838,908, reflecting its Zone 1 location and proximity to major institutions. Kentish Town (NW5) provides the most accessible entry point at £636,565, yet this remains expensive by any UK standard. The £594,546 gap between highest and lowest shows how Camden maintains premium pricing across all neighbourhoods. When considering the closer price per square foot figures, this price difference also indicates NW5 has more entry-level properties like one-bedroom apartments available, compared to the larger family homes dominating NW3. Even Kentish Town requires roughly £191,000 deposits under typical 30% lending criteria, meaning Camden attracts investors, homebuyers on significant dual incomes and those with family financial support rather than standard first-time buyers.
These figures represent average asking prices across all property types, and actual achievable prices may vary depending on property size, condition, and specific location within each postcode.
Sold Price Per Square Foot in Camden (£)
Updated October 2025
The data represents the average sold price per square foot of properties in Camden.
| Rank | Area | Price Per Square Foot |
|---|---|---|
| 1 | WC1 (Bloomsbury) | £1,186 |
| 2 | NW3 (Hampstead) | £1,106 |
| 3 | NW1 (Camden Town) | £1,028 |
| 4 | NW5 (Kentish Town) | £888 |
Bloomsbury (WC1) commands £1,186 per square foot, reflecting its Zone 1 location and proximity to major institutions including UCL and the British Museum. Hampstead (NW3) follows at £1,106 per square foot - a figure that puts it among London's most expensive areas, justified by Hampstead Heath access and the village's established reputation. Camden Town (NW1) sits at £1,028 per square foot, where proximity to Camden Market and the Northern Line commands a premium. Kentish Town (NW5) offers the most accessible entry at £888 per square foot, representing a £298 discount compared to Bloomsbury whilst maintaining strong transport links. The tight £298 spread between highest and lowest shows Camden operates as a consistently premium market across all four postcodes. For investors, these figures highlight the importance of maximising rental income from every square foot - though this creates pressure on affordability in an already expensive borough.
These figures reflect the average across all property types and should be considered alongside factors such as building age, condition, and specific location within each postcode. Period conversions and heritage properties typically command premiums over standard housing stock.
House Price Growth in Camden (%)
Updated October 2025
The data represents the average house price growth over the past five years, calculated using a blended rolling annual comparison of both sold prices and asking prices.
| Rank | Area | 5 Year Growth |
|---|---|---|
| 1 | NW5 (Kentish Town) | 5.50% |
| 2 | NW1 (Camden Town) | -3.80% |
| 3 | NW3 (Hampstead) | -5.90% |
| 4 | WC1 (Bloomsbury) | -7.70% |
Kentish Town (NW5) is the only Camden postcode showing positive five-year growth at 5.50%, demonstrating resilience in a challenging market period for prime central London. Camden Town (NW1) recorded a decline of -3.80%, while Hampstead (NW3) saw -5.90% and Bloomsbury (WC1) experienced -7.70%. The negative growth across most of Camden reflects the broader correction in prime central London property prices following the post-2016 market adjustment, with Kentish Town's outperformance likely due to its more accessible price point attracting steady buyer demand. For more insight into identifying areas with strong appreciation potential, see our guide on potential signs of capital growth.
These figures should be viewed with some caution as they represent average prices across all property types and include both properties 'for sale' and 'sold prices'.
Average Monthly Property Sales in Camden
Updated October 2025
The data represents the average number of residential property sales per month across Camden's postcode districts.
| Rank | Area | Average Monthly Sales |
|---|---|---|
| 1 | NW3 (Hampstead) | 32 |
| 2 | NW1 (Camden Town) | 24 |
| 3 | NW5 (Kentish Town) | 19 |
| 4 | WC1 (Bloomsbury) | 11 |
Hampstead (NW3) leads transaction activity with 32 sales monthly, reflecting its established residential market and family housing stock. Camden Town (NW1) follows at 24 monthly sales, benefiting from strong buyer interest in the area's mix of period conversions and canal-side developments. Kentish Town (NW5) maintains 19 monthly sales with its appeal to first-time buyers and investors seeking higher yields. Bloomsbury (WC1) shows lower volumes at 11 sales, likely due to the concentration of institutional ownership around the university quarter and limited residential stock available for sale.
Remember: This includes all property prices and property types. Although generally higher transaction volumes indicate greater property market liquidity.
Planning Applications in Camden
Updated October 2025
The data represents the average number of planning applications submitted per month in each postcode district, along with the percentage of applications that receive approval.
| Rank | Area | Monthly Applications | Success Rate |
|---|---|---|---|
| 1 | NW1 (Camden Town) | 96 | 93% |
| 2 | NW3 (Hampstead) | 36 | 90% |
| 3 | NW5 (Kentish Town) | 33 | 95% |
| 4 | WC1 (Bloomsbury) | 11 | 86% |
Camden Town (NW1) dominates planning activity with 96 applications monthly and a 93% success rate, reflecting the area's ongoing regeneration around the canal and high street. Hampstead (NW3) records 36 applications with 90% approval despite its conservation area status, while Kentish Town (NW5) achieves the highest success rate at 95% from 33 applications. Bloomsbury (WC1) shows lower application volumes at 11 monthly, likely due to the lower number of residential properties and higher concentration of protected university buildings and conservation areas around the British Museum and Russell Square.
Remember that these figures represent averages across each postcode, and specific streets or property types may experience different levels of planning activity and success rates.
Property Data Sources
Our location guide relies on diverse, authoritative datasets including:
- HM Land Registry UK House Price Index
- Ministry of Housing, Communities and Local Government
- Government Planning and Housing Data
- Propertydata.co.uk
We update our property data quarterly to ensure accuracy. Last update: October 2025. All data is presented as provided by our sources without adjustments or amendments.
Camden Rental Market Analysis
For first-time buyers buying their first rental property and thinking how much they can charge for rent across the London borough of Camden, the rental data below gives you an indication on the rental yields London landlords can aim to achieve for traditional assured shorthold tenants.
Note: Camden's high property prices and moderate rental yields (3.5%-5.4%) mean investors should carefully evaluate whether returns align with their portfolio strategy, particularly when compared to higher-yielding areas outside London such as Manchester or Birmingham. For those considering how to grow a residential property portfolio with significant budgets, Camden offers a excellent capital growth potential in a premium London location.
Rental Prices in Camden (£)
Updated October 2025
The data represents the average weekly and monthly rent for long-let AST properties in Camden.
| Rank | Area | Average Weekly Rent | Average Monthly Rent |
|---|---|---|---|
| 1 | NW3 (Hampstead) | £826 | £3,578 |
| 2 | WC1 (Bloomsbury) | £698 | £3,026 |
| 3 | NW1 (Camden Town) | £697 | £3,021 |
| 4 | NW5 (Kentish Town) | £664 | £2,878 |
Hampstead and Swiss Cottage (NW3) achieves Camden's highest rents at £826 weekly (£3,578 monthly), reflecting its status as one of London's most prestigious residential areas. Bloomsbury and King's Cross (WC1) commands £698 weekly, closely followed by Camden Town and Regent's Park (NW1) at £697 weekly. Kentish Town (NW5) offers the most accessible rents at £664 weekly (£2,878 monthly), which combined with its lower property prices delivers the borough's highest rental yield at 5.4%.
These figures represent average rents across all property types, from studio apartments to larger houses. Actual achievable rents vary significantly based on property size, condition, and specific location within each postcode.
Gross Rental Yields in Camden (%)
Updated October 2025
The data represents the average gross rental yields across different postcode districts in Camden, calculated using a snapshot of current properties for sale and properties for rent. These figures are based on asking prices and asking rents.
| Rank | Area | Gross Rental Yield |
|---|---|---|
| 1 | NW5 (Kentish Town) | 5.4% |
| 2 | WC1 (Bloomsbury, King's Cross) | 4.3% |
| 3 | NW1 (Camden Town, Regent's Park) | 4.2% |
| 4 | NW3 (Hampstead, Swiss Cottage) | 3.5% |
Kentish Town (NW5) delivers Camden's highest rental yield at 5.4% with average property prices of £636,565 and monthly rents of £2,878, making it the borough's most attractive area for buy-to-let investors seeking strong returns. Bloomsbury and King's Cross (WC1) follows at 4.3% with excellent connectivity through six Underground lines, while Camden Town and Regent's Park (NW1) offers 4.2% yields at £857,123 average price.
Hampstead and Swiss Cottage (NW3) shows the lowest yield at 3.5% due to premium property values averaging £1,231,111, even though this prestigious postcode typically attracts high-quality tenants and delivers stronger long-term capital growth prospects alongside its premium rental income of £3,578 per month.
These figures represent gross rental yields calculated from average asking rents and asking prices. Net yields will be lower after accounting for mortgage costs, maintenance, void periods, letting agent fees, insurance, and property management expenses. Landlords can use our rental investment calculator to factor in these costs.
Access our selection of exclusive, high-yielding, residential investment property deals and a personal consultant to guide you through your options.
Is Camden Rent High?
Yes, Camden's rental prices represent a substantial financial burden for local residents, consuming a significant percentage of local incomes.
Average rent in Camden costs between 66.70% to 82.93% as a percentage of earnings based on the ONS earnings data showing Camden's mean annual income at £51,782 (£996 per week).
The pressure is most extreme in NW3 (Hampstead, Swiss Cottage) where local rents reach £826 per week. Based on local average mean earnings, tenants would need to pay 82.93% of their income just to cover rental housing costs - a significant burden that highlights the ongoing affordability challenges in this premium area.
Camden's most accessible rental market is found in NW5 (Kentish Town), where rents represent 66.70% of income at £664 per week, yet still requires residents to commit more than two-thirds of their earnings solely to rent.
Here's what residents face across Camden for rental costs as a percentage of income:
- NW3 (Hampstead, Swiss Cottage) - 82.93% of local income (£826 per week)
- WC1 (Bloomsbury, King's Cross) - 70.11% of local income (£698 per week)
- NW1 (Camden Town, Regent's Park) - 70.01% of local income (£697 per week)
- NW5 (Kentish Town) - 66.70% of local income (£664 per week)
Most Camden residents and tenants require multiple incomes, family support, or earnings significantly above local averages. This creates a rental market primarily serving established professionals, creative industry workers with supplementary income or wealth, or residents with external financial resources.
For property investors, this might have an appeal as it attracts a wealthy tenant base, however it does require a significant investment to buy in Camden even if you start at the one bedroom apartment rung of the property ladder.
Buy-to-Let Considerations
Are Camden House Prices High?
Yes, Camden is one of London's most expensive boroughs. The Camden housing market has very high property prices especially when compared with national averages for property buyers.
Camden's average property price of £876,065 sits 225.58% above the UK average of £269,079, making affordability a significant challenge for new property buyers looking to get on the housing ladder.
Even in the context of London averages, Camden represents a premium location with substantial price premiums across most postcodes.
Demonstrating its position as a premium inner London borough, Camden has a house price premium of 56.08% compared to the London average of £561,309.
The average asking prices for properties in Camden currently on the market vary considerably across postcodes, from the most expensive Camden postcode of NW3 (Hampstead, Swiss Cottage) at £1,231,111 and NW1 (Camden Town, Regent's Park) at £857,123 to the relatively more affordable NW5 (Kentish Town) at £636,565 and WC1 (Bloomsbury, King's Cross) at £838,908.
Median annual earnings in Camden are higher than the UK average, coming in at £44,193 (38.64% above the UK average of £31,875).
Despite these higher earnings, the exceptionally high property prices still put significant pressure on affordability, with residents earning even above the local average income finding it challenging to afford Camden's premium property market.
Mean earnings in Camden are £51,782, which is 32.67% above the UK mean of £39,030, yet still insufficient to easily afford the borough's high property prices.
Salary to House Price Ratios
Based on Camden's mean earnings of £51,782:
- Hampstead, Swiss Cottage (NW3) - £1,231,111 asking price = 23.77 times annual salary
- Camden Town, Regent's Park (NW1) - £857,123 asking price = 16.55 times annual salary
- Bloomsbury, King's Cross (WC1) - £838,908 asking price = 16.20 times annual salary
- Kentish Town (NW5) - £636,565 asking price = 12.29 times annual salary
Meaning that for a local property buyer on 'average mean full time earnings', to buy a property across Camden would require between 12.29 and 23.77 times annual salary.
Camden you can see therefore isn't your first choice for value or affordability.
How Much Deposit to Buy a House in Camden?
Assuming a 30% deposit for the average buy-to-let investor, here's an overview of deposit requirements across different Camden regions:
North Camden
- NW5 (Kentish Town): A buy-to-let investor looking at an average property would need to put down a 30% deposit of £190,970.
- NW3 (Hampstead, Swiss Cottage): In this area, an investor would need a 30% deposit of £369,333 for an average property.
Central Camden
- NW1 (Camden Town, Regent's Park): A buy-to-let investor would need a 30% deposit of £257,137 for an average property.
South Camden
- WC1 (Bloomsbury, King's Cross): An investor would require a 30% deposit of £251,672 for an average property.
If you're new to property, or just starting out through a property investment course, Kentish Town (NW5) in North Camden offers the most affordable deposit requirement in Camden at £190,970, whilst also delivering the borough's highest rental yield at 5.4%.
How to Invest in Buy-to-Let in Camden
Property Investments UK and our partners have ready to go buy-to-let properties to purchase across Camden, Greater London and the rest of the UK. With new properties coming available weekly, whether you're targeting high-yield areas like Kentish Town (NW5) at 5.4%, the central locations in Camden Town (NW1) and Bloomsbury (WC1) both around 4.2-4.3%, or the premium Hampstead market (NW3), we can source suitable investment properties across the city and country to match your criteria.
We have partnered with the best property investment agents we can find for 8+ years and below you can find links to help you buy properties in Camden and across the region including:
- Buy-to-let investment properties
- PBSA and student lets
- BMV properties for sale
- Airbnbs for sale
- and other high yielding opportunities
and articles helping you with:
- How to find off-market properties
- Why you should consider a Holiday home investment or a serviced accommodation asset
- Are HMO properties a good investment
For more information about specific areas to consider:
If you're interested in the highest rental returns in Camden, consider NW5 (Kentish Town) with yields of 5.4%, followed by WC1 (Bloomsbury, King's Cross) at 4.3% and NW1 (Camden Town, Regent's Park) at 4.2%. NW5 benefits from excellent Northern line connections. WC1 offers exceptional connectivity through King's Cross St Pancras, serving six Underground lines (Circle, Hammersmith & City, Metropolitan, Northern, Piccadilly and Victoria) plus national and international rail services, making it one of London's best-connected postcodes.
For mid level entry house prices with mid level London rental yields, WC1 (Bloomsbury, King's Cross) presents excellent value at £838,908 average price with a 4.3% yield and unparalleled transport connectivity, while NW1 (Camden Town, Regent's Park) offers similar yields at £857,123 average with strong tenant demand from professionals and students.
For an alternative look at the local London housing market, with affordable entry prices, check out our guide to the cheapest areas to live in London.
For similar investment opportunities in neighbouring London boroughs, explore buy-to-let in Haringey (directly adjacent to Camden to the north with £627k borough average and shared transport infrastructure through stations like Highgate and Archway on the Northern line), buy-to-let in Hackney (neighbouring borough to the east with £586k average, strong rental demand and excellent Overground and Central line connections), or buy-to-let in Brent (bordering Camden to the west with £541k borough average and fast access to central London via the Jubilee, Metropolitan and Bakerloo lines). For opportunities outside London with good transport links to the capital, consider buy-to-let in St Albans (just 20 miles north of Camden with 20-minute trains to London St Pancras and excellent schools although it comes at a price tag of £622k average property prices) or buy-to-let in Watford (15 miles northwest with Metropolitan line connections to central London and more affordable entry around £400k average).
