London Property Investment: Best Buy-to-Let Areas 2025
The average sold house price reached £561,309 in London recently, based on the latest HM Land Registry sold house price data.
London, the bustling capital of the United Kingdom, stands as a beacon for property investors worldwide. Its unique blend of history, culture, and economic power makes it a prime destination for international investors from countries like Hong Kong and Singapore as well as local investors and buy-to-let landlords looking to expand their property portfolios.
In the UK property market, London holds a position of singular importance. Its property values often move independently of national trends, driven by its own economic dynamics and international appeal.
This guide will explore the intricacies of buy-to-let investment across the UK’s capital, offering insights into its various regions, market trends, rental yields, buyer demand and house price growth (or in some postcodes decline).
Article updated: September 2025.
London Buy-to-Let Market Overview 2025
London's property market presents exceptional diversity across its postcodes, from ultra-prime Central London to high-yield outer areas offering genuine value and growth potential. With HA9 (Wembley) showing the strongest five-year price growth at 39.2% while CR0 (Croydon) delivers the highest transaction volumes with 115 monthly sales, demonstrating the capital's dynamic investment landscape.
- Price range: £223,104 (RM19 Purfleet) to £2,147,346 (SW7 South Kensington)
- Rental yields: 2.5% to 7.6% across different postcodes
- Rental income: Weekly rents from £326 to £1,238 (monthly: £1,412 to £5,366)
- Price per sq ft: Premium space values from £978/sq ft to £1,777/sq ft in top locations
- Market activity: Transaction volumes from 7 to 115 monthly sales per postcode
- Affordability Property prices to buy range from 5.53 times to 34.74 times local annual salaries
Contents

-
by Robert Jones, Founder of Property Investments UK
With two decades in UK property, Rob has been investing in buy-to-let since 2005, and uses property data to develop tools for property market analysis.
Property Data Sources
Our location guide relies on diverse, authoritative datasets including:
- HM Land Registry UK House Price Index
- Ministry of Housing, Communities and Local Government
- Ordnance Survey Data Hub
- London Rental Map
- Propertydata.co.uk
We update our property data quarterly to ensure accuracy. Last update: September 2025. All data is presented as provided by our sources without adjustments or amendments.
Why Invest in Greater London?
London's appeal as a property investment destination stems from its position as a global financial hub and London's significant population growth. The city is home to the headquarters of numerous multinational corporations, banks, and financial institutions. This concentration of economic power ensures a constant influx of high-earning professionals seeking quality rental accommodation.
Beyond finance, London's strategic importance extends to government, business, and culture. As the seat of the UK government and a centre for international diplomacy, London attracts a diverse range of residents and visitors. Its world-renowned universities including UCL, Imperial College and LSE draw students from across the globe, while its cultural institutions - from museums to theatres - cement its status as a world city.
This multifaceted appeal translates into a robust and diverse rental market, offering investors a range of opportunities across different property types and locations.
London's vast expanse is typically divided into four main regions, each with its own character and investment potential:
- East London: Known for its rapid regeneration and growing tech scene, areas like Stratford and Canary Wharf offer modern developments and strong rental demand. For investors seeking established opportunities, Waltham Forest provides excellent value with areas like Walthamstow showing strong capital growth, while Havering offers some of East London's most affordable entry points with solid rental yields in areas like Romford.
- South London: Provides a mix of Victorian housing stock and new builds, popular with young professionals. Lambeth encompasses trendy areas offering strong rental demand from the professional market, while Bromley provides more family-oriented properties with larger homes, gardens and driveways and competitive yields in London's outer zones.
- West London: Home to affluent areas like Kensington and Chelsea, it commands some of the highest property prices with prestigious addresses. For more accessible opportunities, Ealing provides excellent transport links and family-friendly areas, while Brent offers more competitive property prices while maintaining West London connectivity and amenities.
- North London: Areas like Islington and Camden blend trendy urban living with excellent train links, attracting a mix of students and young families. Hackney offers a similar appeal with its creative districts and regeneration projects.
Despite this demand across the Capital, when you look at how many empty homes there are in the UK, the data reveals that London has approximately 36,878 vacant properties, that's 1 in every 96 homes, representing untapped housing stock worth an estimated £19.5 billion. So although supply is constrained with such a significantly growing population, there is still potential.
London Property Market Analysis
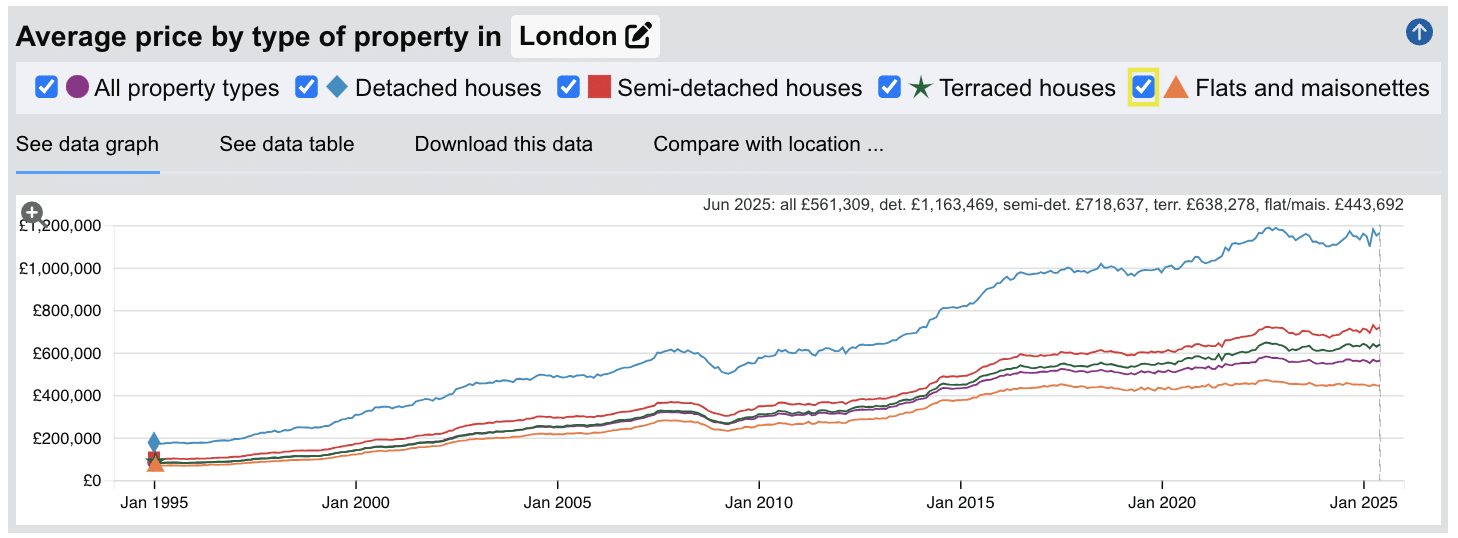
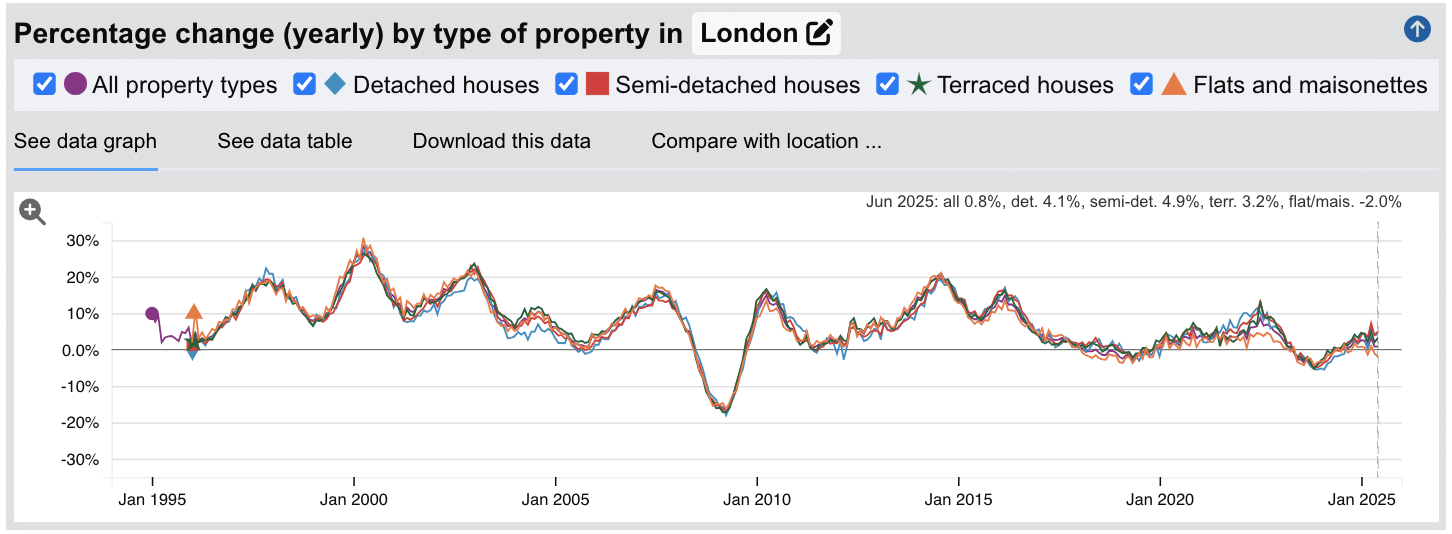
When was the last house price crash in London?
The last significant property price crash in London occurred during the global financial crisis of 2008-2009, with a smaller correction during the initial COVID-19 lockdown in early 2020.
Source: HM Land Registry House Price Index for London
Looking at the property data across all types:
- 1995-2000: Steady, sensible growth averaging 8-12% annually, building the foundation for London's property market expansion.
- 2000-2007: The golden era of London property, with accelerated growth and annual peaks reaching 25% in some years. Values doubled during this period, from £157,888 in 2000 to £319,019 by December 2007.
- 2008-2009: The financial crisis hit London hard, with values dropping 17% from peak to trough. Properties fell from £319,019 (Dec 2007) to a low of £264,709 (Mar 2009).
- 2010-2016: Patient recovery followed by renewed confidence. London regained its pre-crisis peak by 2011 and continued climbing to £505,701 by end of 2016.
- 2017-2019: More measured growth as Brexit uncertainty and stamp duty changes cooled the market, with annual growth moderating to single digits.
- 2020-2025: A brief COVID-19 dip of 1.3% in April 2020 quickly reversed as London's fundamentals remained strong. Recent data shows continued growth to £561,309 by June 2025.
The long-term picture tells a remarkable story. Properties that cost on average £79,687 in 1995 are now worth over £561,309. That's seven times the original value, representing one of the world's most compelling property investment stories over three decades.
Highest For Sale Asking House Prices (£) in Greater London
Updated September 2025
The data represents the average asking prices of properties currently listed for sale in London.
| Rank | Area | Average House Price |
|---|---|---|
| 1 | SW7 (South Kensington) | £2,147,346 |
| 2 | W1 (Mayfair) | £2,137,004 |
| 3 | SW3 (Chelsea) | £1,877,056 |
| 4 | SW1 (Westminster) | £1,622,358 |
| 5 | NW8 (St John's Wood) | £1,302,875 |
| 6 | SW10 (West Brompton) | £1,287,293 |
| 7 | NW3 (Hampstead) | £1,231,111 |
| 8 | W11 (Notting Hill) | £1,199,755 |
| 9 | SW13 (Barnes) | £1,167,887 |
| 10 | SW5 (Earl's Court) | £1,101,587 |
London's most expensive property markets are concentrated in prime Central and West London, with South Kensington (SW7) leading at £2.1 million average prices, closely followed by Mayfair (W1) at £2.1 million. The data reveals the traditional hierarchy of London's luxury property markets, with Chelsea (SW3) at £1.9 million and Westminster (SW1) at £1.6 million completing the ultra-prime quartet. Notably, these premium areas contrast sharply with the affordability seen in outer London, creating a market spread of nearly £2 million between the most and least expensive postcodes. The presence of areas like St John's Wood (NW8) and Hampstead (NW3) demonstrates how North West London competes strongly with traditional SW postcodes for luxury property values.
Lowest For Sale Asking House Prices (£) in Greater London
Updated September 2025
The data represents the average asking prices of properties currently listed for sale in London.
| Rank | Area | Average House Price |
|---|---|---|
| 1 | RM19 (Purfleet) | £223,104 |
| 2 | RM17 (Grays) | £298,301 |
| 3 | RM18 (Tilbury) | £302,833 |
| 4 | DA9 (Greenhithe) | £320,780 |
| 5 | DA8 (Erith) | £343,460 |
| 6 | DA12 (Gravesend) | £363,692 |
| 7 | UB5 (Northolt) | £363,723 |
| 8 | RM15 (South Ockendon) | £366,695 |
| 9 | CR0 (Croydon) | £369,749 |
| 10 | SE20 (Penge) | £372,204 |
The most affordable areas in Greater London are concentrated in the outer Thames Gateway regions, with Purfleet (RM19) offering the lowest average prices at £223,104. The East London corridor from Grays through Tilbury shows consistently affordable pricing, with several postcodes under £305,000. Notably, Croydon (CR0) appears at ninth position with £369,749 average prices, demonstrating how this major regeneration area combines affordability with high transaction volumes. The data reveals that London's most affordable markets cluster around the Thames estuary and outer Essex/Kent borders, offering potential entry points for first-time buyers and investors seeking capital growth opportunities in areas with strong transport links to Central London.
Highest Sold Price Per Square Foot in London (£)
The data represents the average sold price per square foot of properties actually sold in London over the past 18 months.
| Rank | Area | Price Per Square Foot |
|---|---|---|
| 1 | W1 (Mayfair) | £1,777 |
| 2 | SW3 (Chelsea) | £1,690 |
| 3 | SW7 (South Kensington) | £1,610 |
| 4 | W11 (Notting Hill) | £1,430 |
| 5 | W2 (Paddington) | £1,225 |
| 6 | SW5 (Earl's Court) | £1,179 |
| 7 | NW8 (St John's Wood) | £1,152 |
| 8 | NW3 (Hampstead) | £1,106 |
| 9 | W14 (West Kensington) | £991 |
| 10 | SW6 (Fulham) | £978 |
London's price per square foot data reveals the capital's most space-constrained and premium markets, with Mayfair (W1) leading at £1,777 per square foot, followed closely by Chelsea (SW3) at £1,690. This metric provides crucial insight for investors comparing value across different property types and sizes. The data shows the traditional luxury hierarchy remains intact, with the W1-SW3-SW7 triangle commanding the highest space premiums. Notably, areas like Paddington (W2) at £1,225 and Earl's Court (SW5) at £1,179 demonstrate how transport connectivity and regeneration can drive space values, while North West London locations like St John's Wood and Hampstead compete strongly with Central London premiums. These per-square-foot values help investors assess whether larger properties in lower-ranked areas might offer better value than smaller units in prime locations.
Highest House Price Growth (%) in Greater London
The data represents the average house price growth over the past five years, calculated using a blended rolling annual comparison of both sold prices and asking prices.
| Rank | Area | 5 Year Growth Rate |
|---|---|---|
| 1 | HA9 (Wembley) | 39.2% |
| 2 | IG1 (Ilford) | 35.7% |
| 3 | WD4 (Kings Langley) | 33.8% |
| 4 | UB3 (Hayes) | 25.2% |
| 5 | TW5 (Heston) | 21.8% |
| 6 | DA2 (Dartford) | 21.3% |
| 7 | WD23 (Bushey) | 21.2% |
| 8 | WD19 (Watford) | 19.5% |
| 9 | DA1 (Dartford) | 19.5% |
| 10 | UB10 (Hillingdon) | 18.9% |
The highest growth areas in London show substantial 5-year price increases, led by Wembley (HA9) at 39.2% and Ilford (IG1) at 35.7%. However, these figures should be viewed with some caution as they represent average prices across all property types - changes in the mix of properties being sold (such as more detached houses versus flats) can significantly impact these growth rates. Notably, outer London and commuter belt locations dominate the rankings, with areas like Kings Langley (WD4) and Hayes (UB3) showing strong appreciation. This suggests a sustained trend of buyers seeking value in London's peripheral areas, driven by factors such as improved transport links and the rise in remote working. The data reveals particularly strong performance in West London corridors and areas with major infrastructure developments like Crossrail.
Average Monthly Property Sales in London
Updated September 2025
The data represents the average number of residential property sales per month across London's postcode districts, based on transactions recorded over the past 3 months.
| Rank | Area | Average Monthly Sales |
|---|---|---|
| 1 | CR0 (Croydon) | 115 |
| 2 | SW16 (Streatham) | 74 |
| 3 | SW11 (Battersea) | 72 |
| 4 | SW18 (Wandsworth) | 71 |
| 5 | SW19 (Wimbledon) | 71 |
| 6 | SW17 (Tooting) | 56 |
| 7 | SW15 (Putney) | 53 |
| 8 | NW6 (West Hampstead) | 44 |
| 9 | SE15 (Peckham) | 43 |
| 10 | SE18 (Woolwich) | 41 |
CR0 (Croydon) dominates London's property sales with an exceptional 115 transactions monthly - nearly four properties changing hands every day, demonstrating remarkable market confidence in this regeneration area. The data reveals strong performance across South West London, with SW16 (Streatham) achieving 74 monthly sales and the SW11-SW19 corridor (Battersea through Wimbledon) maintaining consistent activity between 56-72 sales monthly.
This South West London cluster represents some of the capital's most active residential markets, combining accessibility, regeneration projects, and diverse housing stock. The contrast with other areas is notable: while NW6 (West Hampstead) achieves respectable volumes at 44 monthly sales, and emerging areas like SE15 (Peckham) show strong momentum with 43 sales, the South West postcodes clearly lead London's transaction activity. Remember that these figures represent the entire market, including different property types and price points, so individual segments may experience faster or slower sales rates.
Highest Number of Planning Applications in London
Updated September 2025
The data represents the average number of planning applications submitted per month in each postcode district, along with the percentage of applications that receive approval.
| Rank | Area | Monthly Applications | Success Rate |
|---|---|---|---|
| 1 | W1 (Mayfair, Marylebone) | 241 | 91% |
| 2 | SW1 (Westminster, Belgravia) | 200 | 93% |
| 3 | N9 (Lower Edmonton) | 118 | 88% |
| 4 | W11 (Notting Hill) | 79 | 92% |
| 5 | SW11 (Battersea) | 76 | 91% |
| 6 | SE18 (Woolwich) | 65 | 78% |
| 7 | EC1 (Clerkenwell, Barbican) | 61 | 92% |
| 8 | EN5 (Barnet) | 59 | 81% |
| 9 | W12 (Shepherd's Bush) | 57 | 92% |
| 10 | UB6 (Greenford) | 57 | 80% |
W1 (Mayfair and Marylebone) dominates London's planning activity with an exceptional 241 applications monthly, reflecting the continuous regeneration and development pressure in Central London's prime commercial districts. SW1 (Westminster and Belgravia) follows with 200 applications and an impressive 93% approval rate, demonstrating the streamlined planning processes for high-value developments in these prestigious areas.
The contrast between areas is particularly telling: while central zones like W11 (Notting Hill), SW11 (Battersea), and EC1 (Clerkenwell) maintain approval rates above 90%, outer London areas such as SE18 (Woolwich) show lower success rates at 78%, suggesting more complex planning challenges in regeneration zones. N9 (Lower Edmonton) stands out as an outlier with 118 monthly applications but only 88% approval, indicating significant development pressure in this rapidly changing North London area.
Property Data Sources
Our location guide relies on diverse, authoritative datasets including:
- HM Land Registry UK House Price Index
- Ministry of Housing, Communities and Local Government
- Ordnance Survey Data Hub
- London Rental Map
- Propertydata.co.uk
We update our property data quarterly to ensure accuracy. Last update: September 2025. All data is presented as provided by our sources without adjustments or amendments.
London Rental Market Analysis
For first-time buyers buying their first rental property, and thinking about how much they can charge for rent across London.
The rental data below gives you an indication on the rental income per month and the rental yields landlords can aim to achieve for traditional assured shorthold tenants. This is helpful if you are starting a residential property portfolio in the Capital.
Highest Average Rental Per Week (£) in Greater London
by postcode district
| Rank | Area | Weekly Rent | Monthly Rent |
|---|---|---|---|
| 1 | NW8 (St John's Wood) | £1,256 | £5,441 |
| 2 | SW7 (South Kensington) | £1,238 | £5,366 |
| 3 | W8 (Kensington) | £1,048 | £4,539 |
| 4 | W1 (Mayfair/Marylebone) | £1,021 | £4,423 |
| 5 | SW1 (Westminster/Belgravia) | £985 | £4,266 |
| 6 | SW3 (Chelsea) | £961 | £4,162 |
| 7 | W11 (Notting Hill) | £902 | £3,908 |
| 8 | SW11 (Battersea) | £883 | £3,827 |
| 9 | WC2 (Covent Garden) | £877 | £3,799 |
| 10 | NW3 (Hampstead) | £826 | £3,578 |
London's highest rental values are concentrated in prime central locations, with St John's Wood (NW8) leading at £1,256 per week and South Kensington (SW7) following closely at £1,238. However, these figures should be viewed with some caution as they represent average rents across all property types - variations in property sizes and specifications can significantly impact these figures. The top rental areas closely align with London's most expensive sales locations, with areas like Kensington (W8) and Mayfair (W1) commanding premium rents. Notably, the rankings show a clear concentration of wealth in central and west London, with areas like Battersea (SW11) demonstrating the ripple effect of prime location premiums extending to neighbouring zones.
Lowest Average Rental Per Week (£) in Greater London
by postcode district
| Rank | Area | Weekly Rent | Monthly Rent |
|---|---|---|---|
| 1 | RM17 (Grays) | £305 | £1,320 |
| 2 | RM18 (Tilbury) | £306 | £1,328 |
| 3 | EN11 (Hoddesdon) | £317 | £1,374 |
| 4 | RM19 (Purfleet) | £326 | £1,411 |
| 5 | DA12 (Gravesend) | £336 | £1,455 |
| 6 | RM16 (Upminster) | £356 | £1,543 |
| 7 | RM9 (Dagenham) | £362 | £1,569 |
| 8 | SE20 (Penge) | £372 | £1,611 |
| 9 | DA15 (Sidcup) | £374 | £1,621 |
| 10 | RM15 (South Ockendon) | £375 | £1,625 |
The most affordable rental areas in London are predominantly located in outer zones and the commuter belt, with Grays (RM17) showing the lowest average weekly rent at £305. However, these figures should be viewed with some caution as they represent average rents across all property types - variations in property sizes and specifications can significantly impact these figures. There's a notable concentration of more affordable rentals in the eastern regions, particularly in the RM (Romford) postal district, with multiple areas like Tilbury, Purfleet, and South Ockendon featuring average weekly rents between £305-£375. Despite their lower rental values, these areas maintain average property prices between £223,000 and £410,000, suggesting potential opportunities for higher rental yields.

Access our selection of exclusive, high-yielding, off-market property deals and a personal consultant to guide you through your options.
Is London Rent High?
Yes, London's rental costs are exceptionally high, particularly when considering average local earnings, and significantly more expensive than regions outside the Capital. However, London residents do benefit from substantially higher incomes than the UK average, though rents still consume a considerable portion of earnings across most areas.
Average rent in London consumes between 31.4% to 86.3% of median local earnings, depending on the area and property type.
The strain is most significant in prime central areas like W1 (West End) where rents reach £1,021 per week, consuming 86.3% of London's median income of £61,511. Westminster (SW1) presents similar challenges, with weekly rents of £985 requiring 83.2% of median earnings, making these areas accessible only to the highest earners or multiple-income households.
Even in London's outer areas, rental costs vary dramatically by region and postcode, though they generally offer more manageable proportions of income compared to central zones.
Here's what residents face across London's regions for rental costs as a percentage of median local income:
North London Rent to Income Ratios:
- N2 (East Finchley) - £579/week (49.0% of median income) - High
- N4 (Finsbury Park) - £573/week (48.4% of median income) - Medium
- N15 (Seven Sisters) - £419/week (35.4% of median income) - Low
East London Rent to Income Ratios:
- E1 (Whitechapel) - £656/week (55.5% of median income) - High
- E6 (East Ham) - £478/week (40.4% of median income) - Medium
- E17 (Walthamstow) - £474/week (40.0% of median income) - Low
South London Rent to Income Ratios:
- SW1 (Westminster) - £985/week (83.2% of median income) - High
- SE4 (Brockley) - £529/week (44.7% of median income) - Medium
- SE20 (Penge) - £372/week (31.4% of median income) - Low
West London Rent to Income Ratios:
- W1 (West End) - £1,021/week (86.3% of median income) - High
- W7 (Hanwell) - £481/week (40.6% of median income) - Medium
- TW13 (Feltham) - £390/week (32.9% of median income) - Low
This demonstrates London's stark rental divide, where outer zone properties remain accessible to median earners while central areas require significantly above-average incomes. Areas like Penge (SE20) and Feltham (TW13) offer the most affordable rental options at around one-third of median income, while premium central locations can consume more than 80% of typical London earnings.
For landlords, these rental levels create interesting investment opportunities across different yield profiles. In our areas of London with the highest rental yields article, we have a comprehensive breakdown of which parts of Greater London offer the best returns for property investors.

Buy-to-Let Considerations
Are London House Prices High?
Yes, London property prices are exceptionally high compared to both the UK average and most other regions, representing the premium investors pay for capital city location, connectivity, and market liquidity.
London's overall average 'sold' property price of £561,309 sits 108.6% above the UK average of £269,079, making it the most expensive property market in the country. However, London's complexity lies in its dramatic price variations between Inner and Outer London, with Inner London averaging £654,524 (143.2% above UK average) while Outer London offers relatively more accessible prices at £510,195 (89.6% above UK average).
The capital's average property asking prices across London postcodes show remarkable variation, from ultra-premium central areas like EC1 (City of London) where properties average over £774,873 to more affordable outer zones like TW13 (Feltham) at £400,357 and DA16 (Welling) at £470,648.
Looking at property types, London's premium extends across all categories yet shows interesting patterns.
Detached homes average £1,163,469 (165.8% above the UK detached average of £437,904), semi-detached houses at £718,637 (164.3% above UK average), terraced properties at £638,278 (181.3% above UK average), and flats at £443,692 (126.1% above UK average).
Notably, terraced houses show the highest premium above national averages, reflecting London's high demand for family homes with outside space.
These substantial premiums across all property types explain why both domestic and international investors view London as requiring significant capital commitment, but also offering unique market depth and potential returns that justify the premium pricing.
Median annual earnings in London are £61,511 (with 2.5% annual growth).
Mean annual earnings in London are £90,578 (with -2.2% annual reduction).
To afford an average priced house in London, residents face affordability ratios significantly higher than most UK regions. Using median earnings, the average London property requires 9.12 times the median annual salary (£561,309 ÷ £61,511). However, this varies dramatically by postcode area:
North London House Price to Salary Ratios:
- N2 (East Finchley) - 22.56 times median annual salary - High
- N8 (Crouch End) - 9.92 times median annual salary - Medium
- N9 (Lower Edmonton) - 6.14 times median annual salary - Low
East London House Price to Salary Ratios:
- E1 (Whitechapel) - 9.96 times median annual salary - High
- E4 (Chingford) - 8.82 times median annual salary - Medium
- E13 (Plaistow) - 6.55 times median annual salary - Low
South London House Price to Salary Ratios:
- SW1 (Westminster) - 26.37 times median annual salary - High
- SE4 (Brockley) - 8.69 times median annual salary - Medium
- SE28 (Thamesmead) - 5.53 times median annual salary - Low
West London House Price to Salary Ratios:
- W1 (West End) - 34.74 times median annual salary - High
- W7 (Hanwell) - 8.11 times median annual salary - Medium
- TW13 (Feltham) - 6.51 times median annual salary - Low
For comparison, the UK's overall affordability ratio shows buyers typically need about 8.51 times their median salary (£269,079 UK average ÷ £31,602 UK median income), making London's 9.12 times average house price to salary ratio, higher but not dramatically so when considered against London's substantially higher earning potential.
This reveals something crucial about London property investment: while absolute prices create significant barriers to entry, the relationship between local earnings and housing costs reflects the capital's unique economic dynamics. London's higher earning potential partially offsets its premium property prices, though substantial capital requirements remain the primary challenge for both owner-occupiers and property investors entering the market.
How Much Deposit to Buy a House in London?
Assuming a 30% deposit for buy-to-let investments, here's an overview of deposit requirements across different London regions and postcodes:
North London
- RM10 (Dagenham): A buy-to-let investor looking at an average property in Dagenham (£372,272) would need to put down a 30% deposit of £111,682, with the potential to achieve an impressive gross rental yield of 5.9%.
- EN3 (Enfield): In Enfield, an investor would need a 30% deposit of £112,202 for an average property (£374,008), potentially benefiting from a strong rental yield of 5.7%.
East London
- IG11 (Barking): An investor in Barking would require a 30% deposit of £92,629 for an average property (£308,763), with the opportunity to earn London's highest rental yield of 7.2%.
- E6 (East Ham): For a buy-to-let purchase in East Ham, an investor would need a 30% deposit of £124,659 for an average property (£415,529), potentially achieving an excellent gross rental yield of 6.0%.
South London
- SE28 (Thamesmead): In Thamesmead, a buy-to-let investor would need a 30% deposit of £101,997 for an average property (£339,991), with the potential to earn a strong yield of 6.4%.
- SE17 (Elephant & Castle): An investor considering Elephant & Castle would need to save a 30% deposit of £175,558 for an average property (£585,194), potentially benefiting from a healthy gross rental yield of 5.5%.
West London
- DA9 (Dartford): In Dartford, a buy-to-let investor would need a 30% deposit of £96,234 for an average property (£320,780), with the potential to achieve an impressive yield of 6.0%.
- DA10 (Swanscombe): For an average property in Swanscombe, an investor would need a 30% deposit of £105,967 for an average property (£353,224), potentially earning an excellent gross yield of 5.6%.
How to Invest in Buy-to-Let in London
For properties to buy in London, including:
- Finding off-market properties
- Buy-to-lets
- Investing in a Holiday let or investing in serviced accommodation
- HMOs (houses of multiple occupation)
- PBSA (purpose-built student accommodation)
- and other high-yielding opportunities
We have partnered with the best property investment agents we can find for 8+ years.
Here you can get access to the latest investment property opportunities from our network.
For more information about specific areas:
- If you're interested in the highest rental returns in London, consider IG11 (Barking) with London's leading yield of 7.2% and SE28 (Thamesmead) at 6.4%, both offering exceptional rental returns with Barking station providing direct access to Central London in 20 minutes and Thamesmead benefiting from the upcoming Elizabeth Line extension.
- For an alternative look at the local London housing market, with affordable entry prices, check out our guide to the cheapest areas to live in London.
- For different opportunities further afield, consider exploring buy-to-let in Brighton or buy-to-let in Reading.
